Tag Archives: AWS Partner Network

AWS Weekly Roundup — Claude 3 Sonnet support in Bedrock, new instances, and more — March 11, 2024

Post Syndicated from Marcia Villalba original https://aws.amazon.com/blogs/aws/aws-weekly-roundup-claude-3-sonnet-support-in-bedrock-new-instances-and-more-march-11-2024/

Last Friday was International Women’s Day (IWD), and I want to take a moment to appreciate the amazing ladies in the cloud computing space that are breaking the glass ceiling by reaching technical leadership positions and inspiring others to go and build, as our CTO Werner Vogels says.Now go build

Last week’s launches
Here are some launches that got my attention during the previous week.

Amazon Bedrock – Now supports Anthropic’s Claude 3 Sonnet foundational model. Claude 3 Sonnet is two times faster and has the same level of intelligence as Anthropic’s highest-performing models, Claude 2 and Claude 2.1. My favorite characteristic is that Sonnet is better at producing JSON outputs, making it simpler for developers to build applications. It also offers vision capabilities. You can learn more about this foundation model (FM) in the post that Channy wrote early last week.

AWS re:Post – Launched last week! AWS re:Post Live is a weekly Twitch livestream show that provides a way for the community to reach out to experts, ask questions, and improve their skills. The show livestreams every Monday at 11 AM PT.

Amazon CloudWatchNow streams daily metrics on CloudWatch metric streams. You can use metric streams to send a stream of near real-time metrics to a destination of your choice.

Amazon Elastic Compute Cloud (Amazon EC2)Announced the general availability of new metal instances, C7gd, M7gd, and R7gd. These instances have up to 3.8 TB of local NVMe-based SSD block-level storage and are built on top of the AWS Nitro System.

AWS WAFNow supports configurable evaluation time windows for request aggregation with rate-based rules. Previously, AWS WAF was fixed to a 5-minute window when aggregating and evaluating the rules. Now you can select windows of 1, 2, 5 or 10 minutes, depending on your application use case.

AWS Partners – Last week, we announced the AWS Generative AI Competency Partners. This new specialization features AWS Partners that have shown technical proficiency and a track record of successful projects with generative artificial intelligence (AI) powered by AWS.

For a full list of AWS announcements, be sure to keep an eye on the What’s New at AWS page.

Other AWS news
Some other updates and news that you may have missed:

One of the articles that caught my attention recently compares different design approaches for building serverless microservices. This article, written by Luca Mezzalira and Matt Diamond, compares the three most common designs for serverless workloads and explains the benefits and challenges of using one over the other.

And if you are interested in the serverless space, you shouldn’t miss the Serverless Office Hours, which airs live every Tuesday at 10 AM PT. Join the AWS Serverless Developer Advocates for a weekly chat on the latest from the serverless space.

Serverless office hours

The Official AWS Podcast – Listen each week for updates on the latest AWS news and deep dives into exciting use cases. There are also official AWS podcasts in several languages. Check out the ones in FrenchGermanItalian, and Spanish.

AWS Open Source News and Updates – This is a newsletter curated by my colleague Ricardo to bring you the latest open source projects, posts, events, and more.

Upcoming AWS events
Check your calendars and sign up for these AWS events:

AWS Summit season is about to start. The first ones are Paris (April 3), Amsterdam (April 9), and London (April 24). AWS Summits are free events that you can attend in person and learn about the latest in AWS technology.

GOTO x AWS EDA Day London 2024 – On May 14, AWS partners with GOTO bring to you the event-driven architecture (EDA) day conference. At this conference, you will get to meet experts in the EDA space and listen to very interesting talks from customers, experts, and AWS.

GOTO EDA Day 2022

You can browse all upcoming in-person and virtual events here.

That’s all for this week. Check back next Monday for another Week in Review!

— Marcia

This post is part of our Weekly Roundup series. Check back each week for a quick roundup of interesting news and announcements from AWS!

Use Snowflake with Amazon MWAA to orchestrate data pipelines

Post Syndicated from Payal Singh original https://aws.amazon.com/blogs/big-data/use-snowflake-with-amazon-mwaa-to-orchestrate-data-pipelines/

This blog post is co-written with James Sun from Snowflake.

Customers rely on data from different sources such as mobile applications, clickstream events from websites, historical data, and more to deduce meaningful patterns to optimize their products, services, and processes. With a data pipeline, which is a set of tasks used to automate the movement and transformation of data between different systems, you can reduce the time and effort needed to gain insights from the data. Apache Airflow and Snowflake have emerged as powerful technologies for data management and analysis.

Amazon Managed Workflows for Apache Airflow (Amazon MWAA) is a managed workflow orchestration service for Apache Airflow that you can use to set up and operate end-to-end data pipelines in the cloud at scale. The Snowflake Data Cloud provides a single source of truth for all your data needs and allows your organizations to store, analyze, and share large amounts of data. The Apache Airflow open-source community provides over 1,000 pre-built operators (plugins that simplify connections to services) for Apache Airflow to build data pipelines.

In this post, we provide an overview of orchestrating your data pipeline using Snowflake operators in your Amazon MWAA environment. We define the steps needed to set up the integration between Amazon MWAA and Snowflake. The solution provides an end-to-end automated workflow that includes data ingestion, transformation, analytics, and consumption.

Overview of solution

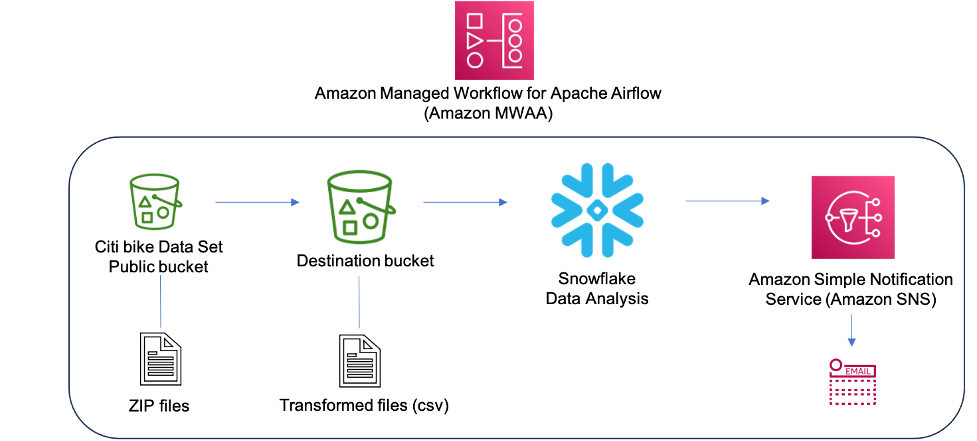
The following diagram illustrates our solution architecture.

Solution Overview

The data used for transformation and analysis is based on the publicly available New York Citi Bike dataset. The data (zipped files), which includes rider demographics and trip data, is copied from the public Citi Bike Amazon Simple Storage Service (Amazon S3) bucket in your AWS account. Data is decompressed and stored in a different S3 bucket (transformed data can be stored in the same S3 bucket where data was ingested, but for simplicity, we’re using two separate S3 buckets). The transformed data is then made accessible to Snowflake for data analysis. The output of the queried data is published to Amazon Simple Notification Service (Amazon SNS) for consumption.

Amazon MWAA uses a directed acyclic graph (DAG) to run the workflows. In this post, we run three DAGs:

The following diagram illustrates this workflow.

DAG run workflow

See the GitHub repo for the DAGs and other files related to the post.

Note that in this post, we’re using a DAG to create a Snowflake connection, but you can also create the Snowflake connection using the Airflow UI or CLI.

Prerequisites

To deploy the solution, you should have a basic understanding of Snowflake and Amazon MWAA with the following prerequisites:

  • An AWS account in an AWS Region where Amazon MWAA is supported.
  • A Snowflake account with admin credentials. If you don’t have an account, sign up for a 30-day free trial. Select the Snowflake enterprise edition for the AWS Cloud platform.
  • Access to Amazon MWAA, Secrets Manager, and Amazon SNS.
  • In this post, we’re using two S3 buckets, called airflow-blog-bucket-ACCOUNT_ID and citibike-tripdata-destination-ACCOUNT_ID. Amazon S3 supports global buckets, which means that each bucket name must be unique across all AWS accounts in all the Regions within a partition. If the S3 bucket name is already taken, choose a different S3 bucket name. Create the S3 buckets in your AWS account. We upload content to the S3 bucket later in the post. Replace ACCOUNT_ID with your own AWS account ID or any other unique identifier. The bucket details are as follows:
    • airflow-blog-bucket-ACCOUNT_ID – The top-level bucket for Amazon MWAA-related files.
    • airflow-blog-bucket-ACCOUNT_ID/requirements – The bucket used for storing the requirements.txt file needed to deploy Amazon MWAA.
    • airflow-blog-bucket-ACCOUNT_ID/dags – The bucked used for storing the DAG files to run workflows in Amazon MWAA.
    • airflow-blog-bucket-ACCOUNT_ID/dags/mwaa_snowflake_queries – The bucket used for storing the Snowflake SQL queries.
    • citibike-tripdata-destination-ACCOUNT_ID – The bucket used for storing the transformed dataset.

When implementing the solution in this post, replace references to airflow-blog-bucket-ACCOUNT_ID and citibike-tripdata-destination-ACCOUNT_ID with the names of your own S3 buckets.

Set up the Amazon MWAA environment

First, you create an Amazon MWAA environment. Before deploying the environment, upload the requirements file to the airflow-blog-bucket-ACCOUNT_ID/requirements S3 bucket. The requirements file is based on Amazon MWAA version 2.6.3. If you’re testing on a different Amazon MWAA version, update the requirements file accordingly.

Complete the following steps to set up the environment:

  1. On the Amazon MWAA console, choose Create environment.
  2. Provide a name of your choice for the environment.
  3. Choose Airflow version 2.6.3.
  4. For the S3 bucket, enter the path of your bucket (s3:// airflow-blog-bucket-ACCOUNT_ID).
  5. For the DAGs folder, enter the DAGs folder path (s3:// airflow-blog-bucket-ACCOUNT_ID/dags).
  6. For the requirements file, enter the requirements file path (s3:// airflow-blog-bucket-ACCOUNT_ID/ requirements/requirements.txt).
  7. Choose Next.
  8. Under Networking, choose your existing VPC or choose Create MWAA VPC.
  9. Under Web server access, choose Public network.
  10. Under Security groups, leave Create new security group selected.
  11. For the Environment class, Encryption, and Monitoring sections, leave all values as default.
  12. In the Airflow configuration options section, choose Add custom configuration value and configure two values:
    1. Set Configuration option to secrets.backend and Custom value to airflow.providers.amazon.aws.secrets.secrets_manager.SecretsManagerBackend.
    2. Set Configuration option to secrets.backend_kwargs and Custom value to {"connections_prefix" : "airflow/connections", "variables_prefix" : "airflow/variables"}.                      Configuration options for secret manager
  13. In the Permissions section, leave the default settings and choose Create a new role.
  14. Choose Next.
  15. When the Amazon MWAA environment us available, assign S3 bucket permissions to the AWS Identity and Access Management (IAM) execution role (created during the Amazon MWAA install).

MWAA execution role
This will direct you to the created execution role on the IAM console.

For testing purposes, you can choose Add permissions and add the managed AmazonS3FullAccess policy to the user instead of providing restricted access. For this post, we provide only the required access to the S3 buckets.

  1. On the drop-down menu, choose Create inline policy.
  2. For Select Service, choose S3.
  3. Under Access level, specify the following:
    1. Expand List level and select ListBucket.
    2. Expand Read level and select GetObject.
    3. Expand Write level and select PutObject.
  4. Under Resources, choose Add ARN.
  5. On the Text tab, provide the following ARNs for S3 bucket access:
    1. arn:aws:s3:::airflow-blog-bucket-ACCOUNT_ID (use your own bucket).
    2. arn:aws:s3:::citibike-tripdata-destination-ACCOUNT_ID (use your own bucket).
    3. arn:aws:s3:::tripdata (this is the public S3 bucket where the Citi Bike dataset is stored; use the ARN as specified here).
  6. Under Resources, choose Add ARN.
  7. On the Text tab, provide the following ARNs for S3 bucket access:
    1. arn:aws:s3:::airflow-blog-bucket-ACCOUNT_ID/* (make sure to include the asterisk).
    2. arn:aws:s3:::citibike-tripdata-destination-ACCOUNT_ID /*.
    3. arn:aws:s3:::tripdata/* (this is the public S3 bucket where the Citi Bike dataset is stored, use the ARN as specified here).
  8. Choose Next.
  9. For Policy name, enter S3ReadWrite.
  10. Choose Create policy.
  11. Lastly, provide Amazon MWAA with permission to access Secrets Manager secret keys.

This step provides the Amazon MWAA execution role for your Amazon MWAA environment read access to the secret key in Secrets Manager.

The execution role should have the policies MWAA-Execution-Policy*, S3ReadWrite, and SecretsManagerReadWrite attached to it.

MWAA execution role policies

When the Amazon MWAA environment is available, you can sign in to the Airflow UI from the Amazon MWAA console using link for Open Airflow UI.

Airflow UI access

Set up an SNS topic and subscription

Next, you create an SNS topic and add a subscription to the topic. Complete the following steps:

  1. On the Amazon SNS console, choose Topics from the navigation pane.
  2. Choose Create topic.
  3. For Topic type, choose Standard.
  4. For Name, enter mwaa_snowflake.
  5. Leave the rest as default.
  6. After you create the topic, navigate to the Subscriptions tab and choose Create subscription.
    SNS topic
  7. For Topic ARN, choose mwaa_snowflake.
  8. Set the protocol to Email.
  9. For Endpoint, enter your email ID (you will get a notification in your email to accept the subscription).

By default, only the topic owner can publish and subscribe to the topic, so you need to modify the Amazon MWAA execution role access policy to allow Amazon SNS access.

  1. On the IAM console, navigate to the execution role you created earlier.
  2. On the drop-down menu, choose Create inline policy.
    MWAA execution role SNS policy
  3. For Select service, choose SNS.
  4. Under Actions, expand Write access level and select Publish.
  5. Under Resources, choose Add ARN.
  6. On the Text tab, specify the ARN arn:aws:sns:<<region>>:<<our_account_ID>>:mwaa_snowflake.
  7. Choose Next.
  8. For Policy name, enter SNSPublishOnly.
  9. Choose Create policy.

Configure a Secrets Manager secret

Next, we set up Secrets Manager, which is a supported alternative database for storing Snowflake connection information and credentials.

To create the connection string, the Snowflake host and account name is required. Log in to your Snowflake account, and under the Worksheets menu, choose the plus sign and select SQL worksheet. Using the worksheet, run the following SQL commands to find the host and account name.

Run the following query for the host name:

WITH HOSTLIST AS 
(SELECT * FROM TABLE(FLATTEN(INPUT => PARSE_JSON(SYSTEM$allowlist()))))
SELECT REPLACE(VALUE:host,'"','') AS HOST
FROM HOSTLIST
WHERE VALUE:type = 'SNOWFLAKE_DEPLOYMENT_REGIONLESS';

Run the following query for the account name:

WITH HOSTLIST AS 
(SELECT * FROM TABLE(FLATTEN(INPUT => PARSE_JSON(SYSTEM$allowlist()))))
SELECT REPLACE(VALUE:host,'.snowflakecomputing.com','') AS ACCOUNT
FROM HOSTLIST
WHERE VALUE:type = 'SNOWFLAKE_DEPLOYMENT';

Next, we configure the secret in Secrets Manager.

  1. On the Secrets Manager console, choose Store a new secret.
  2. For Secret type, choose Other type of secret.
  3. Under Key/Value pairs, choose the Plaintext tab.
  4. In the text field, enter the following code and modify the string to reflect your Snowflake account information:

{"host": "<<snowflake_host_name>>", "account":"<<snowflake_account_name>>","user":"<<snowflake_username>>","password":"<<snowflake_password>>","schema":"mwaa_schema","database":"mwaa_db","role":"accountadmin","warehouse":"dev_wh"}

For example:

{"host": "xxxxxx.snowflakecomputing.com", "account":"xxxxxx" ,"user":"xxxxx","password":"*****","schema":"mwaa_schema","database":"mwaa_db", "role":"accountadmin","warehouse":"dev_wh"}

The values for the database name, schema name, and role should be as mentioned earlier. The account, host, user, password, and warehouse can differ based on your setup.

Secret information

Choose Next.

  1. For Secret name, enter airflow/connections/snowflake_accountadmin.
  2. Leave all other values as default and choose Next.
  3. Choose Store.

Take note of the Region in which the secret was created under Secret ARN. We later define it as a variable in the Airflow UI.

Configure Snowflake access permissions and IAM role

Next, log in to your Snowflake account. Ensure the account you are using has account administrator access. Create a SQL worksheet. Under the worksheet, create a warehouse named dev_wh.

The following is an example SQL command:

CREATE OR REPLACE WAREHOUSE dev_wh 
 WITH WAREHOUSE_SIZE = 'xsmall' 
 AUTO_SUSPEND = 60 
 INITIALLY_SUSPENDED = true
 AUTO_RESUME = true
 MIN_CLUSTER_COUNT = 1
 MAX_CLUSTER_COUNT = 5;

For Snowflake to read data from and write data to an S3 bucket referenced in an external (S3 bucket) stage, a storage integration is required. Follow the steps defined in Option 1: Configuring a Snowflake Storage Integration to Access Amazon S3(only perform Steps 1 and 2, as described in this section).

Configure access permissions for the S3 bucket

While creating the IAM policy, a sample policy document code is needed (see the following code), which provides Snowflake with the required permissions to load or unload data using a single bucket and folder path. The bucket name used in this post is citibike-tripdata-destination-ACCOUNT_ID. You should modify it to reflect your bucket name.

{
  "Version": "2012-10-17",
  "Statement": [
    {
      "Effect": "Allow",
      "Action": [
        "s3:PutObject",
        "s3:GetObject",
        "s3:GetObjectVersion",
        "s3:DeleteObject",
        "s3:DeleteObjectVersion"
      ],
      "Resource": "arn:aws:s3::: citibike-tripdata-destination-ACCOUNT_ID/*"
    },
    {
      "Effect": "Allow",
      "Action": [
        "s3:ListBucket",
        "s3:GetBucketLocation"
      ],
      "Resource": "arn:aws:s3:::citibike-tripdata-destination-ACCOUNT_ID"
    }
  ]
}

Create the IAM role

Next, you create the IAM role to grant privileges on the S3 bucket containing your data files. After creation, record the Role ARN value located on the role summary page.

Snowflake IAM role

Configure variables

Lastly, configure the variables that will be accessed by the DAGs in Airflow. Log in to the Airflow UI and on the Admin menu, choose Variables and the plus sign.

Airflow variables

Add four variables with the following key/value pairs:

  • Key aws_role_arn with value <<snowflake_aws_role_arn>> (the ARN for role mysnowflakerole noted earlier)
  • Key destination_bucket with value <<bucket_name>> (for this post, the bucket used in citibike-tripdata-destination-ACCOUNT_ID)
  • Key target_sns_arn with value <<sns_Arn>> (the SNS topic in your account)
  • Key sec_key_region with value <<region_of_secret_deployment>> (the Region where the secret in Secrets Manager was created)

The following screenshot illustrates where to find the SNS topic ARN.

SNS topic ARN

The Airflow UI will now have the variables defined, which will be referred to by the DAGs.

Airflow variables list

Congratulations, you have completed all the configuration steps.

Run the DAG

Let’s look at how to run the DAGs. To recap:

  • DAG1 (create_snowflake_connection_blog.py) – Creates the Snowflake connection in Apache Airflow. This connection will be used to authenticate with Snowflake. The Snowflake connection string is stored in Secrets Manager, which is referenced in the DAG file.
  • DAG2 (create-snowflake_initial-setup_blog.py) – Creates the database, schema, storage integration, and stage in Snowflake.
  • DAG3 (run_mwaa_datapipeline_blog.py) – Runs the data pipeline, which will unzip files from the source public S3 bucket and copy them to the destination S3 bucket. The next task will create a table in Snowflake to store the data. Then the data from the destination S3 bucket will be copied into the table using a Snowflake stage. After the data is successfully copied, a view will be created in Snowflake, on top of which the SQL queries will be run.

To run the DAGs, complete the following steps:

  1. Upload the DAGs to the S3 bucket airflow-blog-bucket-ACCOUNT_ID/dags.
  2. Upload the SQL query files to the S3 bucket airflow-blog-bucket-ACCOUNT_ID/dags/mwaa_snowflake_queries.
  3. Log in to the Apache Airflow UI.
  4. Locate DAG1 (create_snowflake_connection_blog), un-pause it, and choose the play icon to run it.

You can view the run state of the DAG using the Grid or Graph view in the Airflow UI.

Dag1 run

After DAG1 runs, the Snowflake connection snowflake_conn_accountadmin is created on the Admin, Connections menu.

  1. Locate and run DAG2 (create-snowflake_initial-setup_blog).

Dag2 run

After DAG2 runs, the following objects are created in Snowflake:

  • The database mwaa_db
  • The schema mwaa_schema
  • The storage integration mwaa_citibike_storage_int
  • The stage mwaa_citibike_stg

Before running the final DAG, the trust relationship for the IAM user needs to be updated.

  1. Log in to your Snowflake account using your admin account credentials.
  2. Open your SQL worksheet created earlier and run the following command:
DESC INTEGRATION mwaa_citibike_storage_int;

mwaa_citibike_storage_int is the name of the integration created by the DAG2 in the previous step.

From the output, record the property value of the following two properties:

  • STORAGE_AWS_IAM_USER_ARN – The IAM user created for your Snowflake account.
  • STORAGE_AWS_EXTERNAL_ID – The external ID that is needed to establish a trust relationship.

Now we grant the Snowflake IAM user permissions to access bucket objects.

  1. On the IAM console, choose Roles in the navigation pane.
  2. Choose the role mysnowflakerole.
  3. On the Trust relationships tab, choose Edit trust relationship.
  4. Modify the policy document with the DESC STORAGE INTEGRATION output values you recorded. For example:
{
  "Version": "2012-10-17",
  "Statement": [
    {
      "Effect": "Allow",
      "Principal": {
        "AWS": "arn:aws:iam::5xxxxxxxx:user/mgm4-s- ssca0079"
      },
      "Action": "sts:AssumeRole",
      "Condition": {
        "StringEquals": {
          "sts:ExternalId": "AWSPARTNER_SFCRole=4_vsarJrupIjjJh77J9Nxxxx/j98="
        }
      }
    }
  ]
}

The AWS role ARN and ExternalId will be different for your environment based on the output of the DESC STORAGE INTEGRATION query

Trust relationship

  1. Locate and run the final DAG (run_mwaa_datapipeline_blog).

At the end of the DAG run, the data is ready for querying. In this example, the query (finding the top start and destination stations) is run as part of the DAG and the output can be viewed from the Airflow XCOMs UI.

Xcoms

In the DAG run, the output is also published to Amazon SNS and based on the subscription, an email notification is sent out with the query output.

Email

Another method to visualize the results is directly from the Snowflake console using the Snowflake worksheet. The following is an example query:

SELECT START_STATION_NAME,
COUNT(START_STATION_NAME) C FROM MWAA_DB.MWAA_SCHEMA.CITIBIKE_VW 
GROUP BY 
START_STATION_NAME ORDER BY C DESC LIMIT 10;

Snowflake visual

There are different ways to visualize the output based on your use case.

As we observed, DAG1 and DAG2 need to be run only one time to set up the Amazon MWAA connection and Snowflake objects. DAG3 can be scheduled to run every week or month. With this solution, the user examining the data doesn’t have to log in to either Amazon MWAA or Snowflake. You can have an automated workflow triggered on a schedule that will ingest the latest data from the Citi Bike dataset and provide the top start and destination stations for the given dataset.

Clean up

To avoid incurring future charges, delete the AWS resources (IAM users and roles, Secrets Manager secrets, Amazon MWAA environment, SNS topics and subscription, S3 buckets) and Snowflake resources (database, stage, storage integration, view, tables) created as part of this post.

Conclusion

In this post, we demonstrated how to set up an Amazon MWAA connection for authenticating to Snowflake as well as to AWS using AWS user credentials. We used a DAG to automate creating the Snowflake objects such as database, tables, and stage using SQL queries. We also orchestrated the data pipeline using Amazon MWAA, which ran tasks related to data transformation as well as Snowflake queries. We used Secrets Manager to store Snowflake connection information and credentials and Amazon SNS to publish the data output for end consumption.

With this solution, you have an automated end-to-end orchestration of your data pipeline encompassing ingesting, transformation, analysis, and data consumption.

To learn more, refer to the following resources:


About the authors

Payal Singh is a Partner Solutions Architect at Amazon Web Services, focused on the Serverless platform. She is responsible for helping partner and customers modernize and migrate their applications to AWS.

James Sun is a Senior Partner Solutions Architect at Snowflake. He actively collaborates with strategic cloud partners like AWS, supporting product and service integrations, as well as the development of joint solutions. He has held senior technical positions at tech companies such as EMC, AWS, and MapR Technologies. With over 20 years of experience in storage and data analytics, he also holds a PhD from Stanford University.

Bosco Albuquerque is a Sr. Partner Solutions Architect at AWS and has over 20 years of experience working with database and analytics products from enterprise database vendors and cloud providers. He has helped technology companies design and implement data analytics solutions and products.

Manuj Arora is a Sr. Solutions Architect for Strategic Accounts in AWS. He focuses on Migration and Modernization capabilities and offerings in AWS. Manuj has worked as a Partner Success Solutions Architect in AWS over the last 3 years and worked with partners like Snowflake to build solution blueprints that are leveraged by the customers. Outside of work, he enjoys traveling, playing tennis and exploring new places with family and friends.

Week in Review: Terraform in Service Catalog, AWS Supply Chain, Streaming Response in Lambda, and Amplify Library for Swift – April 10, 2023

Post Syndicated from Sébastien Stormacq original https://aws.amazon.com/blogs/aws/week-in-review-terraform-in-service-catalog-aws-supply-chain-streaming-response-in-lambda-and-amplify-library-for-swift-april-10-2023/

The AWS Summit season has started. AWS Summits are free technical and business conferences happening in large cities across the planet. This week, we were happy to welcome our customers and partners in Sydney and Paris. In France, 9,973 customers and partners joined us for the day to meet and exchange ideas but also to attend one of the more than 145 technical breakout sessions and the keynote. This is the largest cloud computing event in France, and I can’t resist sharing a picture from the main room during the opening keynote.

AWS Summit Paris keynote

There are AWS Summits on all continents ; you can find the list and the links for registration here https://aws.amazon.com/events/summits. The next on my agenda are listed at the end of this post.

These two Summits did not slow down our services teams. I counted 44 new capabilities since last Monday. Here are the few that caught my attention.

Last Week on AWS

AWS Lambda response streaming – Response streaming is a new invocation pattern that lets functions progressively stream response payloads back to clients. You can use Lambda response payload streaming to send response data to callers as it becomes available. Response streaming also allows you to build functions that return larger payloads and perform long-running operations while reporting incremental progress (within the 15 minutes execution period). My colleague Julian wrote an incredibly detailed blog post to help you to get started.

AWS Supply Chain Now Generally Available – AWS Supply Chain is a cloud application that mitigates risk and lowers costs with unified data and built-in contextual collaboration. It connects to your existing enterprise resource planning (ERP) and supply chain management systems to bring you ML-powered actionable insights into your supply chain.

AWS Service Catalog Supports Terraform Templates – With AWS Service Catalog, you can create, govern, and manage a catalog of infrastructure as code (IaC) templates that are approved for use on AWS. You can now define AWS Service Catalog products and their resources using either AWS CloudFormation or Hashicorp Terraform and choose the tool that better aligns with your processes and expertise.

Amazon S3 enforces two security best practices and brings new visibility into object replication status – As announced on December 13, 2022, Amazon S3 is now deploying two new default bucket security settings by automatically enabling S3 Block Public Access and disabling S3 access control lists (ACLs) for all new S3 buckets. Amazon S3 also adds a new Amazon CloudWatch metric that can be used to diagnose and correct S3 Replication configuration issues more quickly. The OperationFailedReplication metric, available in both the Amazon S3 console and in Amazon CloudWatch, gives you per-minute visibility into the number of objects that did not replicate to the destination bucket for each of your replication rules.

AWS Security Hub launches four security best practicesAWS Security Hub has released 4 new controls for its National Institute of Standards and Technology (NIST) SP 800-53 Rev. 5 standard. These controls conduct fully-automatic security checks against Elastic Load Balancing (ELB), Amazon Elastic Kubernetes Service (Amazon EKS), Amazon Redshift, and Amazon Simple Storage Service (Amazon S3). To use these controls, you should first turn on the NIST standard.

AWS Cloud Operation Competency Partners – AWS Cloud Operations covers five fundamental solution areas: Cloud Governance, Cloud Financial Management, Monitoring and Observability, Compliance and Auditing, and Operations Management. The new competency enables customers to select validated AWS Partners who offer comprehensive solutions with an integrated approach across multiple areas.

Amplify Library for Swift on macOS – Amplify is an open-source, client-side library making it easier to access a cloud backend from your front-end application code. It provides language-specific constructs to abstract low-level details of the cloud API. It helps you to integrate services such as analytics, object storage, REST or GraphQL APIs, user authentication, geolocation and mapping, and push notifications. You can now write beautiful macOS applications that connect to the same cloud backend as their iOS counterparts.

X in Y Jeff started this section a while ago to list the expansion of new services and capabilities to additional Regions. I noticed 11 Regional expansions this week:

Upcoming AWS Events
And to finish this post, I recommend you check your calendars and sign up for these AWS-led events:

Dot Net Developer Day.Net Developer Day.NET Enterprise Developer Day EMEA 2023 (April 25) is a free, one-day virtual conference providing enterprise developers with the most relevant information to swiftly and efficiently migrate and modernize their .NET applications and workloads on AWS.

AWS re:Inforce 2023 – Now register AWS re:Inforce, in Anaheim, California, June 13–14. AWS Chief Information Security Officer CJ Moses will share the latest innovations in cloud security and what AWS Security is focused on. The breakout sessions will provide real-world examples of how security is embedded into the way businesses operate. To learn more and get the limited discount code to register, see CJ’s blog post of Gain insights and knowledge at AWS re:Inforce 2023 in the AWS Security Blog.

AWS Global Summits – Check your calendars and sign up for the AWS Summit close to where you live or work: Seoul (May 3–4), Berlin and Singapore (May 4), Stockholm (May 11), Hong Kong (May 23), Amsterdam (June 1), London (June 7), Madrid (June 15), and Milano (June 22).

AWS Community Day – Join community-led conferences driven by AWS user group leaders close to your city: Lima (April 15), Helsinki (April 20), Chicago (June 15), Manila (June 29–30), and Munich (September 14). Recently, we have been bringing together AWS user groups from around the world into Meetup Pro accounts. Find your group and its meetups in your city!

You can browse all upcoming AWS-led in-person and virtual events, and developer-focused events such as AWS DevDay.

Stay Informed
That was my selection for this week! To better keep up with all of this news, don’t forget to check out the following resources:

That’s all for this week. Check back next Monday for another Week in Review!

— seb

This post is part of our Week in Review series. Check back each week for a quick roundup of interesting news and announcements from AWS!

AWS Week in Review – August 15, 2022

Post Syndicated from Channy Yun original https://aws.amazon.com/blogs/aws/aws-week-in-review-august-15-2022/

I love the AWS Twitch channel for watching interesting online live shows such as AWS On Air, Containers from the Couch, and Serverless Office Hours.

Last week, AWS Storage Day 2022 was hosted virtually on the AWS Twitch channel and covered recent announcements and insights that address customers’ needs to reduce and optimize storage costs and build data resiliency into their organization. For example, we pre-announced Amazon File Cache, an upcoming new service on AWS that accelerates and simplifies hybrid cloud workloads. To learn more, watch the on-demand recording.

Two weeks ago, AWS Silicon Innovation Day 2022 was also hosted on the AWS Twitch channel. This event covered an overview of our history of silicon development and provided useful sessions on specific AWS chip innovations such as AWS NitroAWS GravitonAWS Inferencia, and AWS Trainium. To learn more, watch the on-demand recording. If you don’t miss such useful live events or online shows, check out the upcoming live schedule!

Last Week’s Launches
Here are some launches that caught my eye last week:

AWS Private 5G – With the general availability of AWS Private 5G, you can easily make your own private mobile networks with a powerful box of hardware and software for 4G/LTE mobile networks. This cool new service lets you easily install, operate, and scale high reliability and low latency of a private cellular network in a matter of days and does not require any specialized expertise. You pay only for the network coverage and capacity that you need.

AWS DeepRacer Student Community Races – Educators and event organizers can now create their own private virtual autonomous racing league for students by powering a 1/18th scale race car driven by reinforcement learning. They can select their own track, race date, and time and invite students to participate through a unique link for their event. To learn more, see the AWS DeepRacer Developer Guide.

Amazon SageMaker Updates – Amazon SageMaker Automatic Model Tuning now supports specifying multiple alternate SageMaker training instance types to make tuning jobs more robust when the preferred instance type is not available due to insufficient capacity. SageMaker Model Pipelines supports securely sharing pipeline entities across AWS accounts and access to shared pipelines through direct API calls. SageMaker Canvas expands capabilities to better prepare and analyze data, including replacing missing values and outliers and the flexibility to choose different sample sizes for your datasets.

Amazon Personalize Updates – Amazon Personalize supports incremental bulk dataset imports, a new option for updating your data and improving the quality of your recommendations. Also, Amazon Personalize allows you to promote specific items in all users’ recommendations based on rules that align with your business goals.

AWS Partner Program Updates – We announce the new AWS Transfer Family Delivery Program for AWS Partners that helps customers build sophisticated Managed File Transfer (MFT) and business-to-business (B2B) file exchange solutions with AWS Transfer Family. Also, we introduce the new AWS Supply Chain Competency, featuring top AWS Partners who provide professional services and cloud-native supply chain solutions on AWS.

For a full list of AWS announcements, be sure to keep an eye on the What’s New at AWS page.

Other AWS News
Here are some other news items that you may find interesting:

AWS CDK for Terraform – Two years ago, AWS began collaborating with HashiCorp to develop Cloud Development Kit for Terraform (CDKTF), an open-source tool that provides a developer-friendly workflow for deploying cloud infrastructure with Terraform in their preferred programming language. The CDKTF is now generally available, so try CDK for Terraform and AWS CDK.

Smithy Interface Definition Language (IDL) 2.0 – Smithy is Amazon’s next-generation API modeling language, based on our experience building tens of thousands of services and generating SDKs. This release focuses on improving the developer experience of authoring Smithy models and using code generated from Smithy models.

Serverless Snippets Collection – The AWS Serverless Developer Advocate team introduces the snippets collection to enable reusable, tested, and recommended snippets driven and maintained by the community. Builders can use serverless snippets to find and integrate tools and code examples to help with their development workflow. I recommend searching other useful resources such as Serverless patterns and workflows collection to get started on your serverless application.

Upcoming AWS Events
Check your calendars and sign up for these AWS events:

AWS Summit

AWS Summit – Registration is open for upcoming in-person AWS Summits that might be close to you in August and September: Anaheim (August 18), Chicago (August 28), Canberra (August 31), Ottawa (September 8), New Delhi (September 9), and Mexico City (September 21–22).

AWS Innovate – Data Edition – On August 23, learn how a modern data strategy can support your present and future use cases, including steps to build an end-to-end data solution to store and access, analyze and visualize, and even predict.

AWS Innovate – For Every Application Edition – On August 25, learn about a wide selection of AWS solutions across compute, storage, networking, hybrid, and edge infrastructure to help you scale application resources seamlessly and optimally.

Although these two Innovate events will be held in the Asia Pacific and Japan time zones, you can view on-demand videos for two months following your registration.

Also, we are preparing 16 upcoming online tech talks on August 15–26  to cover a range of topics and expertise levels and feature technical deep dives, demonstrations, customer examples, and live Q&A with AWS experts.

That’s all for this week. Check back next Monday for another Week in Review!

— Channy

This post is part of our Week in Review series. Check back each week for a quick roundup of interesting news and announcements from AWS!

AWS Partner Network (APN) – 10 Years and Going Strong

Post Syndicated from Jeff Barr original https://aws.amazon.com/blogs/aws/aws-partner-network-apn-10-years-and-going-strong/

AWS 10 Years with animated flamesTen years ago we launched AWS Partner Network (APN) in beta form for our partners and our customers. In his post for the beta launch, my then-colleague Jinesh Varia noted that:

Partners are an integral part of the AWS ecosystem as they enable customers and help them scale their business globally. Some of our greatest wins, particularly with enterprises, have been influenced by our Partners.

A decade later, as our customers work toward digital transformation, their needs are becoming more complex. As part of their transformation they are looking for innovation, differentiating solutions, and routinely ask us to refer them to partners with the right skills and the specialized capabilities that will help them to make the best of use AWS services.

The partners, in turn, are stepping up to the challenge and driving innovation on behalf of their customers in ways that transform multiple industries. This includes migration of workloads, modernization of existing code & architectures, and the development of cloud-native applications.

Thank You, Partners
AWS Partners all around the world are doing amazing work! Integrators like Presidio in the US, NEC in Japan, Versent in Australia, T-Systems International in Germany, and Compasso UOL in Latin America are delivering some exemplary transformations on AWS. On the product side, companies like Megazone Cloud (Asia/Pacific) are partnering with global ISVs such as Databricks, Datadog, and New Relic to help them go to market. Many other ISV Partners are working to reinvent their offerings in order to take advantage of specific AWS services and features. The list of such partners is long, and includes Infor, VTEX, and Iron Mountain, to name a few.

In 2021, AWS and our partners worked together to address hundreds of thousands of customer opportunities. Partners like Snowflake, logz.io, and Confluent have told us that AWS Partner program such as ISV Accelerate and AWS Global Startup Program are having a measurable impact on their businesses.

These are just a few examples (we have many more success stories), but the overall trend should be pretty clear — transformation is essential, and AWS Partners are ready, willing, and able to make it happen.

As part of our celebration of this important anniversary, the APN Blog will be sharing a series of success stories that focus on partner-driven customer transformation!

A Decade of Partner-Driven Innovation and Evolution
We launched APN in 2012 with a few hundred partners. Today, AWS customers can choose offerings from more than 100,000 partners in more than 150 countries.

A lot of this growth can be traced back to our first Leadership Principle, Customer Obsession. Most of our services and major features have their origins in customer requests and APN is no different: we build programs that are designed to meet specific, expressed needs of our customers. Today, we continue to seek and listen to partner feedback, use that feedback to innovate and to experiment, and to get it to market as quickly as possible.

Let’s take a quick trip through history and review some of the most interesting APN milestones of the last decade:

In 2012, we first announced the partner type (Consulting and Technology) model when APN came to life. With each partner type, partners could qualify for one of the three tiers (Select, Advanced, and Premier) and achieve benefits based on their tier.

In 2013, AWS Partners told us they wanted to stand out in the industry. To allow partners to differentiate their offerings to customers and show expertise in building solutions, we introduced the first two of what is now a very long list of competencies.

In 2014, we launched the AWS Managed Service Provider Program to help customers find partners who can help with migration to the AWS cloud, along with the AWS SaaS Factory program to support partners looking to build and accelerate delivery of SaaS (Software as a Service) solutions on behalf of their customers. We also launched the APN Blog channel to bring partner success stories with AWS and customers to life. Today, the APN Blog is one of the most popular blogs at AWS.

Next in 2016, customers started to ask us where to go when looking for a partner that can help design, migrate, manage, and optimize their workloads on AWS, or for partner-built tools that can help them achieve their goals. To help them more easily find the right partner and solution for their specific business needs, we launched the AWS Partner Solutions Finder, a new website where customers could search for, discover, and connect with AWS Partners.

In 2017, to allow partners to showcase their earned AWS designations to customers, we introduced the Badge Manager. The dynamic tool allows partners to build customized AWS Partner branded badges to highlight their success with AWS to customers.

In 2018, we launched several new programs and features to better support our partners gain AWS expertise and promote their offerings to customers including AWS Device Qualification program, AWS Well-Architected Partner Program, and several competencies.

In 2019, for mid-to-late stage startups seeking support with product development, go-to-market and co-sell, we launched the AWS Global Startup program. We also launched the AWS Service Ready Program to help customers find validated partner products that work with AWS services.

Next, in 2020 to help organizations co-sell, drive new business and accelerate sales cycles we launched the AWS ISV Accelerate program.

In 2021 our partners told us that they needed more (and faster) ways to work with AWS so that they could meet the ever-growing needs of their customers. We launched AWS Partner Paths in order to accelerate partner engagement with AWS.

Partner Paths replace technology and consulting partner type models—evolving to an offering type model. We now offer five Partner Paths—Software Path, Hardware Path, Training Path, Distribution Path, and Services Path—which represents consulting, professional, managed, or value-add resale services. This new framework provides a curated journey through partner resources, benefits, and programs.

Looking Ahead
As I mentioned earlier, Customer Obsession is central to everything that we do at AWS. We see partners as our customers, and we continue to obsess over ways to make it easier and more efficient for them to work with us. For example, we continue to focus on partner specialization and have developed a deep understanding of the ways that our customers find it to be of value.

Our goal is to empower partners with tools that make it easy for them to navigate through our selection of enablement resources, benefits, and programs and find those that help them to showcase their customer expertise and to get-to-market with AWS faster than ever. The new AWS Partner Central (login required) and AWS Partner Marketing Central experiences that we launched earlier this year are part of this focus.

To wrap up, I would like to once again thank our partner community for all of their support and feedback. We will continue to listen, learn, innovate, and work together with you to invent the future!

Jeff;

Best practices to optimize your Amazon Redshift and MicroStrategy deployment

Post Syndicated from Ranjan Burman original https://aws.amazon.com/blogs/big-data/best-practices-to-optimize-your-amazon-redshift-and-microstrategy-deployment/

This is a guest blog post co-written by Amit Nayak at Microstrategy. In their own words, “MicroStrategy is the largest independent publicly traded business intelligence (BI) company, with the leading enterprise analytics platform. Our vision is to enable Intelligence Everywhere. MicroStrategy provides modern analytics on an open, comprehensive enterprise platform used by many of the world’s most admired brands in the Fortune Global 500. Optimized for cloud and on-premises deployments, the platform features HyperIntelligence, a breakthrough technology that overlays actionable enterprise data on popular business applications to help users make smarter, faster decisions.”


Amazon Redshift is a fast, fully managed, petabyte-scale data warehouse. It provides a simple and cost-effective way to analyze all your data using your existing BI tools. Amazon Redshift delivers fast query performance by using columnar storage technology to improve I/O efficiency and parallelizing queries across multiple nodes. Amazon Redshift has custom JDBC and ODBC drivers that you can download from the Connect Client tab on the Amazon Redshift console, allowing you to use a wide range of familiar BI tools.

When using your MicroStrategy application with Amazon Redshift, it’s important to understand how to optimize Amazon Redshift to get the best performance to meet your workload SLAs.

In this post, we look at the best practices for optimized deployment of MicroStrategy using Amazon Redshift.

Optimize Amazon Redshift

In this section, we discuss ways to optimize Amazon Redshift.

Amazon Redshift RA3 instances

RA3 nodes with managed storage help you optimize your data warehouse by scaling and paying for the compute capacity and managed storage independently. With RA3 instances, you can choose the number of nodes based on your performance requirements, and only pay for the managed storage that you use. Size your RA3 cluster based on the amount of data you process daily without increasing your storage costs.

For additional details about RA3 features, see Amazon Redshift RA3 instances with managed storage.

Distribution styles

When you load data into a table, Amazon Redshift distributes the rows of the table to each of the compute nodes according to the table’s distribution style. When you run a query, the query optimizer redistributes the rows to the compute nodes as needed to perform any joins and aggregations. The goal in choosing a table distribution style is to minimize the impact of the redistribution step by locating the data where it needs to be before the query is run.

When you create a table, you can designate one of four distribution styles: AUTO, EVEN, KEY, or ALL. If you don’t specify a distribution style, Amazon Redshift uses AUTO distribution. With AUTO distribution, Amazon Redshift assigns an optimal distribution style based on the size of the table data. You can use automatic table optimization to get started with Amazon Redshift easily or optimize production workloads while decreasing the administrative effort required to get the best possible performance.

MicroStrategy, like any SQL application, transparently takes advantage of the distribution style defined on base tables. MicroStrategy recommends following Amazon Redshift recommended best practices when implementing the physical schema of the base tables.

Sort keys

Defining a table with a sort key results in the physical ordering of data in the Amazon Redshift cluster nodes based on the sort type and the columns chosen in the key definition. Sorting enables efficient handling of range-restricted predicates to scan the minimal number of blocks on disk to satisfy a query. A contrived example would be having an orders table with 5 years of data with a SORTKEY on the order_date column. Now suppose a query on the orders table specifies a date range of 1 month on the order_date column. In this case, you can eliminate up to 98% of the disk blocks from the scan. If the data isn’t sorted, more of the disk blocks (possibly all of them) have to be scanned, resulting in the query running longer.

We recommend creating your tables with SORTKEY AUTO. This way, Amazon Redshift uses automatic table optimization to choose the sort key. If Amazon Redshift determines that applying a SORTKEY improves cluster performance, tables are automatically altered within hours from the time the cluster was created, with minimal impact to queries.

We also recommend using the sort key on columns often used in the WHERE clause of the report queries. Keep in mind that SQL functions (such as data transformation functions) applied to sort key columns in queries reduce the effectiveness of the sort key for those queries. Instead, make sure that you apply the functions to the compared values so that the sort key is used. This is commonly found on DATE columns that are used as sort keys.

Amazon Redshift Advisor provides recommendations to help you improve the performance and decrease the operating costs for your Amazon Redshift cluster. The Advisor analyzes your cluster’s workload to identify the most appropriate distribution key and sort key based on the query patterns of your cluster.

Compression

Compression settings can also play a big role when it comes to query performance in Amazon Redshift. Compression conserves storage space and reduces the size of data that is read from storage, which reduces the amount of disk I/O and therefore improves query performance.

By default, Amazon Redshift automatically manages compression encoding for all columns in a table. You can specify the ENCODE AUTO option for the table to enable Amazon Redshift to automatically manage compression encoding for all columns in a table. You can alternatively apply a specific compression type to the columns in a table manually when you create the table, or you can use the COPY command to analyze and apply compression automatically.

We don’t recommend compressing the first column in a compound sort key because it might result in scanning more rows than expected.

Amazon Redshift materialized views

Materialized views can significantly boost query performance for repeated and predictable analytical workloads such as dashboarding, queries from BI tools, and extract, load, and transform (ELT) data processing.

Materialized views are especially useful for queries that are predictable and repeated over and over. Instead of performing resource-intensive queries on large tables, applications can query the pre-computed data stored in the materialized view.

For example, consider the scenario where a set of queries is used to populate a collection of charts for a dashboard. This use case is ideal for a materialized view, because the queries are predictable and repeated over and over again. Whenever a change occurs in the base tables (data is inserted, deleted, or updated), the materialized views can be automatically or manually refreshed to represent the current data.

Amazon Redshift can automatically refresh materialized views with up-to-date data from its base tables when materialized views are created with or altered to have the auto-refresh option. Amazon Redshift auto-refreshes materialized views as soon as possible after base tables changes.

To update the data in a materialized view manually, you can use the REFRESH MATERIALIZED VIEW statement at any time. There are two strategies for refreshing a materialized view:

  • Incremental refresh – In an incremental refresh, it identifies the changes to the data in the base tables since the last refresh and updates the data in the materialized view
  • Full refresh – If incremental refresh isn’t possible, Amazon Redshift performs a full refresh, which reruns the underlying SQL statement, replacing all the data in the materialized view

Amazon Redshift automatically chooses the refresh method for a materialized view depending on the SELECT query used to define the materialized view. For information about the limitations for incremental refresh, see Limitations for incremental refresh.

The following are some of the key advantages using materialized views:

  • You can speed up queries by pre-computing the results of complex queries, including multiple base tables, predicates, joins, and aggregates
  • You can simplify and accelerate ETL and BI pipelines
  • Materialized views support Amazon Redshift local, Amazon Redshift Spectrum, and federated queries
  • Amazon Redshift can use automatic query rewrites of materialized views

For example, let’s consider the sales team wants to build a report that shows
the product sales across different stores. This dashboard query is based out of a 3 TB Cloud DW benchmark dataset based on the TPC-DS benchmark dataset.

In this first step, you create a regular view. See the following code:

create view vw_product_sales
as
select 
	i_brand,
	i_category,
	d_year,
	d_quarter_name,
	s_store_name,
	sum(ss_sales_price) as total_sales_price,
	sum(ss_net_profit) as total_net_profit,
	sum(ss_quantity) as total_quantity
from
store_sales ss, item i, date_dim d, store s
where ss.ss_item_sk=i.i_item_sk
and ss.ss_store_sk = s.s_store_sk
and ss.ss_sold_date_sk=d.d_date_sk
and d_year = 2000
group by i_brand,
	i_category,
	d_year,
	d_quarter_name,
	s_store_name;

The following code is a report to analyze the product sales by category:

SELECT 
	i_category,
	d_year,
	d_quarter_name,
    sum(total_quantity) as total_quantity
FROM vw_product_sales
GROUP BY 
i_category,
	d_year,
	d_quarter_name
ORDER BY 3 desc

The preceding reports take approximately 15 seconds to run. As more products are sold, this elapsed time gradually gets longer. To speed up those reports, you can create a materialized view to precompute the total sales per category. See the following code:

create materialized view mv_product_sales
as
select 
	i_brand,
	i_category,
	d_year,
	d_quarter_name,
	s_store_name,
	sum(ss_sales_price) as total_sales_price,
	sum(ss_net_profit) as total_net_profit,
	sum(ss_quantity) as total_quantity
from 
store_sales ss, item i, date_dim d, store s
where ss.ss_item_sk=i.i_item_sk
and ss.ss_store_sk = s.s_store_sk
and ss.ss_sold_date_sk=d.d_date_sk
and d_year = 2000
group by i_brand,
	i_category,
	d_year,
	d_quarter_name,
	s_store_name;

The following code analyzes the product sales by category against the materialized view:

SELECT 
	i_category,
	d_year,
	d_quarter_name,
    sum(total_quantity) as total_quantity
FROM mv_product_sales
GROUP BY 
i_category,
	d_year,
	d_quarter_name
ORDER BY 3 desc;

The same reports against a materialized view took around 4 seconds because the new queries access precomputed joins, filters, grouping, and partial sums instead of the multiple, larger base tables.

Workload management

Amazon Redshift workload management (WLM) enables you to flexibly manage priorities within workloads so that short, fast-running queries don’t get stuck in queues behind long-running queries. You can use WLM to define multiple query queues and route queries to the appropriate queues at runtime.

You can query WLM in two modes:

  • Automatic WLM – Amazon Redshift manages the resources required to run queries. Amazon Redshift determines how many queries run concurrently and how much memory is allocated to each dispatched query. Amazon Redshift uses highly trained sophisticated ML algorithms to make these decisions.
  • Query priority is a feature of automatic WLM that lets you assign priority ranks to different user groups or query groups, to ensure that higher-priority workloads get more resources for consistent query performance, even during busy times. For example, consider a critical dashboard report query that has higher priority than an ETL job. You can assign the priority as highest for the report query and high priority to the ETL query.
  • No queries are ever starved of resources, and lower priority queries always complete, but may just take longer to complete.
  • Manual WLM – With manual WLM, you can manage the system performance by modifying the WLM configuration to create separate queues for long-running queries and short-running queries. You can define up to eight queues to separate workloads from each other. Each queue contains a number of query slots, and each queue is associated with a portion of available memory.

You can also use the Amazon Redshift query monitoring rules (QMR) feature to set metrics-based performance boundaries for workload management (WLM) queues, and specify what action to take when a query goes beyond those boundaries. For example, for a queue that’s dedicated to short-running queries, you might create a rule that cancels queries that run for more than 60 seconds. To track poorly designed queries, you might have another rule that logs queries that contain nested loops. You can use predefined rule templates in Amazon Redshift to get started with QMR.

We recommend the following configuration for WLM:

  • Enable automatic WLM
  • Enable concurrency scaling to handle an increase in concurrent read queries, with consistent fast query performance
  • Create QMR rules to track and handle poorly written queries

After you create and configure different WLM queues, you can use a MicroStrategy query label to set the Amazon Redshift query group for queue assignment. This tells Amazon Redshift which WLM queue to send the query to.

You can set the following as a report pre-statement in MicroStrategy:

set query_group to 'mstr_dashboard';

You can use MicroStrategy query labels to identify the MicroStrategy submitted SQL statements within Amazon Redshift system tables.

You can use it with all SQL statement types; therefore, we recommend using it for multi-pass SQL reports. When the label of a query is stored in the system view stl_query, it’s truncated to 15 characters (30 characters are stored in all other system tables). For this reason, you should be cautious when choosing the value for query label.

You can set the following as a report pre-statement:

set query_group to 'MSTR=!o;Project=!p;User=!u;Job=!j;'

This collects information on the server side about variables like project name, report name, user, and more.

To clean up the query group and release resources, use the cleanup post-statement:

reset query_group;

MicroStrategy allows the use of wildcards that are replaced by values retrieved at a report’s run time, as shown in the pre- and post-statements. The following table provides an example of pre- and post-statements.

VLDB Category VLDB Property Setting Value Example
Pre/Post Statements Report Pre-statement set query_group to 'MSTR=!o;Project=!p;User=!u;Job=!j;'
Pre/Post Statements Cleanup Post-statement reset query_group;

For example, see the following code:

VLDB Property Report Pre Statement = set query_group to 'MSTRReport=!o;'
set query_group to 'MSTRReport=Cost, Price, and Profit per Unit;'

Query prioritization in MicroStrategy

In general, you may have multiple applications submitting queries to Amazon Redshift in addition to MicroStrategy. You can use Amazon Redshift query groups to identify MicroStrategy submitted SQL to Amazon Redshift, along with its assignment to the appropriate Amazon Redshift WLM queue.

The Amazon Redshift query group for a MicroStrategy report is set and reset through the use of the following report-level MicroStrategy VLDB properties.

VLDB Category VLDB Property Setting Value Example
Pre/Post Statements Report Pre-statement set query_group to 'MSTR_High=!o;'
Pre/Post Statements Cleanup Post-statement reset query_group;

A MicroStrategy report job can submit one or more queries to Amazon Redshift. In such cases, all queries for a MicroStrategy report are labeled with the same query group and therefore are assigned to same queue in Amazon Redshift.

The following is an example implementation of MicroStrategy Amazon Redshift WLM:

  • High-priority MicroStrategy reports are set with report pre-statement MSTR_HIGH=!o;, medium priority reports with MSTR_MEDIUM=!o;, and low priority reports with MSTR_LOW=!o;.
  • Amazon Redshift WLM queues are created and associated with corresponding query groups. For example, the MSTR_HIGH_QUEUE queue is associated with the MSTR_HIGH=*; query group (where * is an Amazon Redshift wildcard).

Concurrency scaling

With concurrency scaling, you can configure Amazon Redshift to handle spikes in workloads while maintaining consistent SLAs by elastically scaling the underlying resources as needed. When concurrency scaling is enabled, Amazon Redshift continuously monitors the designated workload. If the queries start to get backlogged because of bursts of user activity, Amazon Redshift automatically adds transient cluster capacity and routes the requests to these new clusters. You manage which queries are sent to the concurrency scaling cluster by configuring the WLM queues. This happens transparently in a matter of seconds, so your queries continue to be served with low latency. In addition, every 24 hours that the Amazon Redshift main cluster is in use, you accrue a 1-hour credit towards using concurrency scaling. This enables 97% of Amazon Redshift customers to benefit from concurrency scaling at no additional charge.

For more details on concurrency scaling pricing, see Amazon Redshift pricing.

Amazon Redshift removes the additional transient capacity automatically when activity reduces on the cluster. You can enable concurrency scaling for the MicroStrategy report queue and in case of heavy load on the cluster, the queries run on a concurrent cluster, thereby improving the overall dashboard performance and maintaining a consistent user experience.

To make concurrency scaling work with MicroStrategy, use derived tables instead of temporary tables, which you can do by setting the VLDB property Intermediate table type to Derived table.

In the following example, we enable concurrency scaling on the Amazon Redshift cluster for the MicroStrategy dashboard queries. We create a user group in Amazon Redshift, and all the dashboard queries are allocated to this user group’s queue. With concurrency scaling in place for the report queries, we can see a significant reduction in query wait time.

For this example, we created one WLM queue to run our dashboard queries with highest priority and another ETL queue with high priority. Concurrency scaling is turned on for the dashboard queue, as shown in the following screenshot.

As part of this test, we ran several queries in parallel on the cluster, some of which are ETL jobs (insert, delete, update, and copy), and some are complex select queries, such as dashboard queries. The following graph illustrates how many queries are waiting in the WLM queues and how concurrency scaling helps to address those queries.

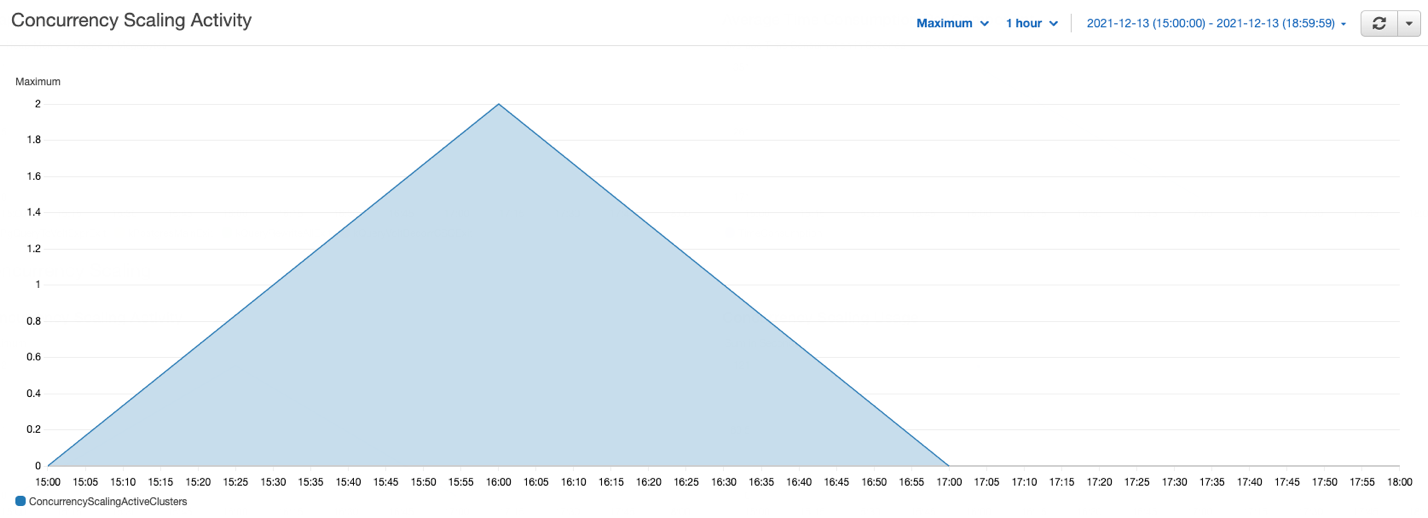
In the preceding graph, several queries are waiting in the WLM queues; concurrency scaling automatically starts in seconds to process queries without any delays, as shown in the following graph.

This example has demonstrated how concurrency scaling helps handle spikes in user workloads by adding transient clusters as needed to provide consistent performance even as the workload grows to hundreds of concurrent queries.

Amazon Redshift federated queries

Customers using MicroStrategy often connect various relational data sources to a single MicroStrategy project for reporting and analysis purposes. For example, you might integrate an operational (OLTP) data source (such as Amazon Aurora PostgreSQL) and data warehouse data to get meaningful insights into your business.

With federated queries in Amazon Redshift, you can query and analyze data across operational databases, data warehouses, and data lakes. The federated query feature allows you to integrate queries from Amazon Redshift on live data in external databases with queries across your Amazon Redshift and Amazon Simple Storage Service (Amazon S3) environments.

Federated queries help incorporate live data as part of your MicroStrategy reporting and analysis, without the need to connect to multiple relational data sources from MicroStrategy.

You can also use federated queries to MySQL.

This simplifies the multi-source reports use case by having the ability to run queries on both operational and analytical data sources, without the need to explicitly connect and import data from different data sources within MicroStrategy.

Redshift Spectrum

The MicroStrategy Amazon Redshift connector includes support for Redshift Spectrum, so you can connect directly to query data in Amazon Redshift and analyze it in conjunction with data in Amazon S3.

With Redshift Spectrum, you can efficiently query and retrieve structured and semi-structured data (such as PARQUET, JSON, and CSV) from files in Amazon S3 without having to load the data into Amazon Redshift tables. It allows customers with large datasets stored in Amazon S3 to query that data from within the Amazon Redshift cluster using Amazon Redshift SQL queries with no data movement—you pay only for the data you scanned. Redshift Spectrum also allows multiple Amazon Redshift clusters to concurrently query the same dataset in Amazon S3 without the need to make copies of the data for each cluster. Based on the demands of the queries, Redshift Spectrum can intelligently scale out to take advantage of massively parallel processing.

Use cases that might benefit from using Redshift Spectrum include:

  • A large volume of less-frequently accessed data
  • Heavy scan-intensive and aggregation-intensive queries
  • Selective queries that can use partition pruning and predicate pushdown, so the output is fairly small

Redshift Spectrum gives you the freedom to store your data where you want, in the format you want, and have it available for processing when you need it.

With Redshift Spectrum, you take advantage of a fast, cost-effective engine that minimizes data processed with dynamic partition pruning. You can further improve query performance by reducing the amount of data scanned. You could do this by partitioning and compressing data and by using a columnar format for storage.

For more details on how to optimize Redshift Spectrum query performance and cost, see Best Practices for Amazon Redshift Spectrum.

Optimize MicroStrategy

In this section, we discuss ways to optimize MicroStrategy.

SQL optimizations

With MicroStrategy 2021, MicroStrategy has delivered support for 70 new advanced customizable functions to enhance usability and capability, especially when compared to previously existing Apply functions. Application architects can customize the functions and make them ready and available for regular users like business analysts to use! For more information on how to use these new customizable functions, visit the MicroStrategy community site.

SQL Global Optimization

This setting can substantially reduce the number of SQL passes generated by MicroStrategy. In MicroStrategy, SQL Global Optimization reduces the total number of SQL passes with the following optimizations:

  • Eliminates unused SQL passes – For example, a temp table is created but not referenced in a later pass
  • Reuses redundant SQL passes – For example, the exact same temp table is created multiple times when a single temp table is created
  • Combines SQL passes where the SELECT list is different – For example, two temp tables that have the same FROM clause, joins, WHERE clause, and GROUP BY SELECT lists are combined into single SELECT statement
  • Combines SQL passes where the WHERE clause is different – For example, two temp tables that have same the SELECT list, FROM clause, joins, and GROUP BY predicates from the WHERE clause are moved into CASE statements in the SELECT list

The default setting for Amazon Redshift is to enable SQL Global Optimization at its highest level. If your database instance is configured as an earlier version of Amazon Redshift, you may have to enable this setting manually. For more information, see the MicroStrategy System Administration Guide.

Set Operator Optimization

This setting is used to combine multiple subqueries into a single subquery using set operators (such as UNION, INTERSECT, and EXCEPT). The default setting for Amazon Redshift is to enable Set Operator Optimization.

SQL query generation

The MicroStrategy query engine is able to combine multiple passes of SQL that access the same table (typically the main fact table). This can improve performance by eliminating multiple table scans of large tables. For example, this feature significantly reduces the number of SQL passes required to process datasets with custom groups.

Technically, the WHERE clauses of different passes are resolved in CASE statements of a single SELECT clause, which doesn’t contain qualifications in the WHERE clause. Generally, this elimination of WHERE clauses causes a full table scan on a large table.

In some cases (on a report-by-report basis), this approach can be slower than many highly qualified SELECT statements. Because any performance difference between approaches is mostly impacted by the reporting requirement and implementation in the MicroStrategy application, it’s necessary to test both options for each dataset to identify the optimal case.

The default behavior is to merge all passes with different WHERE clauses (level 4). We recommend testing any option for this setting, but most commonly the biggest performance improvements (if any) are observed by switching to the option Level 2: Merge Passes with Different SELECT.

VLDB Category VLDB Property Setting Value
Query Optimizations SQL Global Optimization Level 2: Merge Passes with Different SELECT

SQL size

As we explained earlier, MicroStrategy tries to submit a single query statement containing the analytics of multiple passes in the derived table syntax. This can lead to sizeable SQL query syntax. It’s possible for such a statement to exceed the capabilities of the driver or database. For this reason, MicroStrategy governs the size of generated queries and throws an error message if this is exceeded. Starting with MicroStrategy 10.9, this value is tuned to current Amazon Redshift capabilities (16 MB). Earlier versions specify a smaller limit that can be modified using the following VLDB setting on the Amazon Redshift DB instance in Developer.

VLDB Category VLDB Property Setting Value
Governing SQL Size/MDX Size 16777216

Subquery type

There are many cases in which the SQL engine generates subqueries (query blocks in the WHERE clause):

  • Reports that use relationship filters
  • Reports that use NOT IN set qualification, such as AND NOT
  • Reports that use attribute qualification with M-M relationships; for example, showing revenue by category and filtering on catalog
  • Reports that raise the level of a filter; for example, dimensional metric at Region level, but qualify on store
  • Reports that use non-aggregatable metrics, such as inventory metrics
  • Reports that use dimensional extensions
  • Reports that use attribute-to-attribute comparison in the filter

The default setting for subquery type for Amazon Redshift is Where EXISTS(select (col1, col2…)):

create table T00001 (
       year_id NUMERIC(10, 0),
       W000001 DOUBLE PRECISION)
 DISTSTYLE EVEN
 
insert into ZZMD00DistKey(1)
select a12.year_id  year_id,
       sum(a11.tot_sls_dlr)  W000001
from   items2 a11
       join   dates    a12
         on   (a11.cur_trn_dt = a12.cur_trn_dt)
where ((exists (select      r11.store_nbr
       from   items r11
       where r11.class_nbr = 1
        and   r11.store_nbr = a11.store_nbr))
 and a12.year_id>1993)
group by      a12.year_id

Some reports may perform better with the option of using a temporary table and falling back to IN for a correlated subquery. Reports that include a filter with an AND NOT set qualification (such as AND NOT relationship filter) will likely benefit from using temp tables to resolve the subquery. However, such reports will probably benefit more from using the Set Operator Optimization option discussed earlier. The other settings are not likely to be advantageous with Amazon Redshift.

VLDB Category VLDB Property Setting Value
Query Optimizations Subquery Type Use temporary table, falling back to IN for correlated subquery

Full outer join support

Full outer join support is enabled in the Amazon Redshift object by default. Levels at which you can set this are database instance, report, and template.

For example, the following query shows the use of full outer join with the states_dates and regions tables:

select pa0.region_id W000000,
       pa2.month_id W000001,
       sum(pa1.tot_dollar_sales) Column1
from   states_dates pa1
       full outer join       regions     pa0
         on (pa1.region_id = pa0.region_id)
       cross join    LU_MONTH      pa2
group by      pa0.region_id, pa2.month_id

DISTINCT or GROUP BY option (for no aggregation and no table key)

If no aggregation is needed and the attribute defined on the table isn’t a primary key, this property tells the SQL engine whether to use SELECT DISTINCT, GROUP BY, or neither.

Possible values for this setting include:

  • Use DISTINCT
  • No DISTINCT, no GROUP BY
  • Use GROUP BY

The DISTINCT or GROUP BY option property controls the generation of DISTINCT or GROUP BY in the SELECT SQL statement. The SQL engine doesn’t consider this property if it can make the decision based on its own knowledge. Specifically, the SQL engine ignores this property in the following situations:

  • If there is aggregation, the SQL engine uses GROUP BY, not DISTINCT
  • If there is no attribute (only metrics), the SQL engine doesn’t use DISTINCT
  • If there is COUNT (DISTINCT …) and the database doesn’t support it, the SQL engine performs a SELECT DISTINCT pass and then a COUNT(*) pass
  • If for certain selected column data types, the database doesn’t allow DISTINCT or GROUP BY, the SQL engine doesn’t do it
  • If the SELECT level is the same as the table key level and the table’s true key property is selected, the SQL engine doesn’t issue a DISTINCT

When none of the preceding conditions are met, the SQL engine uses the DISTINCT or GROUP BY property.

Use the latest Amazon Redshift drivers

For running MicroStrategy reports using Amazon Redshift, we encourage upgrading when new versions of the Amazon Redshift drivers are available. Running an application on the latest driver provides better performance, bugs recovery, and better security features. To get the latest driver version based on the OS, see Drivers and Connectors.

Conclusion

In this post, we discussed various Amazon Redshift cluster optimizations, data model optimizations, and SQL optimizations within MicroStrategy for optimizing your Amazon Redshift and MicroStrategy deployment.


About the Authors

Ranjan Burman is an Analytics Specialist Solutions Architect at AWS. He specializes in Amazon Redshift and helps customers build scalable analytical solutions. He has more than 13 years of experience in different database and data warehousing technologies. He is passionate about automating and solving customer problems with the use of cloud solutions.

Nita Shah is a Analytics Specialist Solutions Architect at AWS based out of New York. She has been building data warehouse solutions for over 20 years and specializes in Amazon Redshift. She is focused on helping customers design and build enterprise-scale well-architected analytics and decision support platforms.

Bosco Albuquerque is a Sr Partner Solutions Architect at AWS and has over 20 years of experience working with database and analytics products from enterprise database vendors and cloud providers, and has helped large technology companies design data analytics solutions as well as led engineering teams in designing and implementing data analytics platforms and data products.

Amit Nayak is responsible for driving the Gateways roadmap at MicroStrategy, focusing on relational and big data databases, as well as authentication. Amit joined MicroStrategy after completing his master’s in Business Analytics at George Washington University and has maintained an oversight of the company’s gateways portfolio for the 3+ years he has been with the company.

New – AWS Marketplace for Containers Anywhere to Deploy Your Kubernetes Cluster in Any Environment

Post Syndicated from Channy Yun original https://aws.amazon.com/blogs/aws/new-aws-marketplace-for-containers-anywhere-to-deploy-your-kubernetes-cluster-in-any-environment/

More than 300,000 customers use AWS Marketplace today to find, subscribe to, and deploy third-party software packaged as Amazon Machine Images (AMIs), software-as-a-service (SaaS), and containers. Customers can find and subscribe containerized third-party applications from AWS Marketplace and deploy them in Amazon Elastic Container Service (Amazon ECS) and Amazon Elastic Kubernetes Service (Amazon EKS).

Many customers that run Kubernetes applications on AWS want to deploy them on-premises due to constraints, such as latency and data governance requirements. Also, once they have deployed the Kubernetes application, they need additional tools to govern the application through license tracking, billing, and upgrades.

Today, we announce AWS Marketplace for Containers Anywhere, a set of capabilities that allows AWS customers to find, subscribe to, and deploy third-party Kubernetes applications from AWS Marketplace on any Kubernetes cluster in any environment. This capability makes the AWS Marketplace more useful for customers who run containerized workloads.

With this launch, you can deploy third party Kubernetes applications to on-premises environments using Amazon EKS Anywhere or any customer self-managed Kubernetes cluster in on-premises environments or in Amazon Elastic Compute Cloud (Amazon EC2), enabling you to use a single catalog to find container images regardless of where they eventually plan to deploy.

With AWS Marketplace for Containers Anywhere, you can get the same benefits as any other products in AWS Marketplace, including consolidated billing, flexible payment options, and lower pricing for long-term contracts. You can find vetted, security-scanned, third-party Kubernetes applications, manage upgrades with a few clicks, and track all licenses and bills. You can migrate applications between any environment without purchasing duplicate licenses. After you have subscribed to an application using this feature, you can migrate your Kubernetes applications to AWS by deploying the independent software vendor (ISV) provided Helm charts onto their Kubernetes clusters on AWS without changing their licenses.

Getting Started with AWS Marketplace for Containers Anywhere
You can get started by visiting AWS Marketplace. Easily search in Delivery methods in all products, then filter Helm Chart in the catalog to find Kubernetes-based applications that they can deploy on AWS and on premises.

If you chose to subscribe to your favorite product, you would select Continue to Subscribe.

Once you accept the seller’s end user license agreement (EULA), select Create Contract and Continue to Configuration.

You can configure the software deployment using the dropdowns. Once Fulfillment option and Software Version are selected, choose Continue to Launch.

To deploy on Amazon EKS, you have the option to deploy the application on a new EKS cluster or copy and paste commands into existing clusters. You can also deploy into self-managed Kubernetes in EC2 by clicking on the self-managed Kubernetes option in the supported services.

To deploy on-premises or in EC2, you can select EKS Anywhere and then take an additional step to request a license token on the AWS Marketplace launch page. You will then use commands provided by AWS Marketplace to download container images, Helm charts from the AWS Marketplace Elastic Container Registry (ECR), the service account creation, and the token to apply IAM Roles for Service Accounts on your EKS cluster.

To upgrade or renew your existing software licenses, you can go to the AWS Marketplace website for a self-service upgrade or renewal experience. You can also negotiate a private offer directly with ISVs to upgrade and renew the application. After you subscribe to the new offer, the license is automatically updated in AWS License Manager. You can view all the licenses you have purchased from AWS Marketplace using AWS License Manager, including the application capabilities you’re entitled to and the expiration date.

Launch Partners of AWS Marketplace for Containers Anywhere
Here is the list of our launch partners to support an on-premises deployment option. Try them out today!

  • D2iQ delivers the leading independent platform for enterprise-grade Kubernetes implementations at scale and across environments, including cloud, hybrid, edge, and air-gapped.
  • HAProxy Technologies offers widely used software load balancers to deliver websites and applications with the utmost performance, observability, and security at any scale and in any environment.
  • Isovalent builds open-source software and enterprise solutions such as Cilium and eBPF solving networking, security, and observability needs for modern cloud-native infrastructure.
  • JFrog‘s “liquid software” mission is to power the world’s software updates through the seamless, secure flow of binaries from developers to the edge.
  • Kasten by Veeam provides Kasten K10, a data management platform purpose-built for Kubernetes, an easy-to-use, scalable, and secure system for backup and recovery, disaster recovery, and application mobility.
  • Nirmata, the creator of Kyverno, provides open source and enterprise solutions for policy-based security and automation of production Kubernetes workloads and clusters.
  • Palo Alto Networks, the global cybersecurity leader, is shaping the cloud-centric future with technology that is transforming the way people and organizations operate.
  • Prosimo‘s SaaS combines cloud networking, performance, security, AI powered observability and cost management to reduce enterprise cloud deployment complexity and risk.
  • Solodev is an enterprise CMS and digital ecosystem for building custom cloud apps, from content to crypto. Get access to DevOps, training, and 24/7 support—powered by AWS.
  • Trilio, a leader in cloud-native data protection for Kubernetes, OpenStack, and Red Hat Virtualization environments, offers solutions for backup and recovery, migration, and application mobility.

If you are interested in offering your Kubernetes application on AWS Marketplace, register and modify your product to integrate with AWS License Manager APIs using the provided AWS SDK. Integrating with AWS License Manager will allow the application to check licenses procured through AWS Marketplace.

Next, you would create a new container product on AWS Marketplace with a contract offer by submitting details of the listing, including the product information, license options, and pricing. The details would be reviewed, approved, and published by AWS Marketplace Technical Account Managers. You would then submit the new container image to AWS Marketplace ECR and add it to a newly created container product through the self-service Marketplace Management Portal. All container images are scanned for Common Vulnerabilities and Exposures (CVEs).

Finally, the product listing and container images would be published and accessible by customers on AWS Marketplace’s customer website. To learn more details about creating container products on AWS Marketplace, visit Getting started as a seller and Container-based products in the AWS documentation.

Available Now
The feature of AWS Marketplace for Containers Anywhere is available now in all Regions that support AWS Marketplace. You can start using the feature directly from the product of launch partners.

Give it a try, and please send us feedback either in the AWS forum for AWS Marketplace or through your usual AWS support contacts.

Channy

IBM Hackathon Produces Innovative Sustainability Solutions on AWS

Post Syndicated from Dhana Vadivelan original https://aws.amazon.com/blogs/architecture/ibm-hackathon-produces-innovative-sustainability-solutions-on-aws/

This post was co-authored by Dhana Vadivelan, Senior Manager, Solutions Architecture, AWS; Markus Graulich, Chief Architect AI EMEA, IBM Consulting; and Vlad Zamfirescu, Senior Solutions Architect, IBM Consulting

Our consulting partner, IBM, organized the “Sustainability Applied 2021” hackathon in September 2021. This three-day event aimed to generate new ideas, create reference architecture patterns using AWS Cloud services, and produce sustainable solutions.

This post highlights four reference architectures that were developed during the hackathon. These architectures show you how IBM hack teams used AWS services to resolve real-world sustainability challenges. We hope these architectures inspire you to help address other sustainability challenges with your own solutions.

IBM sustainability hackathon

Any sustainability research requires acquiring and analyzing large sustainability datasets, such as weather, climate, water, agriculture, and satellite imagery. This requires large storage capacity and often takes a considerable amount of time to complete.

The Amazon Sustainability Data Initiative (ASDI) provides innovators and researchers with sustainability datasets and tools to develop solutions. These datasets are publicly available to anyone on the Registry of Open Data on AWS.

In the hackathon, IBM hack teams used these sample datasets and open APIs from The Weather Company (an IBM business) to develop solutions for sustainability challenges.

Architecture 1: Biocapacity digital twin solution

The hack team “Biohackers” addressed biocapacity, which refers to a biologically productive area’s (cropland, forest, and fishing grounds) ability to generate renewable resources and to absorb its spillover waste. Countries consume 1.7 global hectares per person of Earth’s total biocapacity; this means we consume more resources than are available on this planet.

To help solve this problem, the team created a digital twin architecture (Figure 1) to virtually represent biocapacity information in various conditions:

Biocapacity digital twin solution on AWS

Figure 1. Biocapacity digital twin solution on AWS

This solution provides precise information on current biocapacity and predicts the future biocapacity status at country, region, and city levels. The Biohackers aim to help governments, businesses, and individuals identify options to improve the supply of available renewable resources and increase awareness of the supply and demand.

Architecture 2: Local emergency communication system

Team “Sustainable Force 99,” worked to better understand natural disasters, which have tripled over recent years. Their solution aims to predict natural disasters by analyzing the geographical spread of contributing factors like extreme weather due to climate change, wildfires, and deforestation. Then it communicates clear instructions to people who are potentially in danger.

Their solution (Figure 2) uses the Amazon SageMaker AI prediction model and combines The Weather Company data with Amazon S3, Amazon DynamoDB, and Serverless on AWS technologies and communicates with the public by:

  • Providing voice and chat communication channels using Amazon Connect, Amazon Lex, and Amazon Pinpoint.
  • Broadcasting alerts across smartphones and speakers in towns to provide information to people about upcoming natural disasters.
  • Allowing individuals to notify emergency services of their circumstances.
Local emergency communication system

Figure 2. Local emergency communication system

This communication helps governments and local authorities identify and communicate safe relocation options during disasters and connect with nearby relocation assistance teams.

Architecture 3: Intelligent satellite image processing

Team “Green Fire” examined how to reduce environmental problems caused by wildfires.

Many forest service organizations already use predictive tools to provide intelligence to fire services authorities using satellite imaging. The satellites can detect and capture images of wildfires. However, it can take hours to process these images and transmit and analyze the information, which can mean the subsequent coordination and mobilization of emergency services can be challenging.

To help improve fire rescue and other emergency services coordination and real-time situational awareness, Green Fire created a serverless application architecture (Figure 3):

  • The drone images, external data feeds from AWS Open Data Registry, and the datasets from The Weather Company are stored in Amazon S3 for processing.
  • AWS Lambda processes the images and resizes the data, and the outputs are stored in DynamoDB.
  • Rekognition labels the drone images that identify geographical risks and fire hazards. This allows emergency services to identify potential risks, and they can further model the potential spread of the wildfire and identify options to suppress it.
  • Lambda integrates the API layer between the web user interface and DynamoDB so users can access the application from a web browser/mobile device (mobile application developed using AWS Amplify). Amazon Cognito authenticates users and controls user access.
Intelligent image processing

Figure 3. Intelligent image processing

The team expects this solution to help prevent loss of human lives, save approximately 10% of yearly spend, and reduce CO2 emissions globally between 1.75 to 13.5 billion metric tons of carbon.

Architecture 4: Machine-learning-based solution to predict bee colonies at risk

Variations in vegetation, rising temperatures, and use of pesticide are significantly destroying habitats and creating inhospitable conditions for many species of bees. Over the last decade, beehives in the US and Europe have suffered hive losses of at least 30%.

To encourage the adoption of sustainable agriculture, it is important to safeguard bee colonies. The “I BEE GREEN” team developed a device that contains sensors that monitor beehive health, such as temperature, humidity, air pollutants, beehive acoustic signals, and the number of bees:

  • AWS IoT Core for LoRaWAN connects wireless sensor devices that use the LoRaWAN protocol for low-power, long-range comprehensive area network connectivity.
  • The sensor and weather data (from AWS Open Data Registry/The Weather Company) are loaded in Amazon S3 and transformed using AWS Glue.
  • Once the data is processed and ready to be consumed, it is stored on the AWS S3 bucket.
  • SageMaker consumes this data and generates forecasts such as estimated bee population and mortality rates, probability of infectious diseases and their spread, and the effect of the environment on beehive health.
  • The forecasts are presented in a dashboard using AWS QuickSight and are based on historical data, current data, and trends.

The information this solution generates can be used for several use cases, including:

  • Offering agricultural organizations information on how climate change impacts bee colonies and influences their business performance
  • Contributing to beekeepers’ understanding of the best environment to safeguard bee biodiversity and when to pollinate crops
  • Educating farmers on sustainable methods of agriculture that reduces threat to bees

The I BEE GREEN device automatically counts when bees are entering or exiting the hive. Using this, farmers can assess a hive’s acoustic signal, temperature, humidity, the presence of pollutants, classify them as normal or abnormal, and forecast the potential risk of abnormal mortality. The I BEE GREEN team aims for their device to deploy quickly, with minimal instructions anyone can implement.

Machine-learning-based architecture to predict bee colonies at risk

Figure 4. Machine-learning-based architecture to predict bee colonies at risk

Conclusion

In this blog post, we showed you how IBM hackathon teams used AWS technologies to solve sustainability-related challenges.

Ready to make your own? Visit our sustainability page to learn more about AWS services and features that encourage innovation to solve real-world sustainability challenges. Read more sustainability use cases on the AWS Public Sector Blog.

AWS IQ expansion: Connect with Experts and Consulting Firms based in the UK and France

Post Syndicated from Alex Casalboni original https://aws.amazon.com/blogs/aws/aws-iq-expansion-experts-uk-france/

AWS IQ launched in 2019 and has been helping customers worldwide engage thousands of AWS Certified third-party experts and consulting firms for on-demand project work. Whether you need to learn about AWS, plan your project, setup new services, migrate existing applications, or optimize your spend, AWS IQ connects you with experts and consulting firms who can help. You can share your project objectives with a description, receive responses within the AWS IQ application, approve permissions and budget, and will be charged directly through AWS billing.

Until yesterday, experts had to reside in the United States to offer their hands-on help on AWS IQ. Today, I’m happy to announce that AWS Certified experts and consulting firms based in the UK and France can participate in AWS IQ.

If you are an AWS customer based in the UK or France and need to connect with local AWS experts, now you can reach out to a wider pool of experts and consulting firms during European business hours. When creating a new project, you can now indicate a preferred expert location.

As an AWS Certified expert you can now view the buyer’s preferred expert location to ensure the right fit. AWS IQ simplifies finding relevant opportunities and it helps you access a customer’s AWS environment securely. It also takes care of billing so more time is spent on solving customer problems, instead of administrative tasks. Your payments will be disbursed by AWS Marketplace in USD towards a US bank account. If you don’t already have a US bank account, you may be able to obtain one through third-party services such as Hyperwallet.

AWS IQ User Interface Update
When you create a new project request, you can select a Preferred expert or firm location: Anywhere, France, UK, or US.

Check out Jeff Barr’s launch article to learn more about the full request creation process.

You can also work on the same project with multiple experts from different locations.

When browsing experts and firms, you will find their location under the company name and reviews.

Available Today
AWS IQ is available for customers anywhere in the world (except China) for all sorts of project work, delivered by AWS experts in the United States, the United Kingdom, and France. Get started by creating your project request on iq.aws.amazon.com. Here you can discover featured experts or browse experts for a specific service such as Amazon Elastic Compute Cloud (EC2) or DynamoDB.

If you’re interested in getting started as an expert, check out AWS IQ for Experts. Your profile will showcase your AWS Certifications as well as the ratings and reviews from completed projects.

I’m excited about the expansion of AWS IQ for experts based in the UK and France, and I’m looking forward to further expansions in the future.

Alex

Multi-Cloud and Hybrid Threat Protection with Sumo Logic Cloud SIEM Powered by AWS

Post Syndicated from Danilo Poccia original https://aws.amazon.com/blogs/aws/hybrid-threat-protection-with-sumo-logic-cloud-siem-powered-by-aws/

IT security teams need to have a real-time understanding of what’s happening with their infrastructure and applications. They need to be able to find and correlate data in this continuous flood of information to identify unexpected behaviors or patterns that can lead to a security breach.

To simplify and automate this process, many solutions have been implemented over the years. For example:

  • Security information management (SIM) systems collect data such as log files into a central repository for analysis.
  • Security event management (SEM) platforms simplify data inspection and the interpretation of logs or events.

Many years ago these two approaches were merged to address both information analysis and interpretation of events. These security information and event management (SIEM) platforms provide real-time analysis of security alerts generated by applications, network hardware, and domain specific security tools such as firewalls and endpoint protection tools).

Today, I’d like to introduce a solution created by one of our partners: Sumo Logic Cloud SIEM powered by AWS. Sumo Logic Cloud SIEM provides deep security analytics and contextualized threat data across multi-cloud and hybrid environments to reduce the time to detect and respond to threats. You can use this solution to quickly detect and respond to the higher-priority issues, including malicious activities that negatively impact your business or brand. The solution comes with more than 300 out-of-the-box integrations, including key AWS services, and can help reduce time and effort required to conduct compliance audits for regulations such as PCI and HIPAA.

Sumo Logic Cloud SIEM is available in AWS Marketplace and you can use a free trial to evaluate the solution. Before having a look at how this works in practice, let’s see how it’s being used.

Customer Case Study – Medidata
I had the chance to meet a very interesting customer to talk about how they use Sumo Logic Cloud SIEM. Scott Sumner is the VP and CISO at Medidata, a company that is redefining what’s possible in clinical trials. Medidata is processing patient data for clinical trials of the Moderna and Johnson & Johnson COVID-19 vaccines, so you can see why security is a priority for them. With such critical workloads, the company must keep the trust of the people participating in those trials.

Scott told me, “There is an old saying: If you can’t measure it, you can’t manage it.” In fact, when he joined Medidata in 2015, one of the first things Scott did was to implement a SIEM. Medidata has been using Sumo Logic for more than five years now. They appreciate that it’s a cloud-native solution, and that has made it easier for them to follow the evolution of the tool over the years.

“Not having transparency in the environment you process data is not good for security professionals.” Scott wanted his team to be able to respond quickly and, to do so, they needed to be able to look at a single screen that displays all IP calls, network flows, and any relevant information. For example, Medidata has very aggressive checks for security scans and any kind of external access. To do so, they have to look not just at the perimeter, but at the entire environment. Sumo Logic Cloud SIEM allows them to react without breaking anything in their corporate environment, including the resources they have in more than 45 AWS accounts.

“One of the metrics that is floated around by security specialists is that you have up to five hours to respond to a tentative intrusion,” Scott says. “With Sumo Logic Cloud SIEM, we can match that time aggressively, and most of the times we respond within five minutes.” The ability to respond quickly allows Medidata to keep patient trust. This is very important for them, because delaying a clinical trial can affect people’s health.

Medidata security response is managed by a global team through three levels. Level 1 is covered by a partner who is empowered to block simple attacks. For the next level of escalation, Level 2, Medidata has a team in each region. Beyond that there is Level 3: a hardcore team of forensics examiners distributed across the US, Europe, and Asia who deal with more complicated attacks.

Availability is also important to Medidata. In addition to providing the Cloud SIEM functionality, Sumo Logic helps them monitor availability issues, such as web server failover, and very quickly figure out possible problems as they happen. Interestingly, they use Sumo Logic to better understand how applications talk with each other. These different use cases don’t complicate their setup because the security and application teams are segregated and use Sumo Logic as a single platform to share information seamlessly between the two teams when needed.

I asked Scott Sumner if Medidata was affected by the move to remote work in 2020 due to the COVID-19 pandemic. It’s an important topic for them because at that time Medidata was already involved in clinical trials to fight the pandemic. “We were a mobile environment anyway. A significant part of the company was mobile before. So, we were ready and not being impacted much by working remotely. All our tools are remote, and that helped a lot. Not sure we’d done it easily with an on-premises solution.”

Now, let’s see how this solution works in practice.

Setting Up Sumo Logic Cloud SIEM
In AWS Marketplace I search for “Sumo Logic Cloud SIEM” and look at the product page. I can either subscribe or start the one-month free trial. The free trial includes 1GB of log ingest for security and observability. There is no automatic conversion to paid offer when the free trials expires. After the free trial I have the option to either buy Sumo Logic Cloud SIEM from AWS Marketplace or remain as a free user. I create and accept the contract and set up my Sumo Logic account.

Console screenshot.

In the setup, I choose the Sumo Logic deployment region to use. The Sumo Logic documentation provides a table that describes the AWS Regions used by each Sumo Logic deployment. I need this information later when I set up the integration between AWS security services and Sumo Logic Cloud SIEM. For now, I select US2, which corresponds to the US West (Oregon) Region in AWS.

When my Sumo Logic account is ready, I use the Sumo Logic Security Integrations on AWS Quick Start to deploy the required integrations in my AWS account. You’ll find the source files used by this Quick Start in this GitHub repository. I open the deployment guide and follow along.

This architecture diagram shows the environment deployed by this Quick Start:

Architectural diagram.

Following the steps in the deployment guide, I create an access key and access ID in my Sumo Logic account, and write down my organization ID. Then, I launch the Quick Start to deploy the integrations.

The Quick Start uses an AWS CloudFormation template to create a stack. First, I check that I am in the right AWS Region. I use US West (Oregon) because I am using US2 with Sumo Logic. Then, I leave all default values and choose Next. In the parameters, I select US2 as my Sumo Logic deployment region and enter my Sumo Logic access ID, access key, and organization ID.

Console screenshot.

After that, I enable and configure the integrations with AWS security services and tools such as AWS CloudTrail, Amazon GuardDuty, VPC Flow Logs, and AWS Config.

Console screenshot.

If you have a delegate administrator with GuardDuty, you can enabled multiple member accounts as long as they are a part of the same AWS organization. With that, all findings from member accounts are vended to the delegate administrator and then to Sumo Logic Cloud SIEM through the GuardDuty events processor.

In the next step, I leave the stack options to their default values. I review the configuration and acknowledge the additional capabilities required by this stack (such as the creation of IAM resources) and then choose Create stack.

When the stack creation is complete, the integration with Sumo Logic Cloud SIEM is ready. If I had a hybrid architecture, I could connect those resources for a single point of view and analysis of my security events.

Using Sumo Logic Cloud SIEM
To see how the integration with AWS security services works, and how security events are handled by the SIEM, I use the amazon-guardduty-tester open-source scripts to generate security findings.

First, I use the included CloudFormation template to launch an Amazon Elastic Compute Cloud (Amazon EC2) instance in an Amazon Virtual Private Cloud (VPC) private subnet. The stack also includes a bastion host to provide external access. When the stack has been created, I write down the IP addresses of the two instances from the stack output.

Console screenshot.

Then, I use SSH to connect to the EC2 instance in the private subnet through the bastion host. There are easy-to-follow instructions in the README file. I use the guardduty_tester.sh script, installed in the instance by CloudFormation, to generate security findings for my AWS account.

$ ./guardduty_tester.sh

SSH screenshot.

GuardDuty processes these findings and the events are sent to Sumo Logic through the integration I just set up. In the Sumo Logic GuardDuty dashboard, I see the threats ready to be analyzed and addressed.

Console screenshot.

Availability and Pricing
Sumo Logic Cloud SIEM powered by AWS is a multi-tenant Software as a Service (SaaS) available in AWS Marketplace that ingests data over HTTPS/TLS 1.2 on the public internet. You can connect data from any AWS Region and from multi-cloud and hybrid architectures for a single point of view of your security events.

Start a free trial of Sumo Logic Cloud SIEM and see how it can help your security team.

Read the Sumo Logic team’s blog post here for more information on the service. 

Danilo

Field Notes: Benchmarking Performance of the New M5zn, D3, and R5b Instance Types with Datadog

Post Syndicated from Ray Zaman original https://aws.amazon.com/blogs/architecture/field-notes-benchmarking-performance-of-the-new-m5zn-d3-and-r5b-instance-types-with-datadog/

This post was co-written with Danton Rodriguez, Product Manager at Datadog. 

At re:Invent 2020, AWS announced the new Amazon Elastic Compute Cloud (Amazon EC2) M5zn, D3, and R5b instance types. These instances are built on top of the AWS Nitro System, a collection of AWS-designed hardware and software innovations that enable the delivery of private networking, and efficient, flexible, and secure cloud services with isolated multi-tenancy.

If you’re thinking about deploying your workloads to any of these new instances, Datadog helps you monitor your deployment and gain insight into your entire AWS infrastructure. The Datadog Agent—open-source software available on GitHub—collects metrics, distributed traces, logs, profiles, and more from Amazon EC2 instances and the rest of your infrastructure.

How to deploy Datadog to analyze performance data

The Datadog Agent is compatible with the new instance types. You can use a configuration management tool such as AWS CloudFormation to deploy it automatically across all your instances. You can also deploy it with a single command directly to any Amazon EC2 instance. For example, you can use the following command to deploy the Agent to an instance running Amazon Linux 2:

DD_AGENT_MAJOR_VERSION=7 DD_API_KEY=[Your API Key] bash -c "$(curl -L https://raw.githubusercontent.com/DataDog/datadog-agent/master/cmd/agent/install_script.sh)"

The Datadog Agent uses an API key to send monitoring data to Datadog. You can find your API key in the Datadog account settings page. Once you deploy the Agent, you can instantly access system-level metrics and visualize your infrastructure. The Agent automatically tags EC2 metrics with metadata, including Availability Zone and instance type, so you can filter, search, and group data in Datadog. For example, the Host Map helps you visualize how I/O load on d3.2xlarge instances is distributed across Availability Zones and individual instances (as shown in Figure 1 ).

Figure 1 – Visualizing read I/O operations on d3.2xlarge instances across three Availability Zones.

Figure 1 – Visualizing read I/O operations on d3.2xlarge instances across three Availability Zones.

Enabling trace collection for better visibility

Installing the Agent allows you to use Datadog APM to collect traces from the services running on your Amazon EC2 instances, and monitor their performance with Datadog dashboards and alerts.

Datadog APM includes support for auto-instrumenting applications built on a wide range of languages and frameworks, such as Java, Python, Django, and Ruby on Rails. To start collecting traces, you add the relevant Datadog tracing library to your code. For more information on setting up tracing for a specific language, Datadog has language-specific guides to help get you started.

Visualizing M5zn performance in Datadog

The new M5zn instances are a high frequency, high speed and low-latency networking variant of Amazon EC2 M5 instances. M5zn instances deliver the highest all-core turbo CPU performance from Intel Xeon Scalable processors in the cloud, with a frequency up to 4.5 GHz —making them ideal for gaming, simulation modeling, and other high performance computing applications across a broad range of industries.

To demonstrate how to visualize M5zn’s performance improvements in Datadog, we ran a benchmark test for a simple Python application deployed behind Apache servers on two instance types:

  • M5 instance (hellobench-m5-x86_64 service in Figure 2)
  • M5zn instance (hellobench-m5zn-x86_64 service in Figure 2).

Our benchmark application used the aiohttp library and was instrumented with Datadog’s Python tracing library. To run the test, we used Apache’s HTTP server benchmarking tool to generate a constant stream of requests across the two instances.

The hellobench-m5zn-x86_64 service running on the M5zn instance reported a 95th percentile latency that was about 48 percent lower than the value reported by the hellobench-m5-x86_64 service running on the M5 instance (4.73 ms vs. 9.16 ms) over the course of our testing. The summary of results is shown in Datadog APM (as shown in figure 2 below):

Figure 2 – Performance benchmarks for a Python application running on two instance types: M5 and M5zn.

Figure 2 – Performance benchmarks for a Python application running on two instance types: M5 and M5zn.

To analyze this performance data, we visualize the complete distribution of the benchmark response time results in a Datadog dashboard. Viewing the full latency distribution allows us to have a more complete picture when considering selecting the right instance type, so we can better adhere to Service Level Objective (SLO) targets.

Figure 3 shows that the M5zn was able to outperform the M5 across the entire latency distribution, both for the median request and for the long tail end of the distribution. The median request, or 50th percentile, was 36 percent faster (299.65 µs vs. 465.28 µs) while the tail end of the distribution process was 48 percent faster (4.73 ms vs. 9.16 ms) as mentioned in the preceding paragraph.


Screenshot of Latency Distribution : M5

Screenshot of Latency Distribution M5zn

Figure 3 – Using a Datadog dashboard to show how the M5zn instance type performed faster across the entire latency distribution during the benchmark test.

We can also create timeseries graphs of our test results to show that the M5zn was able to sustain faster performance throughout the duration of the test, despite processing a higher number of requests. Figure 4 illustrates the difference by displaying the 95th percentile response time and the request rate of both instances across 30-second intervals.

Figure 4 – The M5zn’s p95 latency was nearly half of the M5’s despite higher throughput during the benchmark test.

Figure 4 – The M5zn’s p95 latency was nearly half of the M5’s despite higher throughput during the benchmark test.

We can dig even deeper with Datadog Continuous Profiler, an always-on production code profiler used to analyze code-level performance across your entire environment, with minimal overhead. Profiles reveal which functions (or lines of code) consume the most resources, such as CPU and memory.

Even though M5zn is already designed to deliver excellent CPU performance, Continuous Profiler can help you optimize your applications to leverage the M5zn high-frequency processor to its maximum potential. As shown in Figure 5, the Continuous Profiler highlights lines of code where CPU utilization is exceptionally high, so you can optimize those methods or threads to make better use of the available compute power.

After you migrate your workloads to M5zn, Continuous Profiler can help you quantify CPU-time improvements on a per-method basis and pinpoint code-level bottlenecks. This also occurs even as you add new features and functionalities to your application.

Figure 5 – Using Datadog Continuous Profiler to identify functions with the most CPU time.

Figure 5 – Using Datadog Continuous Profiler to identify functions with the most CPU time.

Comparing D3, D3en, and D2 performance in Datadog

  • The new D3 and D3en instances leverage 2nd-generation Intel Xeon Scalable Processors (Cascade Lake) and provide a sustained all core frequency up to 3.1 GHz.
  • Compared to D2 instances, D3 instances provide up to 2.5x higher networking speed and 45 percent higher disk throughput.
  • D3en instances provide up to 7.5x higher networking speed, 100 percent higher disk throughput, 7x more storage capacity, and 80 percent lower cost-per-TB of storage.

These instances are ideal for HDD storage workloads, such as distributed/clustered file systems, big data and analytics, and high capacity data lakes. D3en instances are the densest local storage instances in the cloud. For our testing, we deployed the Datadog Agent to three instances: the D2, D3, and D3en. We then used two benchmark applications to gauge performance under demanding workloads.

Our first benchmark test used TestDFSIO, an open-source benchmark test included with Hadoop that is used to analyze the I/O performance of an HDFS cluster.

We ran TestDFSIO with the following command:

hadoop jar $HADOOP_HOME/share/hadoop/mapreduce/hadoop-mapreduce-client-jobclient-*-tests.jar TestDFSIO -write -nrFiles 48 -size 10GB

The Datadog Agent automatically collects system metrics that can help you visualize how the instances performed during the benchmark test. The D3en instance led the field and hit a maximum write speed of 259,000 Kbps.

Figure 6 – Using Datadog to visualize and compare write speed of an HDFS cluster on D2, D3, and D3en instance types during the TestDFSIO benchmark test.

Figure 6 – Using Datadog to visualize and compare write speed of an HDFS cluster on D2, D3, and D3en instance types during the TestDFSIO benchmark test.

The D3en instance completed the TestDFSIO benchmark test 39 percent faster than the D2 (204.55 seconds vs. 336.84 seconds). The D3 instance completed the benchmark test 27 percent faster at 244.62 seconds.

Datadog helps you realize additional benefits of the D3en and D3 instances: notably, they exhibited lower CPU utilization than the D2 during the benchmark (as shown in figure 7).

Figure 7 – Using Datadog to compare CPU usage on D2, D3, and D3en instances during the TestDFSIO benchmark test.

Figure 7 – Using Datadog to compare CPU usage on D2, D3, and D3en instances during the TestDFSIO benchmark test.

For our second benchmark test, we again deployed the Datadog Agent to the same three instances: D2, D3, and D3en. In this test, we used TPC-DS, a high CPU and I/O load test that is designed to simulate real-world database performance.

TPC-DS is a set of tools that generates a set of data that can be loaded into your database of choice, in this case PostgreSQL 12 on Ubuntu 20.04. It then generates a set of SQL statements that are used to exercise the database. For this benchmark, 8 simultaneous threads were used on each instance.

The D3en instance completed the TPC-DS benchmark test 59 percent faster than the D2 (220.31 seconds vs. 542.44 seconds). The D3 instance completed the benchmark test 53 percent faster at 253.78 seconds.

Using the metrics collected from Datadog’s PostgreSQL integration, we learn that the D3en not only finished the test faster, but had lower system load during the benchmark test run. This is further validation of the overall performance improvements you can expect when migrating to the D3en.

Figure 8 – Using Datadog to compare system load on D2, D3, and D3en instances during the TPC-DS benchmark test.

Figure 8 – Using Datadog to compare system load on D2, D3, and D3en instances during the TPC-DS benchmark test.

The performance improvements are also visible when comparing rows returned per second. While all three instances had similar peak burst performance, the D3en and D3 sustained a higher rate of rows returned throughout the duration of the TPC-DS test.

Figure 9 – Using Datadog to compare Rows returned per second on D2, D3, and D3en instances during the TPC-DS benchmark test.

Figure 9 – Using Datadog to compare Rows returned per second on D2, D3, and D3en instances during the TPC-DS benchmark test.

From these results, we learn that not only do the new D3en and D3 instances have faster disk throughput, but they also offer improved CPU performance, which translates into superior performance to power your most critical workloads.

Comparing R5b and R5 performance

The new R5b instances provide 3x higher EBS-optimized performance compared to R5 instances, and are frequently used to power large workloads that rely on Amazon EBS. Customers that operate applications with stringent storage performance requirements can consolidate their existing R5 workloads into fewer or smaller R5b instances to reduce costs.

To compare I/O performance across these two instance types, we installed the FIO benchmark application and the Datadog Agent on an R5 instance and an R5b instance. We then added EBS io1 storage volumes to each with a Provisioned IOPS setting of 25,000.

We ran FIO with a 75 percent read, 25 percent write workload using the following command:

sudo fio --randrepeat=1 --ioengine=libaio --direct=1 --gtod_reduce=1 --name=test --filename=/disk-io1/test --bs=4k --iodepth=64 --size=16G —readwrite=randrw —rwmixread=75

Using the metrics collected from the Datadog Agent, we were able to visualize the benchmark performance results. In approximately one minute, FIO ramped up and reached the maximum I/O operations per second.

The left side of Figure 10 shows the R5b instance reaching the provisioned maximum IOPS of 25,000, while the read operations at 25 percent as expected. The right side shows the R5 reaching its EBS IOPS limit of 18,750, with its relative 25 percent write operations.

It should be noted that R5b instances have far higher performance ceilings than what is being shown here, which you can find in the User Guide: Amazon EBS–optimized instances.

Figure 10 – Comparing IOPS on R5b and R5 instances during the FIO benchmark test.

Figure 10 – Comparing IOPS on R5b and R5 instances during the FIO benchmark test.

Also, note that the R5b finished the benchmark test approximately one minute faster than the R5 (166 seconds vs. 223 seconds). We learn that the shorter test duration is driven by the R5b’s faster read time, which reached a maximum of 75,000 Kbps.

Figure 11 – The R5b instance's faster read time enabled it to complete the benchmark test more quickly than the R5 instance.

Figure 11 – The R5b instance’s faster read time enabled it to complete the benchmark test more quickly than the R5 instance.

From these results, we have learned that the R5b delivers superior I/O capacity with higher throughput, making it a great choice for large relational databases and other IOPS-intensive workloads.

Conclusion

If you are thinking about shifting your workloads to one of the new Amazon EC2 instance types, you can use the Datadog Agent to immediately begin collecting and analyzing performance data. With Datadog’s other AWS integrations, you can monitor even more of your AWS infrastructure and correlate that data with the data collected by the Agent. For example, if you’re running EBS-optimized R5b instances, you can monitor them alongside performance data from your EBS volumes with Datadog’s Amazon EBS integration.

About Datadog

Datadog is an AWS Partner Network (APN) Advanced Technology Partner with AWS Competencies in DevOps, Migration, Containers, and Microsoft Workloads.

Read more about the M5zn, D3en, D3, and R5b instances, and sign up for a free Datadog trial if you don’t already have an account.

Field Notes provides hands-on technical guidance from AWS Solutions Architects, consultants, and technical account managers, based on their experiences in the field solving real-world business problems for customers.


Danton Rodriguez

Danton is a Product Manager at Datadog focused on distributed systems observability and efficiency.

Field Notes: Applying Machine Learning to Vegetation Management using Amazon SageMaker

Post Syndicated from Sameer Goel original https://aws.amazon.com/blogs/architecture/field-notes-applying-machine-learning-to-vegetation-management-using-amazon-sagemaker/

This post was co-written by Soheil Moosavi, a data scientist consultant in Accenture Applied Intelligence (AAI) team, and Louis Lim, a manager in Accenture AWS Business Group. 

Virtually every electric customer in the US and Canada has, at one time or another, experienced a sustained electric outage as a direct result of a tree and power line contact. According to the report from Federal Energy Regulatory Commission (FERC.gov), Electric utility companies actively work to mitigate these threats.

Vegetation Management (VM) programs represent one of the largest recurring maintenance expenses for electric utility companies in North America. Utilities and regulators generally agree that keeping trees and vegetation from conflicting with overhead conductors. It is a critical and expensive responsibility of all utility companies concerned about electric service reliability.

Vegetation management such as tree trimming and removal is essential for electricity providers to reduce unwanted outages and be rated with a low System Average Interruption Duration Index (SAIDI) score. Electricity providers are increasingly interested in identifying innovative practices and technologies to mitigate outages, streamline vegetation management activities, and maintain acceptable SAIDI scores. With the recent democratization of machine learning leveraging the power of cloud, utility companies are identifying unique ways to solve complex business problems on top of AWS. The Accenture AWS Business Group, a strategic collaboration by Accenture and AWS, helps customers accelerate their pace of innovation to deliver disruptive products and services. Learning how to machine learn helps enterprises innovate and disrupt unlocking business value.

In this blog post, you learn how Accenture and AWS collaborated to develop a machine learning solution for an electricity provider using Amazon SageMaker.  The goal was to improve vegetation management and optimize program cost.

Overview of solution 

VM is generally performed on a cyclical basis, prioritizing circuits solely based on the number of outages in the previous years. A more sophisticated approach is to use Light Detection and Ranging (LIDAR) and imagery from aircraft and low earth orbit (LEO) satellites with Machine Learning  models, to determine where VM is needed. This provides the information for precise VM plans, but is more expensive due to cost to acquire the LIDAR and imagery data.

In this blog, we show how a machine learning (ML) solution can prioritize circuits based on the impacts of tree-related outages on the coming year’s SAIDI without using imagery data.

We demonstrate how to implement a solution that cross-references, cleans, and transforms time series data from multiple resources. This then creates features and models that predict the number of outages in the coming year, and sorts and prioritizes circuits based on their impact on the coming year’s SAIDI. We show how you use an interactive dashboard designed to browse circuits and the impact of performing VM on SAIDI reduction based on your budget.

Walkthrough

  • Source data is first transferred into an Amazon Simple Storage Service (Amazon S3) bucket from the client’s data center.
  • Next, AWS Glue Crawlers are used to crawl the data from the  source bucket. Glue Jobs were used to cross-reference data files to create features for modeling and data for the dashboards.
  • We used Jupyter Notebooks on Amazon SageMaker to train and evaluate models. The best performing model was saved as a pickle file on Amazon S3 and Glue was used to add the predicted number of outages for each circuit to the data prepared for the dashboards.
  • Lastly, Operations users were granted access to Amazon QuickSight dashboards, sourced data from Athena, to browse the data and graphs, while VM users were additionally granted access to directly edit the data prepared for dashboards, such as the latest VM cost for each circuit.
  • We used Amazon QuickSight to create interactive dashboards for the VM team members to visualize analytics and predictions. These predictions are a list of circuits prioritized based on their impact on SAIDI in the coming year. The solution allows our team to analyze the data and experiment with different models in a rapid cycle.

Modeling

We were provided with 6 years worth of data across 127 circuits. Data included VM (VM work start and end date, number of trees trimmed and removed, costs), asset (pole count, height, and materials, wire count, length, and materials, and meter count and voltage), terrain (elevation, landcover, flooding frequency, wind erodibility, soil erodibility, slope, soil water absorption, and soil loss tolerance from GIS ESRI layers), and outages (outage coordinated, dates, duration, total customer minutes, total customers affected). In addition, we collected weather data from NOAA and DarkSky datasets, including wind, gust, precipitation, temperature.

Starting with 762 records (6 years * 127 circuits) and 226 features, we performed a series of data cleaning and feature engineering tasks including:

  • Dropped sparse, non-variant, and non-relevant features
  • Capped selected outliers based on features’ distributions and percentiles
  • Normalized imbalanced features
  • Imputed missing values
    • Used “0” where missing value meant zero (for example, number of trees removed)
    • Used 3650 (equivalent to 10 years) where missing values are days for VM work (for example, days since previous tree trimming job)
    • Used average of values for each circuit when applicable, and average of values across all circuits for circuits with no existing values (for example, pole mean height)
  • Merged conceptually relevant features
  • Created new features such as ratios (for example, tree trim cost per trim) and combinations(for example, % of land cover for low and medium intensity areas combined)

After further dropping highly correlated features to remove multi-collinearity for our models, we were left with 72 features for model development. The following diagram shows a high-level overview data partitioning and number of outages prediction.

Our best performing model out of Gradient Boosting Trees, Random Forest, and Feed Forward Neural Networks was Elastic Net, with Mean Absolute Error of 6.02 when using a combination of only 10 features. Elastic Net is appropriate for smaller sample for this dataset, good at feature selection, likely to generalize on a new dataset, and consistently showed a lower error rate. Exponential expansion of features showed small improvements in predictions, but we kept the non-expanded version due to better interpretability.

When analyzing the model performance, predictions were more accurate for circuits with lower outage count, and models suffered from under-predicting when the number of outages was high. This is due to having few circuits with a high number of outages for the model to learn from.

The following chart below shows the importance of each feature used in the model. An error of 6.02 means on average we over or under predict six outages for each circuit.

Dashboard

We designed two types of interactive dashboards for the VM team to browse results and predictions. The first set of dashboards show historical or predicted outage counts for each circuit on a geospatial map. Users can further filter circuits based on criteria such as the number of days since VM, as shown in the following screenshot.

The second type of dashboard shows predicted post-VM SAIDI on the y-axis and VM cost on the x-axis. This dashboard is used by the client to determine the reduction in SAIDI based on available VM budget for the year and dispatch the VM crew accordingly. Clients can also upload a list of update VM cost for each circuit, and the graph will automatically readjust.

Conclusion

This solution for Vegetation management demonstrates how we used Amazon SageMaker to train and evaluate machine learning models. Using this solution an Electric Utility can save time and cost, and scale easily to include more circuits within a set VM budget. We demonstrated how a utility can leverage machine learning to predict unwanted outages and also maintain vegetation, without incurring the cost of high-resolution imagery.

Further, to improve these predictions we recommend:

  1. A yearly collection of asset and terrain data (if data is only available for the most recent year, it is impossible for models to learn from each years’ changes),
  2. Collection of VM data per month per location (if current data is collected only at the end of each VM cycle and only per circuit, monthly, and subcircuit modeling is impossible), and
  3. Purchasing LiDAR imagery or tree inventory data to include features such as tree density, height, distance to wires, and more.

Accelerating Innovation with the Accenture AWS Business Group (AABG)

By working with the Accenture AWS Business Group (AABG), you can learn from the resources, technical expertise, and industry knowledge of two leading innovators, helping you accelerate the pace of innovation to deliver disruptive products and services. The AABG helps customers ideate and innovate cloud solutions with customers through rapid prototype development.

Connect with our team at [email protected] to learn and accelerate how to use machine learning in your products and services.


Field Notes provides hands-on technical guidance from AWS Solutions Architects, consultants, and technical account managers, based on their experiences in the field solving real-world business problems for customers.
Soheil

Soheil Moosavi

Soheil Moosavi is a data scientist consultant and part of Accenture Applied Intelligence (AAI) team. He comes with vast experience in Machine Learning and architecting analytical solutions to solve and improve business problems.

Soheil

Soheil Moosavi

Louis Lim is a manager in Accenture AWS Business Group, his team focus on helping enterprises to explore the art of possible through rapid prototyping and cloud-native solution.


Automate thousands of mainframe tests on AWS with the Micro Focus Enterprise Suite

Post Syndicated from Kevin Yung original https://aws.amazon.com/blogs/devops/automate-mainframe-tests-on-aws-with-micro-focus/

Micro Focus – AWS Advanced Technology Parnter, they are a global infrastructure software company with 40 years of experience in delivering and supporting enterprise software.

We have seen mainframe customers often encounter scalability constraints, and they can’t support their development and test workforce to the scale required to support business requirements. These constraints can lead to delays, reduce product or feature releases, and make them unable to respond to market requirements. Furthermore, limits in capacity and scale often affect the quality of changes deployed, and are linked to unplanned or unexpected downtime in products or services.

The conventional approach to address these constraints is to scale up, meaning to increase MIPS/MSU capacity of the mainframe hardware available for development and testing. The cost of this approach, however, is excessively high, and to ensure time to market, you may reject this approach at the expense of quality and functionality. If you’re wrestling with these challenges, this post is written specifically for you.

To accompany this post, we developed an AWS prescriptive guidance (APG) pattern for developer instances and CI/CD pipelines: Mainframe Modernization: DevOps on AWS with Micro Focus.

Overview of solution

In the APG, we introduce DevOps automation and AWS CI/CD architecture to support mainframe application development. Our solution enables you to embrace both Test Driven Development (TDD) and Behavior Driven Development (BDD). Mainframe developers and testers can automate the tests in CI/CD pipelines so they’re repeatable and scalable. To speed up automated mainframe application tests, the solution uses team pipelines to run functional and integration tests frequently, and uses systems test pipelines to run comprehensive regression tests on demand. For more information about the pipelines, see Mainframe Modernization: DevOps on AWS with Micro Focus.

In this post, we focus on how to automate and scale mainframe application tests in AWS. We show you how to use AWS services and Micro Focus products to automate mainframe application tests with best practices. The solution can scale your mainframe application CI/CD pipeline to run thousands of tests in AWS within minutes, and you only pay a fraction of your current on-premises cost.

The following diagram illustrates the solution architecture.

Mainframe DevOps On AWS Architecture Overview, on the left is the conventional mainframe development environment, on the left is the CI/CD pipelines for mainframe tests in AWS

Figure: Mainframe DevOps On AWS Architecture Overview


Best practices

Before we get into the details of the solution, let’s recap the following mainframe application testing best practices:

  • Create a “test first” culture by writing tests for mainframe application code changes
  • Automate preparing and running tests in the CI/CD pipelines
  • Provide fast and quality feedback to project management throughout the SDLC
  • Assess and increase test coverage
  • Scale your test’s capacity and speed in line with your project schedule and requirements

Automated smoke test

In this architecture, mainframe developers can automate running functional smoke tests for new changes. This testing phase typically “smokes out” regression of core and critical business functions. You can achieve these tests using tools such as py3270 with x3270 or Robot Framework Mainframe 3270 Library.

The following code shows a feature test written in Behave and test step using py3270:

# home_loan_calculator.feature
Feature: calculate home loan monthly repayment
  the bankdemo application provides a monthly home loan repayment caculator 
  User need to input into transaction of home loan amount, interest rate and how many years of the loan maturity.
  User will be provided an output of home loan monthly repayment amount

  Scenario Outline: As a customer I want to calculate my monthly home loan repayment via a transaction
      Given home loan amount is <amount>, interest rate is <interest rate> and maturity date is <maturity date in months> months 
       When the transaction is submitted to the home loan calculator
       Then it shall show the monthly repayment of <monthly repayment>

    Examples: Homeloan
      | amount  | interest rate | maturity date in months | monthly repayment |
      | 1000000 | 3.29          | 300                     | $4894.31          |


# home_loan_calculator_steps.py
import sys, os
from py3270 import Emulator
from behave import *

@given("home loan amount is {amount}, interest rate is {rate} and maturity date is {maturity_date} months")
def step_impl(context, amount, rate, maturity_date):
    context.home_loan_amount = amount
    context.interest_rate = rate
    context.maturity_date_in_months = maturity_date

@when("the transaction is submitted to the home loan calculator")
def step_impl(context):
    # Setup connection parameters
    tn3270_host = os.getenv('TN3270_HOST')
    tn3270_port = os.getenv('TN3270_PORT')
	# Setup TN3270 connection
    em = Emulator(visible=False, timeout=120)
    em.connect(tn3270_host + ':' + tn3270_port)
    em.wait_for_field()
	# Screen login
    em.fill_field(10, 44, 'b0001', 5)
    em.send_enter()
	# Input screen fields for home loan calculator
    em.wait_for_field()
    em.fill_field(8, 46, context.home_loan_amount, 7)
    em.fill_field(10, 46, context.interest_rate, 7)
    em.fill_field(12, 46, context.maturity_date_in_months, 7)
    em.send_enter()
    em.wait_for_field()    

    # collect monthly replayment output from screen
    context.monthly_repayment = em.string_get(14, 46, 9)
    em.terminate()

@then("it shall show the monthly repayment of {amount}")
def step_impl(context, amount):
    print("expected amount is " + amount.strip() + ", and the result from screen is " + context.monthly_repayment.strip())
assert amount.strip() == context.monthly_repayment.strip()

To run this functional test in Micro Focus Enterprise Test Server (ETS), we use AWS CodeBuild.

We first need to build an Enterprise Test Server Docker image and push it to an Amazon Elastic Container Registry (Amazon ECR) registry. For instructions, see Using Enterprise Test Server with Docker.

Next, we create a CodeBuild project and uses the Enterprise Test Server Docker image in its configuration.

The following is an example AWS CloudFormation code snippet of a CodeBuild project that uses Windows Container and Enterprise Test Server:

  BddTestBankDemoStage:
    Type: AWS::CodeBuild::Project
    Properties:
      Name: !Sub '${AWS::StackName}BddTestBankDemo'
      LogsConfig:
        CloudWatchLogs:
          Status: ENABLED
      Artifacts:
        Type: CODEPIPELINE
        EncryptionDisabled: true
      Environment:
        ComputeType: BUILD_GENERAL1_LARGE
        Image: !Sub "${EnterpriseTestServerDockerImage}:latest"
        ImagePullCredentialsType: SERVICE_ROLE
        Type: WINDOWS_SERVER_2019_CONTAINER
      ServiceRole: !Ref CodeBuildRole
      Source:
        Type: CODEPIPELINE
        BuildSpec: bdd-test-bankdemo-buildspec.yaml

In the CodeBuild project, we need to create a buildspec to orchestrate the commands for preparing the Micro Focus Enterprise Test Server CICS environment and issue the test command. In the buildspec, we define the location for CodeBuild to look for test reports and upload them into the CodeBuild report group. The following buildspec code uses custom scripts DeployES.ps1 and StartAndWait.ps1 to start your CICS region, and runs Python Behave BDD tests:

version: 0.2
phases:
  build:
    commands:
      - |
        # Run Command to start Enterprise Test Server
        CD C:\
        .\DeployES.ps1
        .\StartAndWait.ps1

        py -m pip install behave

        Write-Host "waiting for server to be ready ..."
        do {
          Write-Host "..."
          sleep 3  
        } until(Test-NetConnection 127.0.0.1 -Port 9270 | ? { $_.TcpTestSucceeded } )

        CD C:\tests\features
        MD C:\tests\reports
        $Env:Path += ";c:\wc3270"

        $address=(Get-NetIPAddress -AddressFamily Ipv4 | where { $_.IPAddress -Match "172\.*" })
        $Env:TN3270_HOST = $address.IPAddress
        $Env:TN3270_PORT = "9270"
        
        behave.exe --color --junit --junit-directory C:\tests\reports
reports:
  bankdemo-bdd-test-report:
    files: 
      - '**/*'
    base-directory: "C:\\tests\\reports"

In the smoke test, the team may run both unit tests and functional tests. Ideally, these tests are better to run in parallel to speed up the pipeline. In AWS CodePipeline, we can set up a stage to run multiple steps in parallel. In our example, the pipeline runs both BDD tests and Robot Framework (RPA) tests.

The following CloudFormation code snippet runs two different tests. You use the same RunOrder value to indicate the actions run in parallel.

#...
        - Name: Tests
          Actions:
            - Name: RunBDDTest
              ActionTypeId:
                Category: Build
                Owner: AWS
                Provider: CodeBuild
                Version: 1
              Configuration:
                ProjectName: !Ref BddTestBankDemoStage
                PrimarySource: Config
              InputArtifacts:
                - Name: DemoBin
                - Name: Config
              RunOrder: 1
            - Name: RunRbTest
              ActionTypeId:
                Category: Build
                Owner: AWS
                Provider: CodeBuild
                Version: 1
              Configuration:
                ProjectName : !Ref RpaTestBankDemoStage
                PrimarySource: Config
              InputArtifacts:
                - Name: DemoBin
                - Name: Config
              RunOrder: 1  
#...

The following screenshot shows the example actions on the CodePipeline console that use the preceding code.

Screenshot of CodePipeine parallel execution tests using a same run order value

Figure – Screenshot of CodePipeine parallel execution tests

Both DBB and RPA tests produce jUnit format reports, which CodeBuild can ingest and show on the CodeBuild console. This is a great way for project management and business users to track the quality trend of an application. The following screenshot shows the CodeBuild report generated from the BDD tests.

CodeBuild report generated from the BDD tests showing 100% pass rate

Figure – CodeBuild report generated from the BDD tests

Automated regression tests

After you test the changes in the project team pipeline, you can automatically promote them to another stream with other team members’ changes for further testing. The scope of this testing stream is significantly more comprehensive, with a greater number and wider range of tests and higher volume of test data. The changes promoted to this stream by each team member are tested in this environment at the end of each day throughout the life of the project. This provides a high-quality delivery to production, with new code and changes to existing code tested together with hundreds or thousands of tests.

In enterprise architecture, it’s commonplace to see an application client consuming web services APIs exposed from a mainframe CICS application. One approach to do regression tests for mainframe applications is to use Micro Focus Verastream Host Integrator (VHI) to record and capture 3270 data stream processing and encapsulate these 3270 data streams as business functions, which in turn are packaged as web services. When these web services are available, they can be consumed by a test automation product, which in our environment is Micro Focus UFT One. This uses the Verastream server as the orchestration engine that translates the web service requests into 3270 data streams that integrate with the mainframe CICS application. The application is deployed in Micro Focus Enterprise Test Server.

The following diagram shows the end-to-end testing components.

Regression Test the end-to-end testing components using ECS Container for Exterprise Test Server, Verastream Host Integrator and UFT One Container, all integration points are using Elastic Network Load Balancer

Figure – Regression Test Infrastructure end-to-end Setup

To ensure we have the coverage required for large mainframe applications, we sometimes need to run thousands of tests against very large production volumes of test data. We want the tests to run faster and complete as soon as possible so we reduce AWS costs—we only pay for the infrastructure when consuming resources for the life of the test environment when provisioning and running tests.

Therefore, the design of the test environment needs to scale out. The batch feature in CodeBuild allows you to run tests in batches and in parallel rather than serially. Furthermore, our solution needs to minimize interference between batches, a failure in one batch doesn’t affect another running in parallel. The following diagram depicts the high-level design, with each batch build running in its own independent infrastructure. Each infrastructure is launched as part of test preparation, and then torn down in the post-test phase.

Regression Tests in CodeBuoild Project setup to use batch mode, three batches running in independent infrastructure with containers

Figure – Regression Tests in CodeBuoild Project setup to use batch mode

Building and deploying regression test components

Following the design of the parallel regression test environment, let’s look at how we build each component and how they are deployed. The followings steps to build our regression tests use a working backward approach, starting from deployment in the Enterprise Test Server:

  1. Create a batch build in CodeBuild.
  2. Deploy to Enterprise Test Server.
  3. Deploy the VHI model.
  4. Deploy UFT One Tests.
  5. Integrate UFT One into CodeBuild and CodePipeline and test the application.

Creating a batch build in CodeBuild

We update two components to enable a batch build. First, in the CodePipeline CloudFormation resource, we set BatchEnabled to be true for the test stage. The UFT One test preparation stage uses the CloudFormation template to create the test infrastructure. The following code is an example of the AWS CloudFormation snippet with batch build enabled:

#...
        - Name: SystemsTest
          Actions:
            - Name: Uft-Tests
              ActionTypeId:
                Category: Build
                Owner: AWS
                Provider: CodeBuild
                Version: 1
              Configuration:
                ProjectName : !Ref UftTestBankDemoProject
                PrimarySource: Config
                BatchEnabled: true
                CombineArtifacts: true
              InputArtifacts:
                - Name: Config
                - Name: DemoSrc
              OutputArtifacts:
                - Name: TestReport                
              RunOrder: 1
#...

Second, in the buildspec configuration of the test stage, we provide a build matrix setting. We use the custom environment variable TEST_BATCH_NUMBER to indicate which set of tests runs in each batch. See the following code:

version: 0.2
batch:
  fast-fail: true
  build-matrix:
    static:
      ignore-failure: false
    dynamic:
      env:
        variables:
          TEST_BATCH_NUMBER:
            - 1
            - 2
            - 3 
phases:
  pre_build:
commands:
#...

After setting up the batch build, CodeBuild creates multiple batches when the build starts. The following screenshot shows the batches on the CodeBuild console.

Regression tests Codebuild project ran in batch mode, three batches ran in prallel successfully

Figure – Regression tests Codebuild project ran in batch mode

Deploying to Enterprise Test Server

ETS is the transaction engine that processes all the online (and batch) requests that are initiated through external clients, such as 3270 terminals, web services, and websphere MQ. This engine provides support for various mainframe subsystems, such as CICS, IMS TM and JES, as well as code-level support for COBOL and PL/I. The following screenshot shows the Enterprise Test Server administration page.

Enterprise Server Administrator window showing configuration for CICS

Figure – Enterprise Server Administrator window

In this mainframe application testing use case, the regression tests are CICS transactions, initiated from 3270 requests (encapsulated in a web service). For more information about Enterprise Test Server, see the Enterprise Test Server and Micro Focus websites.

In the regression pipeline, after the stage of mainframe artifact compiling, we bake in the artifact into an ETS Docker container and upload the image to an Amazon ECR repository. This way, we have an immutable artifact for all the tests.

During each batch’s test preparation stage, a CloudFormation stack is deployed to create an Amazon ECS service on Windows EC2. The stack uses a Network Load Balancer as an integration point for the VHI’s integration.

The following code is an example of the CloudFormation snippet to create an Amazon ECS service using an Enterprise Test Server Docker image:

#...
  EtsService:
    DependsOn:
    - EtsTaskDefinition
    - EtsContainerSecurityGroup
    - EtsLoadBalancerListener
    Properties:
      Cluster: !Ref 'WindowsEcsClusterArn'
      DesiredCount: 1
      LoadBalancers:
        -
          ContainerName: !Sub "ets-${AWS::StackName}"
          ContainerPort: 9270
          TargetGroupArn: !Ref EtsPort9270TargetGroup
      HealthCheckGracePeriodSeconds: 300          
      TaskDefinition: !Ref 'EtsTaskDefinition'
    Type: "AWS::ECS::Service"

  EtsTaskDefinition:
    Properties:
      ContainerDefinitions:
        -
          Image: !Sub "${AWS::AccountId}.dkr.ecr.us-east-1.amazonaws.com/systems-test/ets:latest"
          LogConfiguration:
            LogDriver: awslogs
            Options:
              awslogs-group: !Ref 'SystemsTestLogGroup'
              awslogs-region: !Ref 'AWS::Region'
              awslogs-stream-prefix: ets
          Name: !Sub "ets-${AWS::StackName}"
          cpu: 4096
          memory: 8192
          PortMappings:
            -
              ContainerPort: 9270
          EntryPoint:
          - "powershell.exe"
          Command: 
          - '-F'
          - .\StartAndWait.ps1
          - 'bankdemo'
          - C:\bankdemo\
          - 'wait'
      Family: systems-test-ets
    Type: "AWS::ECS::TaskDefinition"
#...

Deploying the VHI model

In this architecture, the VHI is a bridge between mainframe and clients.

We use the VHI designer to capture the 3270 data streams and encapsulate the relevant data streams into a business function. We can then deliver this function as a web service that can be consumed by a test management solution, such as Micro Focus UFT One.

The following screenshot shows the setup for getCheckingDetails in VHI. Along with this procedure we can also see other procedures (eg calcCostLoan) defined that get generated as a web service. The properties associated with this procedure are available on this screen to allow for the defining of the mapping of the fields between the associated 3270 screens and exposed web service.

example of VHI designer to capture the 3270 data streams and encapsulate the relevant data streams into a business function getCheckingDetails

Figure – Setup for getCheckingDetails in VHI

The following screenshot shows the editor for this procedure and is initiated by the selection of the Procedure Editor. This screen presents the 3270 screens that are involved in the business function that will be generated as a web service.

VHI designer Procedure Editor shows the procedure

Figure – VHI designer Procedure Editor shows the procedure

After you define the required functional web services in VHI designer, the resultant model is saved and deployed into a VHI Docker image. We use this image and the associated model (from VHI designer) in the pipeline outlined in this post.

For more information about VHI, see the VHI website.

The pipeline contains two steps to deploy a VHI service. First, it installs and sets up the VHI models into a VHI Docker image, and it’s pushed into Amazon ECR. Second, a CloudFormation stack is deployed to create an Amazon ECS Fargate service, which uses the latest built Docker image. In AWS CloudFormation, the VHI ECS task definition defines an environment variable for the ETS Network Load Balancer’s DNS name. Therefore, the VHI can bootstrap and point to an ETS service. In the VHI stack, it uses a Network Load Balancer as an integration point for UFT One test integration.

The following code is an example of a ECS Task Definition CloudFormation snippet that creates a VHI service in Amazon ECS Fargate and integrates it with an ETS server:

#...
  VhiTaskDefinition:
    DependsOn:
    - EtsService
    Type: AWS::ECS::TaskDefinition
    Properties:
      Family: systems-test-vhi
      NetworkMode: awsvpc
      RequiresCompatibilities:
        - FARGATE
      ExecutionRoleArn: !Ref FargateEcsTaskExecutionRoleArn
      Cpu: 2048
      Memory: 4096
      ContainerDefinitions:
        - Cpu: 2048
          Name: !Sub "vhi-${AWS::StackName}"
          Memory: 4096
          Environment:
            - Name: esHostName 
              Value: !GetAtt EtsInternalLoadBalancer.DNSName
            - Name: esPort
              Value: 9270
          Image: !Ref "${AWS::AccountId}.dkr.ecr.us-east-1.amazonaws.com/systems-test/vhi:latest"
          PortMappings:
            - ContainerPort: 9680
          LogConfiguration:
            LogDriver: awslogs
            Options:
              awslogs-group: !Ref 'SystemsTestLogGroup'
              awslogs-region: !Ref 'AWS::Region'
              awslogs-stream-prefix: vhi

#...

Deploying UFT One Tests

UFT One is a test client that uses each of the web services created by the VHI designer to orchestrate running each of the associated business functions. Parameter data is supplied to each function, and validations are configured against the data returned. Multiple test suites are configured with different business functions with the associated data.

The following screenshot shows the test suite API_Bankdemo3, which is used in this regression test process.

the screenshot shows the test suite API_Bankdemo3 in UFT One test setup console, the API setup for getCheckingDetails

Figure – API_Bankdemo3 in UFT One Test Editor Console

For more information, see the UFT One website.

Integrating UFT One and testing the application

The last step is to integrate UFT One into CodeBuild and CodePipeline to test our mainframe application. First, we set up CodeBuild to use a UFT One container. The Docker image is available in Docker Hub. Then we author our buildspec. The buildspec has the following three phrases:

  • Setting up a UFT One license and deploying the test infrastructure
  • Starting the UFT One test suite to run regression tests
  • Tearing down the test infrastructure after tests are complete

The following code is an example of a buildspec snippet in the pre_build stage. The snippet shows the command to activate the UFT One license:

version: 0.2
batch: 
# . . .
phases:
  pre_build:
    commands:
      - |
        # Activate License
        $process = Start-Process -NoNewWindow -RedirectStandardOutput LicenseInstall.log -Wait -File 'C:\Program Files (x86)\Micro Focus\Unified Functional Testing\bin\HP.UFT.LicenseInstall.exe' -ArgumentList @('concurrent', 10600, 1, ${env:AUTOPASS_LICENSE_SERVER})        
        Get-Content -Path LicenseInstall.log
        if (Select-String -Path LicenseInstall.log -Pattern 'The installation was successful.' -Quiet) {
          Write-Host 'Licensed Successfully'
        } else {
          Write-Host 'License Failed'
          exit 1
        }
#...

The following command in the buildspec deploys the test infrastructure using the AWS Command Line Interface (AWS CLI)

aws cloudformation deploy --stack-name $stack_name `
--template-file cicd-pipeline/systems-test-pipeline/systems-test-service.yaml `
--parameter-overrides EcsCluster=$cluster_arn `
--capabilities CAPABILITY_IAM

Because ETS and VHI are both deployed with a load balancer, the build detects when the load balancers become healthy before starting the tests. The following AWS CLI commands detect the load balancer’s target group health:

$vhi_health_state = (aws elbv2 describe-target-health --target-group-arn $vhi_target_group_arn --query 'TargetHealthDescriptions[0].TargetHealth.State' --output text)
$ets_health_state = (aws elbv2 describe-target-health --target-group-arn $ets_target_group_arn --query 'TargetHealthDescriptions[0].TargetHealth.State' --output text)          

When the targets are healthy, the build moves into the build stage, and it uses the UFT One command line to start the tests. See the following code:

$process = Start-Process -Wait  -NoNewWindow -RedirectStandardOutput UFTBatchRunnerCMD.log `
-FilePath "C:\Program Files (x86)\Micro Focus\Unified Functional Testing\bin\UFTBatchRunnerCMD.exe" `
-ArgumentList @("-source", "${env:CODEBUILD_SRC_DIR_DemoSrc}\bankdemo\tests\API_Bankdemo\API_Bankdemo${env:TEST_BATCH_NUMBER}")

The next release of Micro Focus UFT One (November or December 2020) will provide an exit status to indicate a test’s success or failure.

When the tests are complete, the post_build stage tears down the test infrastructure. The following AWS CLI command tears down the CloudFormation stack:


#...
	post_build:
	  finally:
	  	- |
		  Write-Host "Clean up ETS, VHI Stack"
		  #...
		  aws cloudformation delete-stack --stack-name $stack_name
          aws cloudformation wait stack-delete-complete --stack-name $stack_name

At the end of the build, the buildspec is set up to upload UFT One test reports as an artifact into Amazon Simple Storage Service (Amazon S3). The following screenshot is the example of a test report in HTML format generated by UFT One in CodeBuild and CodePipeline.

UFT One HTML report shows regression testresult and test detals

Figure – UFT One HTML report

A new release of Micro Focus UFT One will provide test report formats supported by CodeBuild test report groups.

Conclusion

In this post, we introduced the solution to use Micro Focus Enterprise Suite, Micro Focus UFT One, Micro Focus VHI, AWS developer tools, and Amazon ECS containers to automate provisioning and running mainframe application tests in AWS at scale.

The on-demand model allows you to create the same test capacity infrastructure in minutes at a fraction of your current on-premises mainframe cost. It also significantly increases your testing and delivery capacity to increase quality and reduce production downtime.

A demo of the solution is available in AWS Partner Micro Focus website AWS Mainframe CI/CD Enterprise Solution. If you’re interested in modernizing your mainframe applications, please visit Micro Focus and contact AWS mainframe business development at [email protected].

References

Micro Focus


Peter Woods

Peter Woods

Peter has been with Micro Focus for almost 30 years, in a variety of roles and geographies including Technical Support, Channel Sales, Product Management, Strategic Alliances Management and Pre-Sales, primarily based in Europe but for the last four years in Australia and New Zealand. In his current role as Pre-Sales Manager, Peter is charged with driving and supporting sales activity within the Application Modernization and Connectivity team, based in Melbourne.

Leo Ervin

Leo Ervin

Leo Ervin is a Senior Solutions Architect working with Micro Focus Enterprise Solutions working with the ANZ team. After completing a Mathematics degree Leo started as a PL/1 programming with a local insurance company. The next step in Leo’s career involved consulting work in PL/1 and COBOL before he joined a start-up company as a technical director and partner. This company became the first distributor of Micro Focus software in the ANZ region in 1986. Leo’s involvement with Micro Focus technology has continued from this distributorship through to today with his current focus on cloud strategies for both DevOps and re-platform implementations.

Kevin Yung

Kevin Yung

Kevin is a Senior Modernization Architect in AWS Professional Services Global Mainframe and Midrange Modernization (GM3) team. Kevin currently is focusing on leading and delivering mainframe and midrange applications modernization for large enterprise customers.

Using AWS Lambda extensions to send logs to custom destinations

Post Syndicated from Julian Wood original https://aws.amazon.com/blogs/compute/using-aws-lambda-extensions-to-send-logs-to-custom-destinations/

You can now send logs from AWS Lambda functions directly to a destination of your choice using AWS Lambda Extensions. Lambda Extensions are a new way for monitoring, observability, security, and governance tools to easily integrate with AWS Lambda. For more information, see “Introducing AWS Lambda Extensions – In preview”.

To help you troubleshoot failures in Lambda functions, AWS Lambda automatically captures and streams logs to Amazon CloudWatch Logs. This stream contains the logs that your function code and extensions generate, in addition to logs the Lambda service generates as part of the function invocation.

Previously, to send logs to a custom destination, you typically configure and operate a CloudWatch Log Group subscription. A different Lambda function forwards logs to the destination of your choice.

Logging tools, running as Lambda extensions, can now receive log streams directly from within the Lambda execution environment, and send them to any destination. This makes it even easier for you to use your preferred extensions for diagnostics.

Today, you can use extensions to send logs to Coralogix, Datadog, Honeycomb, Lumigo, New Relic, and Sumo Logic.

Overview

To receive logs, extensions subscribe using the new Lambda Logs API.

Lambda Logs API

Lambda Logs API

The Lambda service then streams the logs directly to the extension. The extension can then process, filter, and route them to any preferred destination. Lambda still sends the logs to CloudWatch Logs.

You deploy extensions, including ones that use the Logs API, as Lambda layers, with the AWS Management Console and AWS Command Line Interface (AWS CLI). You can also use infrastructure as code tools such as AWS CloudFormation, the AWS Serverless Application Model (AWS SAM), Serverless Framework, and Terraform.

Logging extensions from AWS Lambda Ready Partners and AWS Partners available at launch

Today, you can use logging extensions with the following tools:

  • The Datadog extension now makes it easier than ever to collect your serverless application logs for visualization, analysis, and archival. Paired with Datadog’s AWS integration, end-to-end distributed tracing, and real-time enhanced AWS Lambda metrics, you can proactively detect and resolve serverless issues at any scale.
  • Lumigo provides monitoring and debugging for modern cloud applications. With the open source extension from Lumigo, you can send Lambda function logs directly to an S3 bucket, unlocking new post processing use cases.
  • New Relic enables you to efficiently monitor, troubleshoot, and optimize your Lambda functions. New Relic’s extension allows you send your Lambda service platform logs directly to New Relic’s unified observability platform, allowing you to quickly visualize data with minimal latency and cost.
  • Coralogix is a log analytics and cloud security platform that empowers thousands of companies to improve security and accelerate software delivery, allowing you to get deep insights without paying for the noise. Coralogix can now read Lambda function logs and metrics directly, without using Cloudwatch or S3, reducing the latency, and cost of observability.
  • Honeycomb is a powerful observability tool that helps you debug your entire production app stack. Honeycomb’s extension decreases the overhead, latency, and cost of sending events to the Honeycomb service, while increasing reliability.
  • The Sumo Logic extension enables you to get instant visibility into the health and performance of your mission-critical applications using AWS Lambda. With this extension and Sumo Logic’s continuous intelligence platform, you can now ensure that all your Lambda functions are running as expected, by analyzing function, platform, and extension logs to quickly identify and remediate errors and exceptions.

You can also build and use your own logging extensions to integrate your organization’s tooling.

Showing a logging extension to send logs directly to S3

This demo shows an example of using a simple logging extension to send logs to Amazon Simple Storage Service (S3).

To set up the example, visit the GitHub repo and follow the instructions in the README.md file.

The example extension runs a local HTTP endpoint listening for HTTP POST events. Lambda delivers log batches to this endpoint. The example creates an S3 bucket to store the logs. A Lambda function is configured with an environment variable to specify the S3 bucket name. Lambda streams the logs to the extension. The extension copies the logs to the S3 bucket.

Lambda environment variable specifying S3 bucket

Lambda environment variable specifying S3 bucket

The extension uses the Extensions API to register for INVOKE and SHUTDOWN events. The extension, using the Logs API, then subscribes to receive platform and function logs, but not extension logs.

As the example is an asynchronous system, logs for one invoke may be processed during the next invocation. Logs for the last invoke may be processed during the SHUTDOWN event.

Testing the function from the Lambda console, Lambda sends logs to CloudWatch Logs. The logs stream shows logs from the platform, function, and extension.

Lambda logs visible in CloudWatch Logs

Lambda logs visible in CloudWatch Logs

The logging extension also receives the log stream directly from Lambda, and copies the logs to S3.

Browsing to the S3 bucket, the log files are available.

S3 bucket containing copied logs

S3 bucket containing copied logs.

Downloading the file shows the log lines. The log contains the same platform and function logs, but not the extension logs, as specified during the subscription.

[{'time': '2020-11-12T14:55:06.560Z', 'type': 'platform.start', 'record': {'requestId': '49e64413-fd42-47ef-b130-6fd16f30148d', 'version': '$LATEST'}},
{'time': '2020-11-12T14:55:06.774Z', 'type': 'platform.logsSubscription', 'record': {'name': 'logs_api_http_extension.py', 'state': 'Subscribed', 'types': ['platform', 'function']}},
{'time': '2020-11-12T14:55:06.774Z', 'type': 'platform.extension', 'record': {'name': 'logs_api_http_extension.py', 'state': 'Ready', 'events': ['INVOKE', 'SHUTDOWN']}},
{'time': '2020-11-12T14:55:06.776Z', 'type': 'function', 'record': 'Function: Logging something which logging extension will send to S3\n'}, {'time': '2020-11-12T14:55:06.780Z', 'type': 'platform.end', 'record': {'requestId': '49e64413-fd42-47ef-b130-6fd16f30148d'}}, {'time': '2020-11-12T14:55:06.780Z', 'type': 'platform.report', 'record': {'requestId': '49e64413-fd42-47ef-b130-6fd16f30148d', 'metrics': {'durationMs': 4.96, 'billedDurationMs': 100, 'memorySizeMB': 128, 'maxMemoryUsedMB': 87, 'initDurationMs': 792.41}, 'tracing': {'type': 'X-Amzn-Trace-Id', 'value': 'Root=1-5fad4cc9-70259536495de84a2a6282cd;Parent=67286c49275ac0ad;Sampled=1'}}}]

Lambda has sent specific logs directly to the subscribed extension. The extension has then copied them directly to S3.

For more example log extensions, see the Github repository.

How do extensions receive logs?

Extensions start a local listener endpoint to receive the logs using one of the following protocols:

  1. TCP – Logs are delivered to a TCP port in Newline delimited JSON format (NDJSON).
  2. HTTP – Logs are delivered to a local HTTP endpoint through PUT or POST, as an array of records in JSON format. http://sandbox:${PORT}/${PATH}. The $PATH parameter is optional.

AWS recommends using an HTTP endpoint over TCP because HTTP tracks successful delivery of the log messages to the local endpoint that the extension sets up.

Once the endpoint is running, extensions use the Logs API to subscribe to any of three different logs streams:

  • Function logs that are generated by the Lambda function.
  • Lambda service platform logs (such as the START, END, and REPORT logs in CloudWatch Logs).
  • Extension logs that are generated by extension code.

The Lambda service then sends logs to endpoint subscribers inside of the execution environment only.

Even if an extension subscribes to one or more log streams, Lambda continues to send all logs to CloudWatch.

Performance considerations

Extensions share resources with the function, such as CPU, memory, disk storage, and environment variables. They also share permissions, using the same AWS Identity and Access Management (IAM) role as the function.

Log subscriptions consume memory resources as each subscription opens a new memory buffer to store the logs. This memory usage counts towards memory consumed within the Lambda execution environment.

For more information on resources, security and performance with extensions, see “Introducing AWS Lambda Extensions – In preview”.

What happens if Lambda cannot deliver logs to an extension?

The Lambda service stores logs before sending to CloudWatch Logs and any subscribed extensions. If Lambda cannot deliver logs to the extension, it automatically retries with backoff. If the log subscriber crashes, Lambda restarts the execution environment. The logs extension re-subscribes, and continues to receive logs.

When using an HTTP endpoint, Lambda continues to deliver logs from the last acknowledged delivery. With TCP, the extension may lose logs if an extension or the execution environment fails.

The Lambda service buffers logs in memory before delivery. The buffer size is proportional to the buffering configuration used in the subscription request. If an extension cannot process the incoming logs quickly enough, the buffer fills up. To reduce the likelihood of an out of memory event due to a slow extension, the Lambda service drops records and adds a platform.logsDropped log record to the affected extension to indicate the number of dropped records.

Disabling logging to CloudWatch Logs

Lambda continues to send logs to CloudWatch Logs even if extensions subscribe to the logs stream.

To disable logging to CloudWatch Logs for a particular function, you can amend the Lambda execution role to remove access to CloudWatch Logs.

{
"Version": "2012-10-17",
"Statement": [
    {
        "Effect": "Deny",
        "Action": [
            "logs:CreateLogGroup",
            "logs:CreateLogStream",
            "logs:PutLogEvents"
        ],
        "Resource": [
            "arn:aws:logs:*:*:*"
        ]
    }
  ]
}

Logs are no longer delivered to CloudWatch Logs for functions using this role, but are still streamed to subscribed extensions. You are no longer billed for CloudWatch logging for these functions.

Pricing

Logging extensions, like other extensions, share the same billing model as Lambda functions. When using Lambda functions with extensions, you pay for requests served and the combined compute time used to run your code and all extensions, in 100 ms increments. To learn more about the billing for extensions, visit the Lambda FAQs page.

Conclusion

Lambda extensions enable you to extend the Lambda service to more easily integrate with your favorite tools for monitoring, observability, security, and governance.

Extensions can now subscribe to receive log streams directly from the Lambda service, in addition to CloudWatch Logs. Today, you can install a number of available logging extensions from AWS Lambda Ready Partners and AWS Partners. Extensions make it easier to use your existing tools with your serverless applications.

To try the S3 demo logging extension, follow the instructions in the README.md file in the GitHub repository.

Extensions are now available in preview in all commercial regions other than the China regions.

For more serverless learning resources, visit https://serverlessland.com.

Introducing AWS Gateway Load Balancer – Easy Deployment, Scalability, and High Availability for Partner Appliances

Post Syndicated from Channy Yun original https://aws.amazon.com/blogs/aws/introducing-aws-gateway-load-balancer-easy-deployment-scalability-and-high-availability-for-partner-appliances/

Last year, we launched Virtual Private Cloud (VPC) Ingress Routing to allow routing of all incoming and outgoing traffic to/from an Internet Gateway (IGW) or Virtual Private Gateway (VGW) to the Elastic Network Interface of a specific Amazon Elastic Compute Cloud (EC2) instance. With VPC Ingress Routing, you can now configure your VPC to send all […]

Building Extensions for AWS Lambda – In preview

Post Syndicated from Julian Wood original https://aws.amazon.com/blogs/compute/building-extensions-for-aws-lambda-in-preview/

AWS Lambda is announcing a preview of Lambda Extensions, a new way to easily integrate Lambda with your favorite monitoring, observability, security, and governance tools. Extensions enable tools to integrate deeply into the Lambda execution environment to control and participate in Lambda’s lifecycle. This simplified experience makes it easier for you to use your preferred tools across your application portfolio today.

In this post I explain how Lambda extensions work, the changes to the Lambda lifecycle, and how to build an extension. To learn how to use extensions with your functions, see the companion blog post “Introducing AWS Lambda extensions”.

Extensions are built using the new Lambda Extensions API, which provides a way for tools to get greater control during function initialization, invocation, and shut down. This API builds on the existing Lambda Runtime API, which enables you to bring custom runtimes to Lambda.

You can use extensions from AWS, AWS Lambda Ready Partners, and open source projects for use-cases such as application performance monitoring, secrets management, configuration management, and vulnerability detection. You can also build your own extensions to integrate your own tooling using the Extensions API.

There are extensions available today for AppDynamics, Check Point, Datadog, Dynatrace, Epsagon, HashiCorp, Lumigo, New Relic, Thundra, Splunk, AWS AppConfig, and Amazon CloudWatch Lambda Insights. For more details on these, see “Introducing AWS Lambda extensions”.

The Lambda execution environment

Lambda functions run in a sandboxed environment called an execution environment. This isolates them from other functions and provides the resources, such as memory, specified in the function configuration.

Lambda automatically manages the lifecycle of compute resources so that you pay for value. Between function invocations, the Lambda service freezes the execution environment. It is thawed if the Lambda service needs the execution environment for subsequent invocations.

Previously, only the runtime process could influence the lifecycle of the execution environment. It would communicate with the Runtime API, which provides an HTTP API endpoint within the execution environment to communicate with the Lambda service.

Lambda and Runtime API

Lambda and Runtime API

The runtime uses the API to request invocation events from Lambda and deliver them to the function code. It then informs the Lambda service when it has completed processing an event. The Lambda service then freezes the execution environment.

The runtime process previously exposed two distinct phases in the lifecycle of the Lambda execution environment: Init and Invoke.

1. Init: During the Init phase, the Lambda service initializes the runtime, and then runs the function initialization code (the code outside the main handler). The Init phase happens either during the first invocation, or in advance if Provisioned Concurrency is enabled.

2. Invoke: During the invoke phase, the runtime requests an invocation event from the Lambda service via the Runtime API, and invokes the function handler. It then returns the function response to the Runtime API.

After the function runs, the Lambda service freezes the execution environment and maintains it for some time in anticipation of another function invocation.

If the Lambda function does not receive any invokes for a period of time, the Lambda service shuts down and removes the environment.

Previous Lambda lifecycle

Previous Lambda lifecycle

With the addition of the Extensions API, extensions can now influence, control, and participate in the lifecycle of the execution environment. They can use the Extensions API to influence when the Lambda service freezes the execution environment.

AWS Lambda execution environment with the Extensions API

AWS Lambda execution environment with the Extensions API

Extensions are initialized before the runtime and the function. They then continue to run in parallel with the function, get greater control during function invocation, and can run logic during shut down.

Extensions allow integrations with the Lambda service by introducing the following changes to the Lambda lifecycle:

  1. An updated Init phase. There are now three discrete Init tasks: extensions Init, runtime Init, and function Init. This creates an order where extensions and the runtime can perform setup tasks before the function code runs.
  2. Greater control during invocation. During the invoke phase, as before, the runtime requests the invocation event and invokes the function handler. In addition, extensions can now request lifecycle events from the Lambda service. They can run logic in response to these lifecycle events, and respond to the Lambda service when they are done. The Lambda service freezes the execution environment when it hears back from the runtime and all extensions. In this way, extensions can influence the freeze/thaw behavior.
  3. Shutdown phase: we are now exposing the shutdown phase to let extensions stop cleanly when the execution environment shuts down. The Lambda service sends a shut down event, which tells the runtime and extensions that the environment is about to be shut down.
New Lambda lifecycle with extensions

New Lambda lifecycle with extensions

Each Lambda lifecycle phase starts with an event from the Lambda service to the runtime and all registered extensions. The runtime and extensions signal that they have completed by requesting the Next invocation event from the Runtime and Extensions APIs. Lambda freezes the execution environment and all extensions when there are no pending events.

Lambda lifecycle for execution environment, runtime, extensions, and function.png

Lambda lifecycle for execution environment, runtime, extensions, and function.png

For more information on the lifecycle phases and the Extensions API, see the documentation.

How are extensions delivered and run?

You deploy extensions as Lambda layers, which are ZIP archives containing shared libraries or other dependencies.

To add a layer, use the AWS Management Console, AWS Command Line Interface (AWS CLI), or infrastructure as code tools such as AWS CloudFormation, the AWS Serverless Application Model (AWS SAM), and Terraform.

When the Lambda service starts the function execution environment, it extracts the extension files from the Lambda layer into the /opt directory. Lambda then looks for any extensions in the /opt/extensions directory and starts initializing them. Extensions need to be executable as binaries or scripts. As the function code directory is read-only, extensions cannot modify function code.

Extensions can run in either of two modes, internal and external.

  • Internal extensions run as part of the runtime process, in-process with your code. They are not separate processes. Internal extensions allow you to modify the startup of the runtime process using language-specific environment variables and wrapper scripts. You can use language-specific environment variables to add options and tools to the runtime for Java Correto 8 and 11, Node.js 10 and 12, and .NET Core 3.1. Wrapper scripts allow you to delegate the runtime startup to your script to customize the runtime startup behavior. You can use wrapper scripts with Node.js 10 and 12, Python 3.8, Ruby 2.7, Java 8 and 11, and .NET Core 3.1. For more information, see “Modifying-the-runtime-environment”.
  • External extensions allow you to run separate processes from the runtime but still within the same execution environment as the Lambda function. External extensions can start before the runtime process, and can continue after the runtime shuts down. External extensions work with Node.js 10 and 12, Python 3.7 and 3.8, Ruby 2.5 and 2.7, Java Corretto 8 and 11, .NET Core 3.1, and custom runtimes.

External extensions can be written in a different language to the function. We recommend implementing external extensions using a compiled language as a self-contained binary. This makes the extension compatible with all of the supported runtimes. If you use a non-compiled language, ensure that you include a compatible runtime in the extension.

Extensions run in the same execution environment as the function, so share resources such as CPU, memory, and disk storage with the function. They also share environment variables, in addition to permissions, using the same AWS Identity and Access Management (IAM) role as the function.

For more details on resources, security, and performance with extensions, see the companion blog post “Introducing AWS Lambda extensions”.

For example extensions and wrapper scripts to help you build your own extensions, see the GitHub repository.

Showing extensions in action

The demo shows how external extensions integrate deeply with functions and the Lambda runtime. The demo creates an example Lambda function with a single extension using either the AWS CLI, or AWS SAM.

The example shows how an external extension can start before the runtime, run during the Lambda function invocation, and shut down after the runtime shuts down.

To set up the example, visit the GitHub repo, and follow the instructions in the README.md file.

The example Lambda function uses the custom provided.al2 runtime based on Amazon Linux 2. Using the custom runtime helps illustrate in more detail how the Lambda service, Runtime API, and the function communicate. The extension is delivered using a Lambda layer.

The runtime, function, and extension, log their status events to Amazon CloudWatch Logs. The extension initializes as a separate process and waits to receive the function invocation event from the Extensions API. It then sleeps for 5 seconds before calling the API again to register to receive the next event. The extension sleep simulates the processing of a parallel process. This could, for example, collect telemetry data to send to an external observability service.

When the Lambda function is invoked, the extension, runtime and function perform the following steps. I walk through the steps using the log output.

1. The Lambda service adds the configured extension Lambda layer. It then searches the /opt/extensions folder, and finds an extension called extension1.sh. The extension executable launches before the runtime initializes. It registers with the Extensions API to receive INVOKE and SHUTDOWN events using the following API call.

curl -sS -LD "$HEADERS" -XPOST "http://${AWS_LAMBDA_RUNTIME_API}/2020-01-01/extension/register" --header "Lambda-Extension-Name: ${LAMBDA_EXTENSION_NAME}" -d "{ \"events\": [\"INVOKE\", \"SHUTDOWN\"]}" > $TMPFILE
Extension discovery, registration, and start

Extension discovery, registration, and start

2. The Lambda custom provided.al2 runtime initializes from the bootstrap file.

Runtime initialization

Runtime initialization

3. The runtime calls the Runtime API to get the next event using the following API call. The HTTP request is blocked until the event is received.

curl -sS -LD "$HEADERS" -X GET "http://${AWS_LAMBDA_RUNTIME_API}/2018-06-01/runtime/invocation/next" > $TMPFILE &

The extension calls the Extensions API and waits for the next event. The HTTP request is again blocked until one is received.

curl -sS -L -XGET "http://${AWS_LAMBDA_RUNTIME_API}/2020-01-01/extension/event/next" --header "Lambda-Extension-Identifier: ${EXTENSION_ID}" > $TMPFILE &
Runtime and extension call APIs to get the next event

Runtime and extension call APIs to get the next event

4. The Lambda service receives an invocation event. It sends the event payload to the runtime using the Runtime API. It sends an event to the extension informing it about the invocation, using the Extensions API.

Runtime and extension receive event

Runtime and extension receive event

5. The runtime invokes the function handler. The function receives the event payload.

Runtime invokes handler

Runtime invokes handler

6. The function runs the handler code. The Lambda runtime receives back the function response and sends it back to the Runtime API with the following API call.

curl -sS -X POST "http://${AWS_LAMBDA_RUNTIME_API}/2018-06-01/runtime/invocation/$REQUEST_ID/response" -d "$RESPONSE" > $TMPFILE
Runtime receives function response and sends to Runtime API

Runtime receives function response and sends to Runtime API

7. The Lambda runtime then waits for the next invocation event (warm start).

Runtime waits for next event

Runtime waits for next event

8. The extension continues processing for 5 seconds, simulating the processing of a companion process. The extension finishes, and uses the Extensions API to register again to wait for the next event.

Extension processing

Extension processing

9. The function invocation report is logged.

Function invocation report

Function invocation report

10. When Lambda is about to shut down the execution environment, it sends the Runtime API a shut down event.

Lambda runtime shut down event

Lambda runtime shut down event

11. Lambda then sends a shut down event to the extensions. The extension finishes processing and then shuts down after the runtime.

Lambda extension shut down event

Lambda extension shut down event

The demo shows the steps the runtime, function, and extensions take during the Lambda lifecycle.

An external extension registers and starts before the runtime. When Lambda receives an invocation event, it sends it to the runtime. It then sends an event to the extension informing it about the invocation. The runtime invokes the function handler, and the extension does its own processing of the event. The extension continues processing after the function invocation completes. When Lambda is about to shut down the execution environment, it sends a shut down event to the runtime. It then sends one to the extension, so it can finish processing.

To see a sequence diagram of this flow, see the Extensions API documentation.

Pricing

Extensions share the same billing model as Lambda functions. When using Lambda functions with extensions, you pay for requests served and the combined compute time used to run your code and all extensions, in 100 ms increments. To learn more about the billing for extensions, visit the Lambda FAQs page.

Conclusion

Lambda extensions enable you to extend Lambda’s execution environment to more easily integrate with your favorite tools for monitoring, observability, security, and governance.

Extensions can run additional code; before, during, and after a function invocation. There are extensions available today from AWS Lambda Ready Partners. These cover use-cases such as application performance monitoring, secrets management, configuration management, and vulnerability detection. Extensions make it easier to use your existing tools with your serverless applications. For more information on the available extensions, see the companion post “Introducing Lambda Extensions – In preview“.

You can also build your own extensions to integrate your own tooling using the new Extensions API. For example extensions and wrapper scripts, see the GitHub repository.

Extensions are now available in preview in the following Regions: us-east-1, us-east-2, us-west-1, us-west-2, ca-central-1, eu-west-1, eu-west-2, eu-west-3, eu-central-1, eu-north-1, eu-south-1, sa-east-1, me-south-1, ap-northeast-1, ap-northeast-2, ap-northeast-3, ap-southeast-1, ap-southeast-2, ap-south-1, and ap-east-1.

For more serverless learning resources, visit https://serverlessland.com.

Introducing AWS Lambda Extensions – In preview

Post Syndicated from Julian Wood original https://aws.amazon.com/blogs/compute/introducing-aws-lambda-extensions-in-preview/

AWS Lambda is announcing a preview of Lambda Extensions, a new way to easily integrate Lambda with your favorite monitoring, observability, security, and governance tools. In this post I explain how Lambda extensions work, how you can begin using them, and the extensions from AWS Lambda Ready Partners that are available today.

Extensions help solve a common request from customers to make it easier to integrate their existing tools with Lambda. Previously, customers told us that integrating Lambda with their preferred tools required additional operational and configuration tasks. In addition, tools such as log agents, which are long-running processes, could not easily run on Lambda.

Extensions are a new way for tools to integrate deeply into the Lambda environment. There is no complex installation or configuration, and this simplified experience makes it easier for you to use your preferred tools across your application portfolio today. You can use extensions for use-cases such as:

  • capturing diagnostic information before, during, and after function invocation
  • automatically instrumenting your code without needing code changes
  • fetching configuration settings or secrets before the function invocation
  • detecting and alerting on function activity through hardened security agents, which can run as separate processes from the function

You can use extensions from AWS, AWS Lambda Ready Partners, and open source projects. There are extensions available today for AppDynamics, Check Point, Datadog, Dynatrace, Epsagon, HashiCorp, Lumigo, New Relic, Thundra, Splunk SignalFX, AWS AppConfig, and Amazon CloudWatch Lambda Insights.

You can learn how to build your own extensions, in the companion post “Building Extensions for AWS Lambda – In preview“.

Overview

Lambda Extensions is designed to be the easiest way to plug in the tools you use today without complex installation or configuration management. You deploy extensions as Lambda layers, with the AWS Management Console and AWS Command Line Interface (AWS CLI). You can also use infrastructure as code tools such as AWS CloudFormation, the AWS Serverless Application Model (AWS SAM), Serverless Framework, and Terraform. You can use Stackery to automate the integration of extensions from Epsagon, New Relic, Lumigo, and Thundra.

There are two components to the Lambda Extensions capability: the Extensions API and extensions themselves. Extensions are built using the new Lambda Extensions API which provides a way for tools to get greater control during function initialization, invocation, and shut down. This API builds on the existing Lambda Runtime API, which enables you to bring custom runtimes to Lambda.

AWS Lambda execution environment with the Extensions API

AWS Lambda execution environment with the Extensions API

Most customers will use extensions without needing to know about the capabilities of the Extensions API that enables them. You can just consume capabilities of an extension by configuring the options in your Lambda functions. Developers who build extensions use the Extensions API to register for function and execution environment lifecycle events.

Extensions can run in either of two modes – internal and external.

  • Internal extensions run as part of the runtime process, in-process with your code. They allow you to modify the startup of the runtime process using language-specific environment variables and wrapper scripts. Internal extensions enable use cases such as automatically instrumenting code.
  • External extensions allow you to run separate processes from the runtime but still within the same execution environment as the Lambda function. External extensions can start before the runtime process, and can continue after the runtime shuts down. External extensions enable use cases such as fetching secrets before the invocation, or sending telemetry to a custom destination outside of the function invocation. These extensions run as companion processes to Lambda functions.

For more information on the Extensions API and the changes to the Lambda lifecycle, see “Building Extensions for AWS Lambda – In preview

AWS Lambda Ready Partners extensions available at launch

Today, you can use extensions with the following AWS and AWS Lambda Ready Partner’s tools, and there are more to come:

  • AppDynamics provides end-to-end transaction tracing for AWS Lambda. With the AppDynamics extension, it is no longer mandatory for developers to include the AppDynamics tracer as a dependency in their function code, making tracing transactions across hybrid architectures even simpler.
  • The Datadog extension brings comprehensive, real-time visibility to your serverless applications. Combined with Datadog’s existing AWS integration, you get metrics, traces, and logs to help you monitor, detect, and resolve issues at any scale. The Datadog extension makes it easier than ever to get telemetry from your serverless workloads.
  • The Dynatrace extension makes it even easier to bring AWS Lambda metrics and traces into the Dynatrace platform for intelligent observability and automatic root cause detection. Get comprehensive, end-to-end observability with the flip of a switch and no code changes.
  • Epsagon helps you monitor, troubleshoot, and lower the cost for your Lambda functions. Epsagon’s extension reduces the overhead of sending traces to the Epsagon service, with minimal performance impact to your function.
  • HashiCorp Vault allows you to secure, store, and tightly control access to your application’s secrets and sensitive data. With the Vault extension, you can now authenticate and securely retrieve dynamic secrets before your Lambda function invokes.
  • Lumigo provides a monitoring and observability platform for serverless and microservices applications. The Lumigo extension enables the new Lumigo Lambda Profiler to see a breakdown of function resources, including CPU, memory, and network metrics. Receive actionable insights to reduce Lambda runtime duration and cost, fix bottlenecks, and increase efficiency.
  • Check Point CloudGuard provides full lifecycle security for serverless applications. The CloudGuard extension enables Function Self Protection data aggregation as an out-of-process extension, providing detection and alerting on application layer attacks.
  • New Relic provides a unified observability experience for your entire software stack. The New Relic extension uses a simpler companion process to report function telemetry data. This also requires fewer AWS permissions to add New Relic to your application.
  • Thundra provides an application debugging, observability and security platform for serverless, container and virtual machine (VM) workloads. The Thundra extension adds asynchronous telemetry reporting functionality to the Thundra agents, getting rid of network latency.
  • Splunk offers an enterprise-grade cloud monitoring solution for real-time full-stack visibility at scale. The Splunk extension provides a simplified runtime-independent interface to collect high-resolution observability data with minimal overhead. Monitor, manage, and optimize the performance and cost of your serverless applications with Splunk Observability solutions.
  • AWS AppConfig helps you manage, store, and safely deploy application configurations to your hosts at runtime. The AWS AppConfig extension integrates Lambda and AWS AppConfig seamlessly. Lambda functions have simple access to external configuration settings quickly and easily. Developers can now dynamically change their Lambda function’s configuration safely using robust validation features.
  • Amazon CloudWatch Lambda Insights enables you to efficiently monitor, troubleshoot, and optimize Lambda functions. The Lambda Insights extension simplifies the collection, visualization, and investigation of detailed compute performance metrics, errors, and logs. You can more easily isolate and correlate performance problems to optimize your Lambda environments.

You can also build and use your own extensions to integrate your organization’s tooling. For instance, the Cloud Foundations team at Square has built their own extension. They say:

The Cloud Foundations team at Square works to make the cloud accessible and secure. We partnered with the Security Infrastructure team, who builds infrastructure to secure Square’s sensitive data, to enable serverless applications at Square,​ and ​provide mTLS identities to Lambda​.

Since beginning work on Lambda, we have focused on creating a streamlined developer experience. Teams adopting Lambda need to learn a lot about AWS, and we see extensions as a way to abstract away common use cases. For our initial exploration, we wanted to make accessing secrets easy, as with our current tools each Lambda function usually pulls 3-5 secrets.

The extension we built and open source fetches secrets on cold starts, before the Lambda function is invoked. Each function includes a configuration file that specifies which secrets to pull. We knew this configuration was key, as Lambda functions should only be doing work they need to do. The secrets are cached in the local /tmp directory, which the function reads when it needs the secret data. This makes Lambda functions not only faster, but reduces the amount of code for accessing secrets.

Showing extensions in action with AWS AppConfig

This demo shows an example of using the AWS AppConfig with a Lambda function. AWS AppConfig is a capability of AWS Systems Manager to create, manage, and quickly deploy application configurations. It lets you dynamically deploy external configuration without having to redeploy your applications. As AWS AppConfig has robust validation features, all configuration changes can be tested safely before rolling out to your applications.

AWS AppConfig has an available extension which gives Lambda functions access to external configuration settings quickly and easily. The extension runs a separate local process to retrieve and cache configuration data from the AWS AppConfig service. The function code can then fetch configuration data faster using a local call rather than over the network.

To set up the example, visit the GitHub repo and follow the instructions in the README.md file.

The example creates an AWS AppConfig application, environment, and configuration profile. It stores a loglevel value, initially set to normal.

AWS AppConfig application, environment, and configuration profile

AWS AppConfig application, environment, and configuration profile

An AWS AppConfig deployment runs to roll out the initial configuration.

AWS AppConfig deployment

AWS AppConfig deployment

The example contains two Lambda functions that include the AWS AppConfig extension. For a list of the layers that have the AppConfig extension, see the blog post “AWS AppConfig Lambda Extension”.

As extensions share the same permissions as Lambda functions, the functions have execution roles that allow access to retrieve the AWS AppConfig configuration.

Lambda function add layer

Lambda function add layer

The functions use the extension to retrieve the loglevel value from AWS AppConfig, returning the value as a response. In a production application, this value could be used within function code to determine what level of information to send to CloudWatch Logs. For example, to troubleshoot an application issue, you can change the loglevel value centrally. Subsequent function invocations for both functions use the updated value.

Both Lambda functions are configured with an environment variable that specifies which AWS AppConfig configuration profile and value to use.

Lambda environment variable specifying AWS AppConfig profile

Lambda environment variable specifying AWS AppConfig profile

The functions also return whether the invocation is a cold start.

Running the functions with a test payload returns the loglevel value normal. The first invocation is a cold start.

{
  "event": {
    "hello": "world"
  },
  "ColdStart": true,
  "LogLevel": "normal"
}

Subsequent invocations return the same value with ColdStart set to false.

{
  "event": {
    "hello": "world"
  },
  "ColdStart": false,
  "LogLevel": "normal"
}

Create a new AWS Config hosted configuration profile version setting the loglevel value to verbose. Run a new AWS AppConfig deployment to update the value. The extension for both functions retrieves the new value. The function configuration itself is not changed.

Running another test invocation for both functions returns the updated value still without a cold start.

{
  "event": {
    "hello": "world"
  },
  "ColdStart": false,
  "LogLevel": "verbose"
}

AWS AppConfig has worked seamlessly with Lambda to update a dynamic external configuration setting for multiple Lambda functions without having to redeploy the function configuration.

The only function configuration required is to add the layer which contains the AWS AppConfig extension.

Pricing

Extensions share the same billing model as Lambda functions. When using Lambda functions with extensions, you pay for requests served and the combined compute time used to run your code and all extensions, in 100 ms increments. To learn more about the billing for extensions, visit the Lambda FAQs page.

Resources, security, and performance with extensions

Extensions run in the same execution environment as the function code. Therefore, they share resources with the function, such as CPU, memory, disk storage, and environment variables. They also share permissions, using the same AWS Identity and Access Management (IAM) role as the function.

You can configure up to 10 extensions per function, using up to five layers at a time. Multiple extensions can be included in a single layer.

The size of the extensions counts towards the deployment package limit. This cannot exceed the unzipped deployment package size limit of 250 MB.

External extensions are initialized before the runtime is started so can increase the delay before the function is invoked. Today, the function invocation response is returned after all extensions have completed. An extension that takes time to complete can increase the delay before the function response is returned. If an extension performs compute-intensive operations, function execution duration may increase. To measure the additional time the extension runs after the function invocation, use the new PostRuntimeExtensionsDuration CloudWatch metric to measure the extra time the extension takes after the function execution. To understand the impact of a specific extension, you can use the Duration and MaxMemoryUsed CloudWatch metrics, and run different versions of your function with and without the extension. Adding more memory to a function also proportionally increases CPU and network throughput.

The function and all extensions must complete within the function’s configured timeout setting which applies to the entire invoke phase.

Conclusion

Lambda extensions enable you to extend the Lambda service to more easily integrate with your favorite tools for monitoring, observability, security, and governance.

Today, you can install a number of available extensions from AWS Lambda Ready Partners. These cover use-cases such as application performance monitoring, secrets management, configuration management, and vulnerability detection. Extensions make it easier to use your existing tools with your serverless applications.

You can also build extensions to integrate your own tooling using the new Extensions API. For more information, see the companion post “Building Extensions for AWS Lambda – In preview“.

Extensions are now available in preview in the following Regions: us-east-1, us-east-2, us-west-1, us-west-2, ca-central-1, eu-west-1, eu-west-2, eu-west-3, eu-central-1, eu-north-1, eu-south-1, sa-east-1, me-south-1, ap-northeast-1, ap-northeast-2, ap-northeast-3, ap-southeast-1, ap-southeast-2, ap-south-1, and ap-east-1.

For more serverless learning resources, visit https://serverlessland.com.

Field Notes: Building a Shared Account Structure Using AWS Organizations

Post Syndicated from Abhijit Vaidya original https://aws.amazon.com/blogs/architecture/field-notes-building-a-shared-account-structure-using-aws-organizations/

For customers considering the AWS Solution Provider Program, there are challenges to mitigate when building a shared account model with SI partners. AWS Organizations make it possible to build the right account structure to support a resale arrangement. In this engagement model, the end customer gets an AWS invoice from an AWS authorized partner instead of AWS directly.

Partners and customers who want to engage in this service resale arrangement need to build a new account structure. This process includes linking or transferring existing customer accounts to the partner master account. This is so that all the billing data from customer accounts is consolidated into the partner master account.

While linking or transferring existing customer accounts to the new master account, the partner must check the new master account structure. It should not compromise any customer security controls and continue to provide full control of linked accounts to the customer.  The new account structure must fulfill the following requirements for both the AWS customer and partner:

  • The customer maintains full access to the AWS organization and able to perform all critical security-related tasks except access to billing data.
  • The Partner is able to control only billing information and not able to perform any other task in the root account (master payer account) without approval from the customer.
  • In case of contract breach / termination, the customer is able to gain back full control of all accounts including the Master.

In this post, you will learn about how partners can create a master account with shared ownership. We also show how to link or transfer customer organization accounts to the new organization master account and set up policies that would provide appropriate access to both partner and customer.

Account Structure

The following architecture represents the account structure setup that can fulfill customer and partner requirements as a part of a service resale arrangement.

As illustrated in the preceding diagram, the following list includes the key architectural components:

Architectural Components

As a part of resale arrangement, the customer’s existing AWS organization and related accounts are linked to the partner’s master payer account. The customer can continue to maintain their existing master root account, while all child accounts are linked to the master account (as shown in the list).

Customers may have valid concerns about linking/transferring accounts to the owned master payee account and may come up with many ‘what-if’ scenarios for example “What if the partner shuts down environment/servers?”  or, “What if partner blocks access to child accounts?”.

This account structure provides the right controls to both customer and partner that would address customer concerns around the security of their accounts. This includes the following benefits:

  • Starting with access to the root account, neither customer nor partner can access the root account without the other party’s involvement.
  • The partner controls the id/password for the root account while the customer maintains the MFA token for the account. The customer also controls the phone number, security questions associated with the root account. That way, the partner cannot replace the MFA token on their own.
  • The partner only has billing access and does not control any other parts of account including child accounts. Anytime the root account access is needed, both customer and partner team need to collaborate and access the root account.
  • The customer or partner cannot assign new IAM roles to themselves, therefore protecting the initial account setup.

Security considerations in the shared account setup

The following table highlights both customer and partner responsibilities and access controls provided by the architecture in the previous section.

The following points highlight security recommendations to provide adequate access rights to both partner and customers.

  • New master payer/ root account has a joint ownership between the Partner and the Customer.
  • AWS account root users (user id/password) would be with Partner and MFA (multi-factor authentication) device with Customer.
  • IAM (AWS Identity and Access Management) role to be created under the master payer with policies “FullOrganizationAccess”, “Amazon S3” (Amazon Simple Storage Service), “CloudTrail” (AWS CloudTrail), “CloudWatch”(Amazon CloudWatch) for the Customer.
  • Security team to log in and manage security of the account. Additional permissions to be added to this role as needed in future. This role does not have ANY billing permissions.
  • Only the partner has access to AWS billing and usage data.
  • IAM role / user would be created under master payer with just billing permission for the Partner team to log in and download all invoices. This role does not have any other permissions except billing and usage reports.
  • Any root login attempts to master payer triggers a notification to Customer’s SOC team and the Partner’s Customer account management team.
  • The Partner’ email address is used to create an account so invoices can be emailed to the partner’s email. The Customer cannot see these invoices.
  • The Customer phone number is used to create a master account and the customer maintains security questions/answers. This prevents replacement of MFA token by the Partner team without informing customer.  The Customer wouldn’t need the Partner’s help or permission to login and manage any security.
  • No aspect of  the Master Payer / Root Partner team can login to the master payer/Root without the Customer providing an MFA token.

Setting up the shared master AWS account structure

Create a playbook for the account transfer activity based on the following tasks. For each task, identify the owner. Make sure that owners have the right permissions to perform the tasks.

Part I – Setting up new partner master account

  1. Create new Partner Master payee Account
  2. Update payment details section with the required details for payment in Partner Master payee Account
  3. Enable MFA in the Partner Master payee Account
  4. Update contact for security and operations in the Partner Master payee Account
  5. Update demographics -Address and contact details in Partner Master payee Account
  6. Create an IAM role for Customer Team in Partner Master Payee account. IAM role is created under master payer with “FullOrganizationAccess”, “Amazon S3”, “CloudTrail”, “CloudWatch” “CloudFormationFullAccess” for the Customer SOC team to login and manage security of the account. Additional permissions can be added to this role in future if needed.

Select the roles:

create role

7. Create an IAM role/user for Partner billing role in the Partner Master Payee account.

Part II – Setting up customer master account

1.      Create an IAM user in the customer’s master account. This user assumes role into the new master payer/root account.

aws management console


2.      Confirm that when the IAM user from the customer account assumes a role in the new master account, and that the user does not have Billing Access.

Billing and cost management dashboard

Part III – Creating an organization structure in partner account

  1. Create an Organization in the Partner Master Payee Account
  2. Create Multiple Organizational Units (OU) in the Partner Master Payee Account


3. Enable Service Control Policies from AWS Organization’s Policies menu.

service control policies

5. Create/Copy Multiple in to Partner Master Payee Account from Customer root Account.  Any service control policies from the customer root account should be manually copied to new partner account.

6. If customer root account has any special software installed for example, security, install same software in Partner Master Payee Account.

7. Set alerts in Partner Master Payee root account. Any login to the root account would send alerts to customer and partner teams.

8. It is recommended to keep a copy of all billing history invoices for all accounts to be transferred to partner organization. This could be achieved by either downloading CSV or printing all invoices and storing files in Amazon S3 for long term archival. Billing history and invoices are found by clicking Orders and Invoices on Billing & Cost Management Dashboard. After accounts are transferred to new organization, historic billing data will not be available for those accounts.

9. Remove all the Member Accounts from the current Customer Root Account/ Organization. This step is performed by customer account admin and required before account can be transferred to Partner Account organization.

10. Send an invite from the Partner Master Payee Account to the delinked Member Account

master payee account

11.      Member Accounts to accept the invite from the Partner Master Payee Account.

invitations

12.      Move the Customer member account to the appropriate OU in the Partner Master Payee Account.

Setting the shared security model between partner and customer contact

While setting up the master account, three contacts need to be updated for notification.

  • Billing –  this is owned by the Partner
  • Operations – this is owned by the Customer
  • Security – this is owned by the Customer.

This will trigger a notification of any activity on the root account. The contact details contain Name, Title, Email Address and Phone number.  It is recommended to use the Customer’s SOC team distribution email for security and operations, and a phone number that belongs to the organization, and not the individual.

Alternate contacts

Additionally, before any root account activity takes place, AWS Support will verify using the security challenge questionnaire. These questions and answers are owned by the Customer’s SOC team.

security challenge questions

If a customer is not able to access the AWS account, alternate support options are available at Contact us by expanding the “I’m an AWS customer and I’m looking for billing or account support” menu. While contacting AWS Support, all the details that are listed on the account are needed, including full name, phone number, address, email address, and the last four digits of the credit card.

Clean Up

After recovering the account, the Customer should close any accounts that are not in use. It’s a good idea not to have open accounts in your name that could result in charges. For more information, review Closing an Account in the Billing and Cost Management User Guide.

The Shared master root account should be only used for selected activities referred to in the following document.

Conclusion

In this post, you learned how AWS Organizations features can be used to create a shared master account structure.  This helps both customer and partner engage in a service resale business engagement. Using AWS Organizations and cross account access, this solution allows customers to control all key aspects of managing the AWS Organization (Security / Logging / Monitoring) and also allows partners to control any billing related data.

Additional Resources

Cross Account Access

Field Notes provides hands-on technical guidance from AWS Solutions Architects, consultants, and technical account managers, based on their experiences in the field solving real-world business problems for customers.