We all know that learning to program, and specifically learning how to debug or fix code, can be frustrating and leave beginners overwhelmed and disheartened. In a recent blog article, our PhD student Lauria at the Raspberry Pi Computing Education Research Centre highlighted the pivotal role that teachers play in shaping students’ attitudes towards debugging. But what about teachers who are coding novices themselves?
In many countries, primary school teachers are holistic educators and often find themselves teaching computing despite having little or no experience in the field. In a recent seminar of our series on computing education for primary-aged children, Luisa Greifenstein told attendees that struggling with debugging and negative attitudes towards programming were among the top ten challenges mentioned by teachers.
Luisa is a researcher at the University of Passau, Germany, and has been working closely with both teacher trainees and experienced primary school teachers in Germany. She’s found that giving feedback to students can be difficult for primary school teachers, and especially for teacher trainees, as programming is still new to them. Luisa’s seminar introduced a tool to help.
A unique approach: Visualising debugging with LitterBox
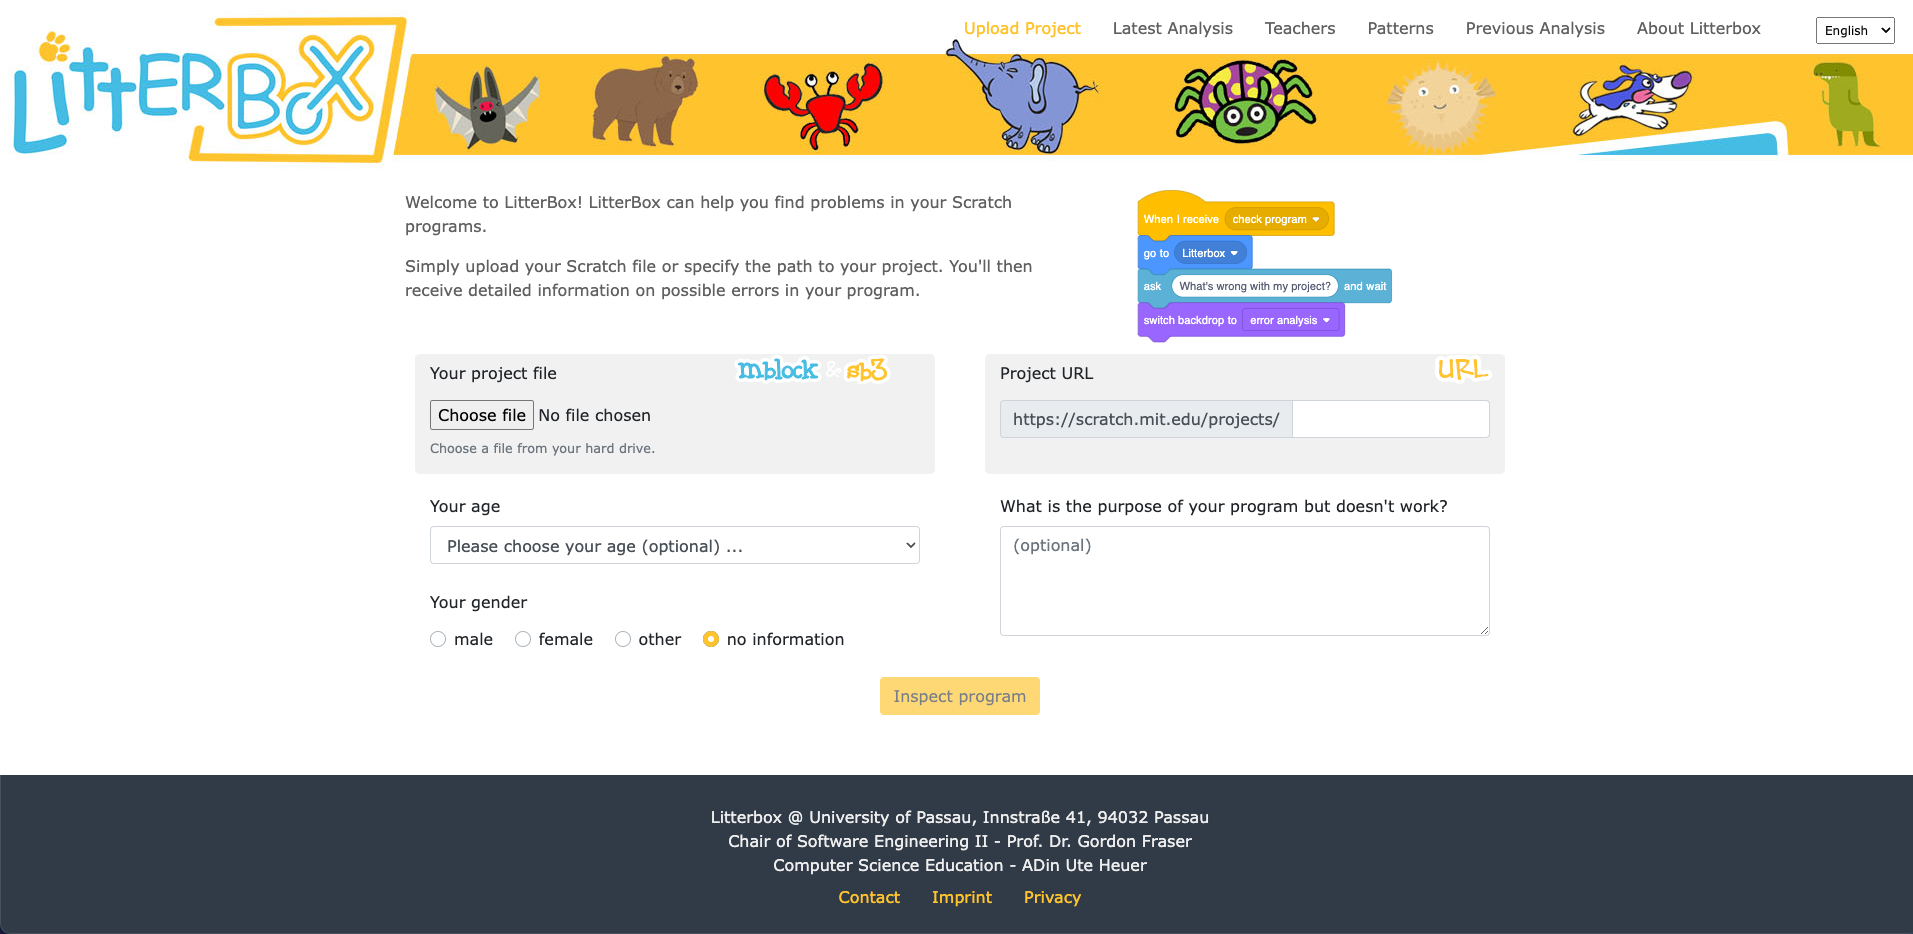
To address this issue, the University of Passau has initiated the primary::programming project. One of its flagship tools, LitterBox, offers a unique solution to debugging and is specifically designed for Scratch, a beginners’ programming language widely used in primary schools.
You can upload Scratch program files to LitterBox to analyse them. Click to enlarge.
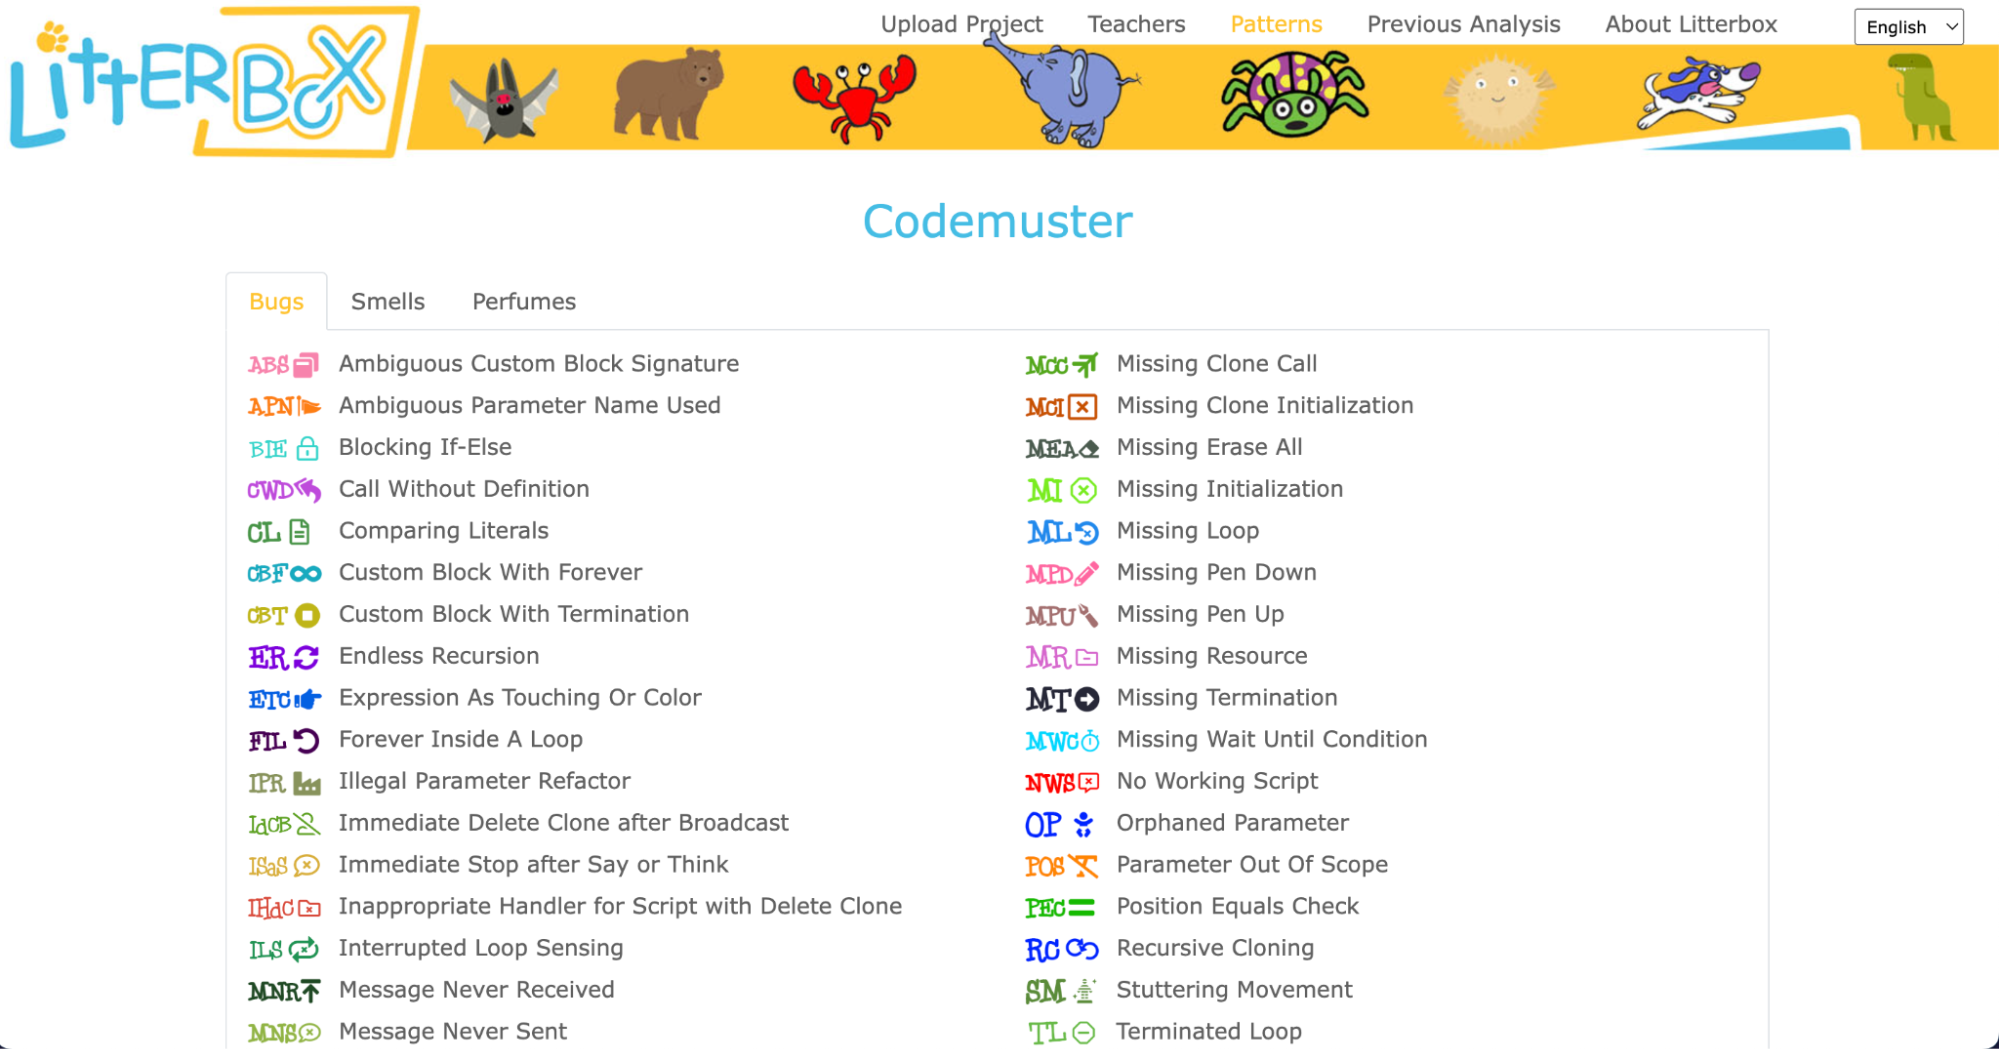
LitterBox serves as a static code debugging tool that transforms code examination into an engaging experience. With a nod to the Scratch cat, the tool visualises the debugging of Scratch code as checking the ‘litterbox’, categorising issues into ‘bugs’ and ‘smells’:
Bugs represent code patterns that have gone wrong, such as missing loops or specific blocks
Smells indicate that the code couldn’t be processed correctly because of duplications or unnecessary elements
The code patterns LitterBox recognises. Click to enlarge.
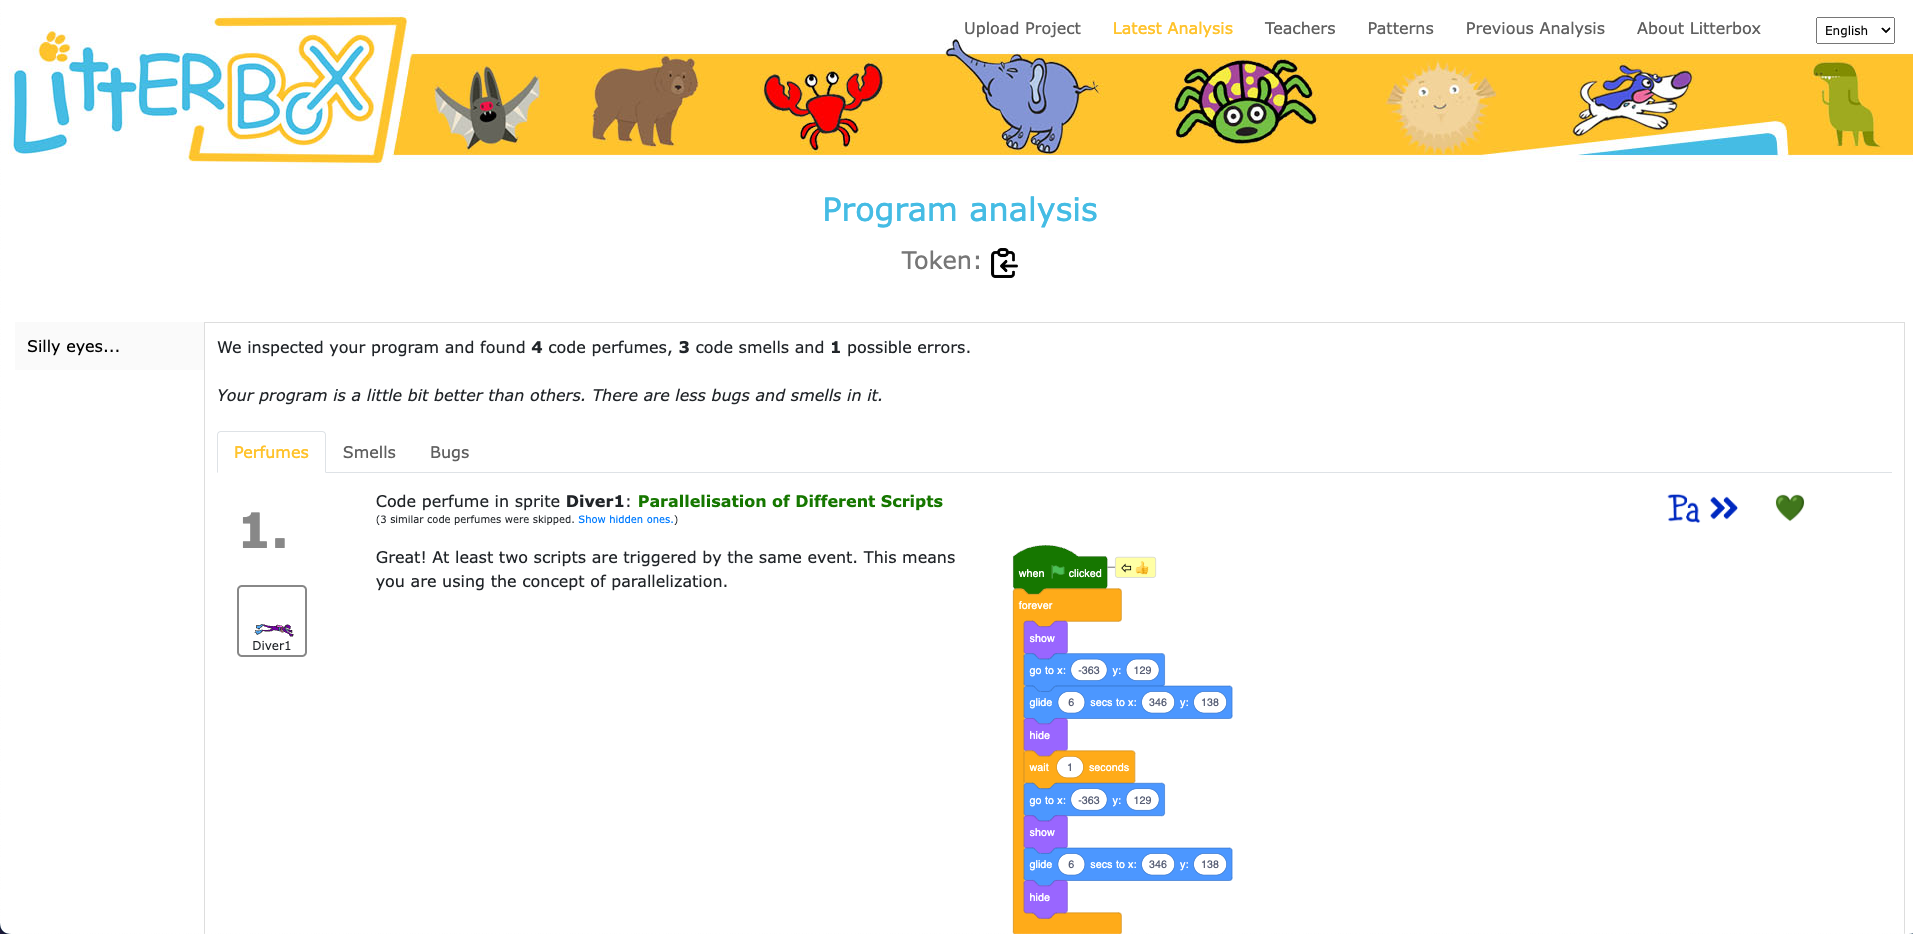
What sets LitterBox apart is that it also rewards correct code by displaying ‘perfumes’. For instance, it will praise correct broadcasting or the use of custom blocks. For every identified problem or achievement, the tool provides short and direct feedback.
LitterBox also identifies good programming practice. Click to enlarge.
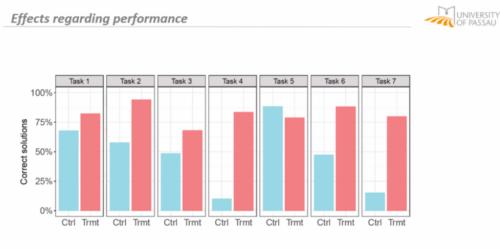
Luisa and her team conducted a study to gauge the effectiveness of LitterBox. In the study, teachers were given fictitious student code with bugs and were asked to first debug the code themselves and then explain in a manner appropriate to a student how to do the debugging.
The results were promising: teachers using LitterBox outperformed a control group with no access to the tool. However, the team also found that not all hints proved equally helpful. When hints lacked direct relevance to the code at hand, teachers found them confusing, which highlighted the importance of refining the tool’s feedback mechanisms.
Despite its limitations, LitterBox proved helpful in another important aspect of the teachers’ work: coding task creation. Novice students require structured tasks and help sheets when learning to code, and teachers often invest substantial time in developing these resources. While LitterBox does not guide educators in generating new tasks or adapting them to their students’ needs, in a second study conducted by Luisa’s team, teachers who had access to LitterBox not only received support in debugging their own code but also provided more scaffolding in task instructions they created for their students compared to teachers without LitterBox.
How to maximise the impact of new tools: use existing frameworks and materials
One important realisation that we had in the Q&A phase of Luisa’s seminar was that many different research teams are working on solutions for similar challenges, and that the impact of this research can be maximised by integrating new findings and resources. For instance, what the LitterBox tool cannot offer could be filled by:
Pedagogical frameworks to enhance teachers’ lessons and feedback structures. Frameworks such as PRIMM (Predict, Run, Investigate, Modify, and Make) or TIPP&SEE for Scratch projects (Title, Instructions, Purpose, Play & Sprites, Events, Explore) can serve as valuable resources. These frameworks provide a structured approach to lesson design and teaching methodologies, making it easier for teachers to create engaging and effective programming tasks. Additionally, by adopting semantic waves in the feedback for teachers and students, a deeper understanding of programming concepts can be fostered.
Existing courses and materials to aid task creation and adaptation. Our expert educators at the Raspberry Pi Foundation have not only created free lesson plans and courses for teachers and educators, but also dedicated non-formal learning paths for Scratch, Python, Unity, web design, and physical computing that can serve as a starting point for classroom tasks.
Exploring innovative ideas in computing education
As we navigate the evolving landscape of programming education, it’s clear that innovative tools like LitterBox can make a significant difference in the journey of both educators and students. By equipping educators with effective debugging and task creation solutions, we can create a more positive and engaging learning experience for students.
If you’re an educator, consider exploring how such tools can enhance your teaching and empower your students in their coding endeavours.
You can watch the recording of Luisa’s seminar here:
Sign up now to join our next seminar
If you’re interested in the latest developments in computing education, join us at one of our free, monthly seminars. In these sessions, researchers from all over the world share their innovative ideas and are eager to discuss them with educators and students. In our December seminar, Anaclara Gerosa (University of Edinburgh) will share her findings about how to design and structure early-years computing activities.
This will be the final seminar in our series about primary computing education. Look out for news about the theme of our 2024 seminar series, which are coming soon.
In November, 2022, we introduced deployments for Workers. Deployments are created as you make changes to a Worker. Each one is unique. These let you track changes to your Workers over time, seeing who made the changes, and where they came from.
When we made the announcement, we also said our intention was to build more functionality on top of deployments.
Today, we’re proud to release rollbacks for deployments.
Rollbacks
As nice as it would be to know that every deployment is perfect, it’s not always possible – for various reasons. Rollbacks provide a quick way to deploy past versions of a Worker – providing another layer of confidence when developing and deploying with Workers.
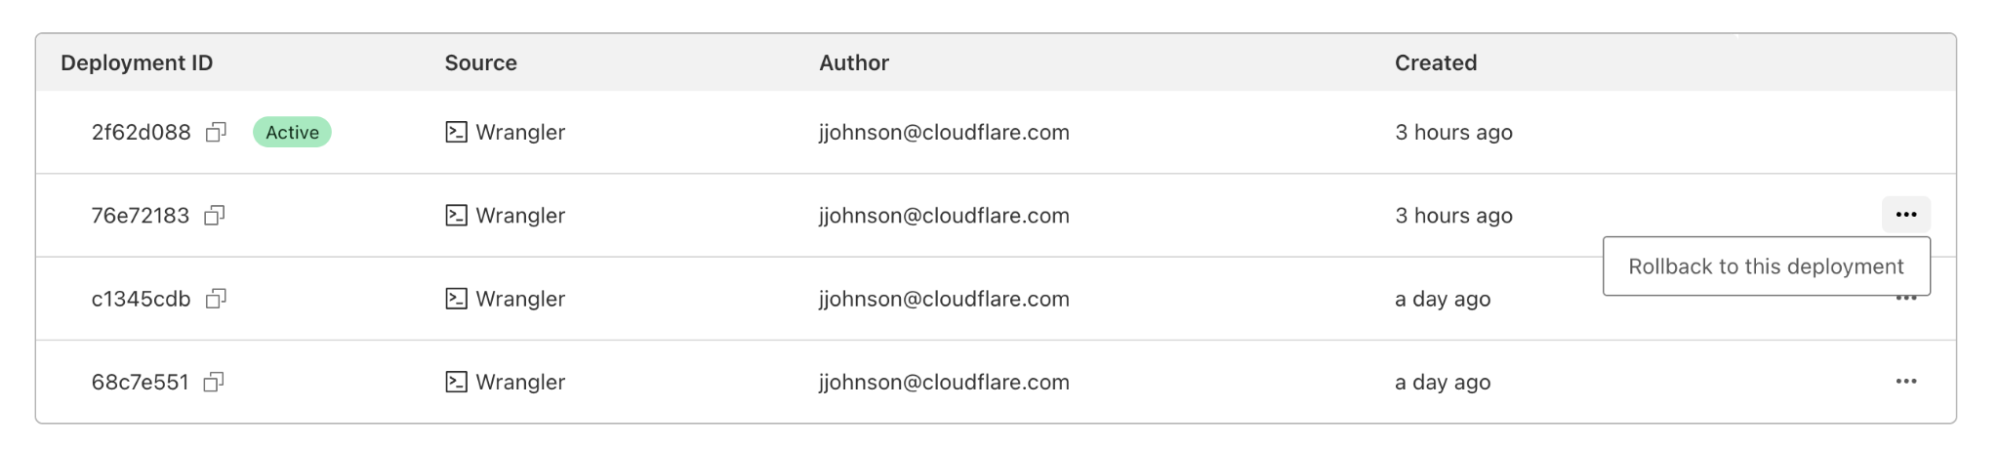
Via the dashboard
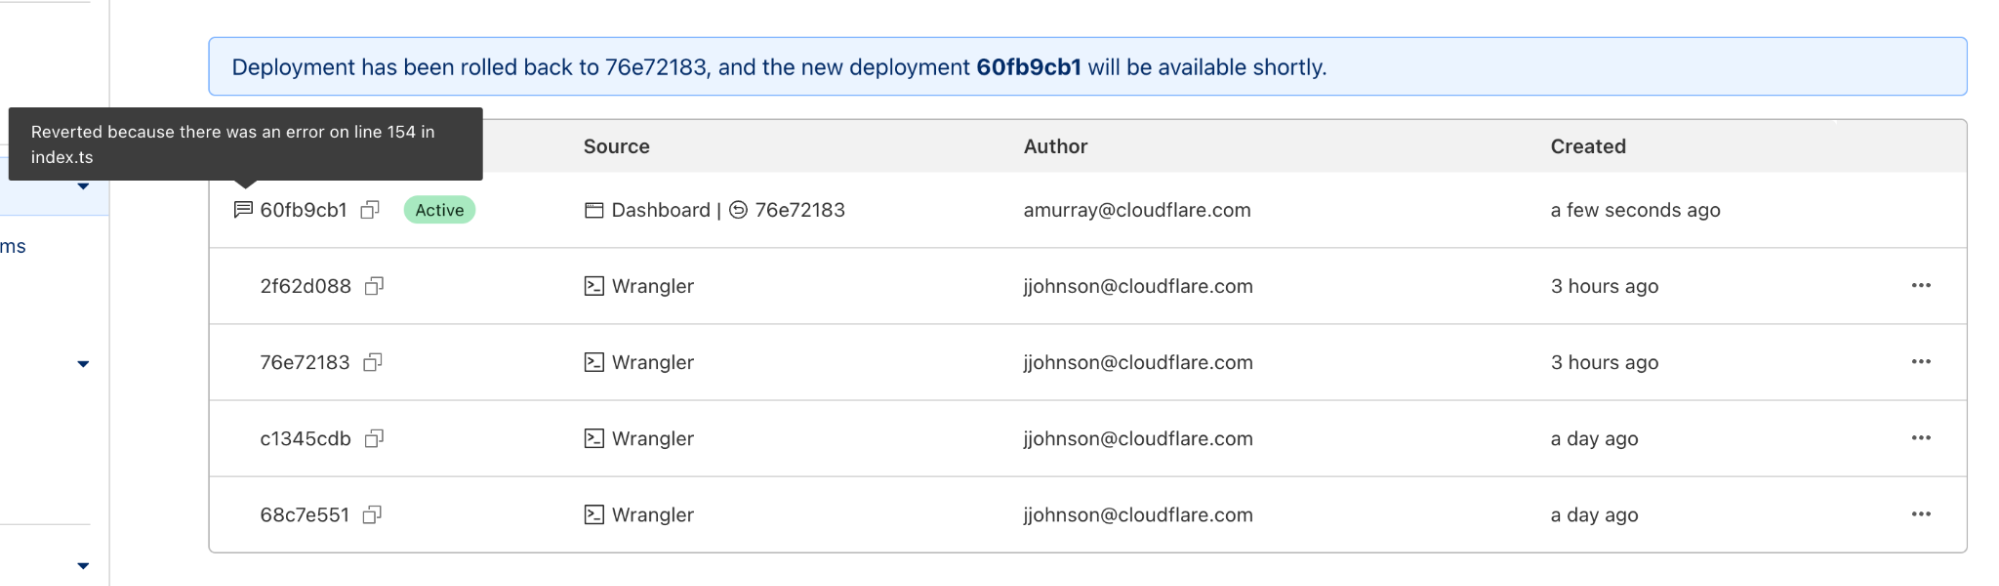
In the dashboard, you can navigate to the Deployments tab. For each deployment that’s not the most recent, you should see a new icon on the far right of the deployment. Hovering over that icon will display the option to rollback to the specified deployment.
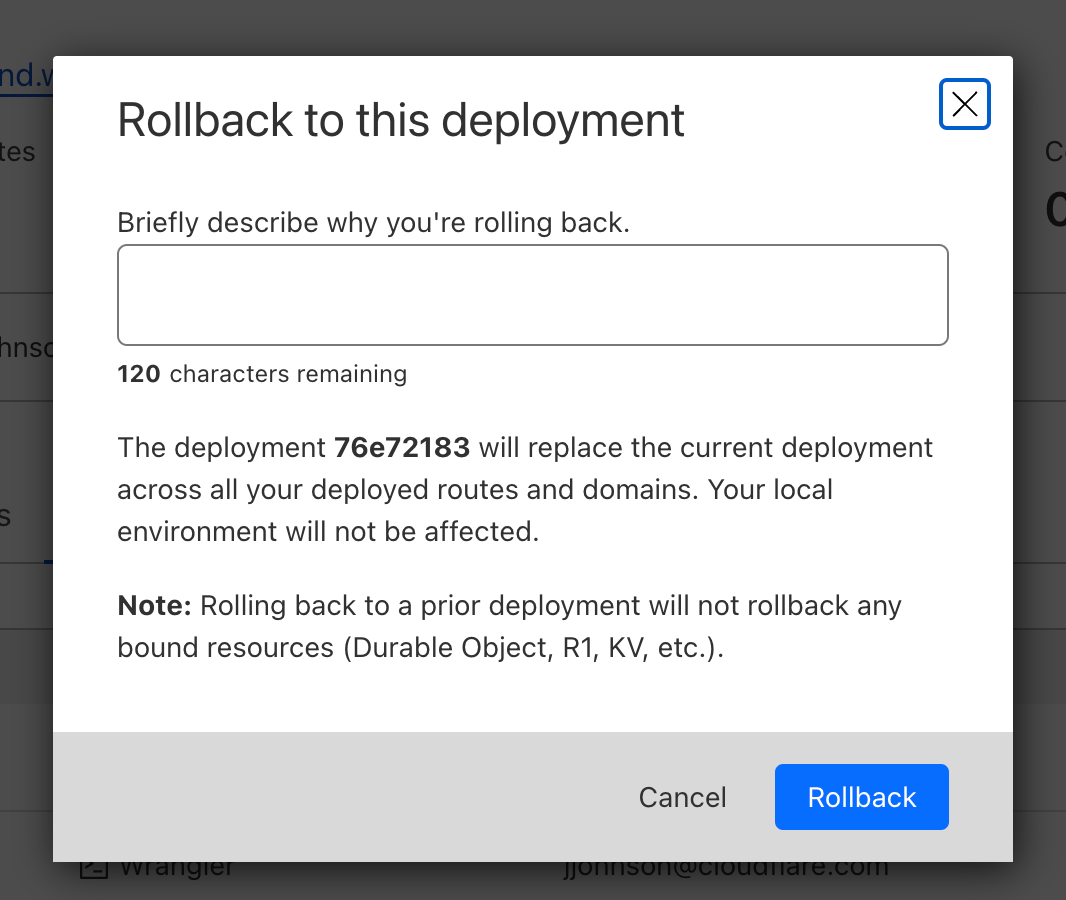
Clicking on that will bring up a confirmation dialog, where you can enter a reason for rollback. This provides another mechanism of record-keeping and helps give more context for why the rollback was necessary.
Once you enter a reason and confirm, a new rollback deployment will be created. This deployment has its own ID, but is a duplicate of the one you rolled back to. A message appears with the new deployment ID, as well as an icon showing the rollback message you entered above.
Via Wrangler
With Wrangler version 2.13, rolling back deployments via Wrangler can be done via a new command – wrangler rollback. This command takes an optional ID to rollback to a specific deployment, but can also be run without an ID to rollback to the previous deployment. This provides an even faster way to rollback in a situation where you know that the previous deployment is the one that you want.
Just like the dashboard, when you initiate a rollback you will be prompted to add a rollback reason and to confirm the action.
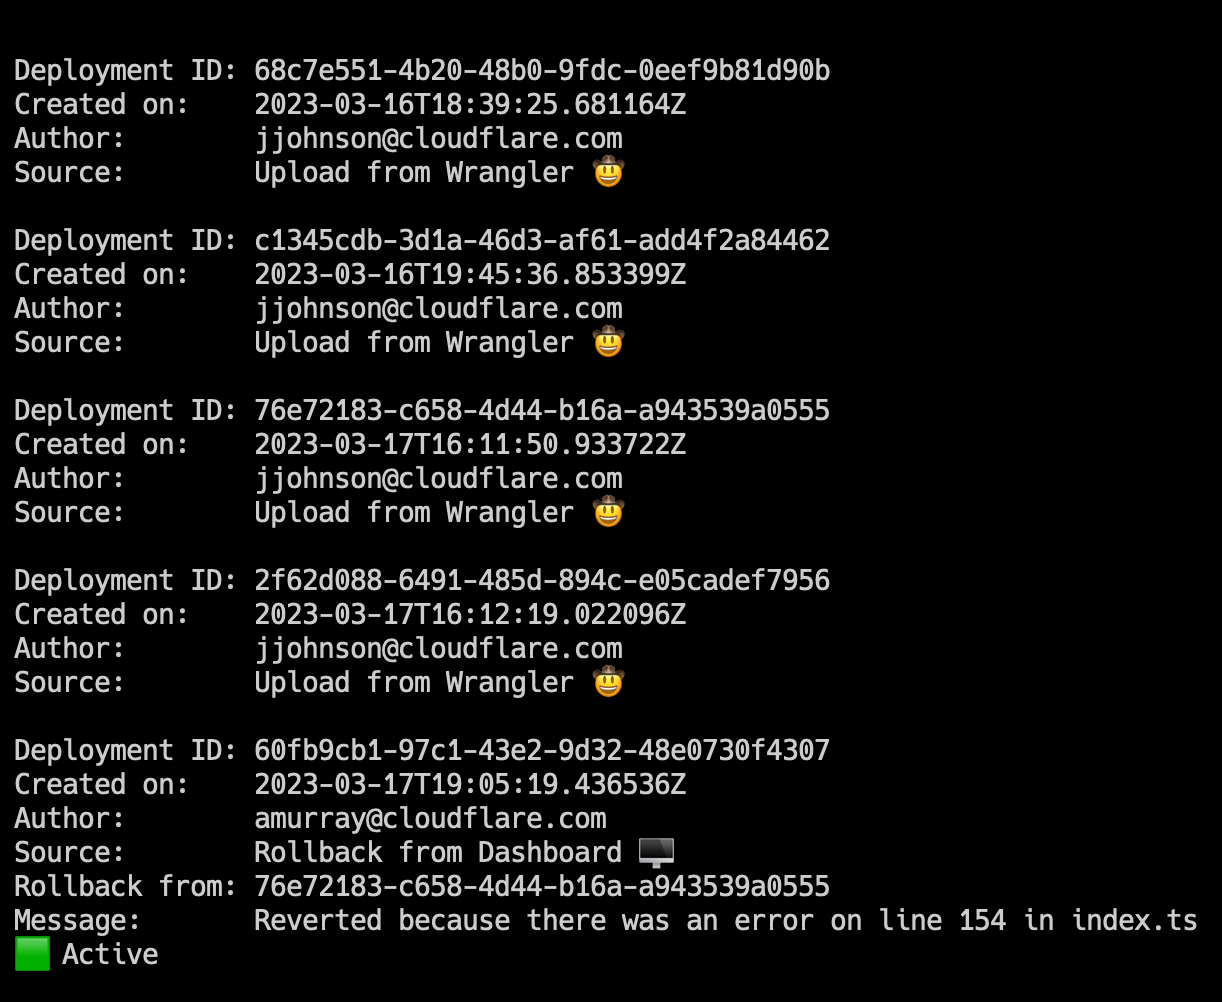
In addition to wrangler rollback we’ve done some refactoring to the wrangler deployments command. Now you can run wrangler deployments list to view up to the last 10 deployments.
Here, you can see two new annotations: rollback from and message. These match the dashboard experience, and provide more visibility into your deployment history.
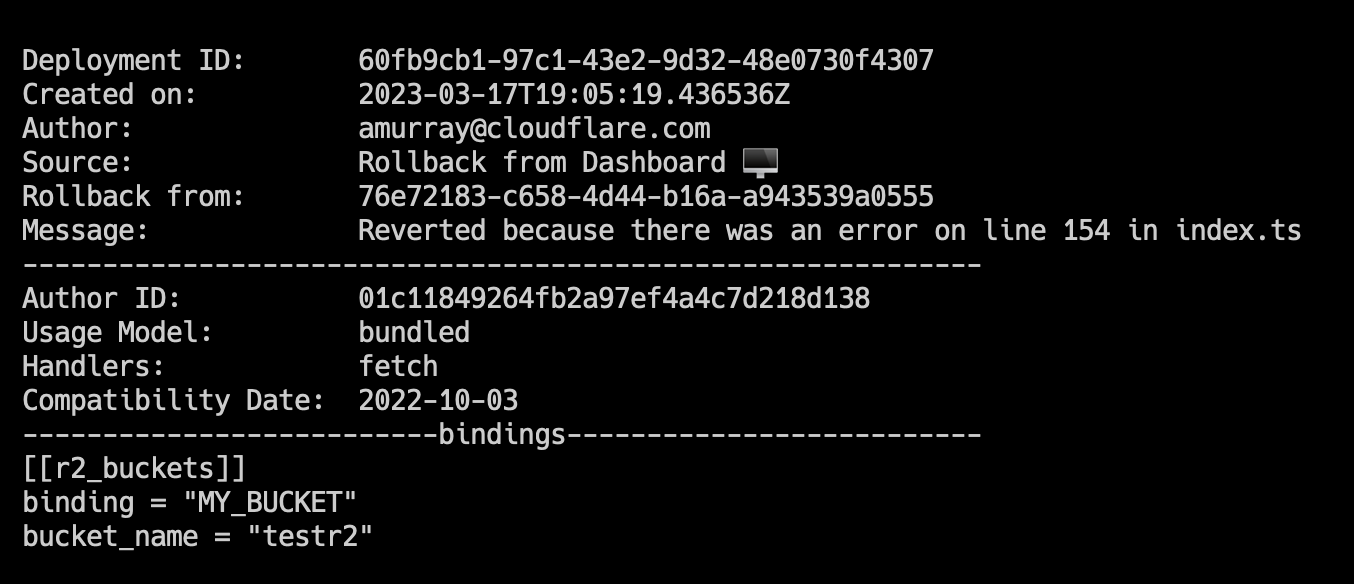
To view an individual deployment, you can run wrangler deployments view. This will display the last deployment made, which is the active deployment. If you would like to see a specific deployment, you can run wrangler deployments view [ID].
We’ve updated this command to display more data like: compatibility date, usage model, and bindings. This additional data will help you to quickly visualize changes to Worker or to see more about a specific Worker deployment without having to open your editor and go through source code.
Keep deploying!
We hope this feature provides even more confidence in deploying Workers, and encourages you to try it out! If you leverage the Cloudflare dashboard to manage deployments, you should have access immediately. Wrangler users will need to update to version 2.13 to see the new functionality.
Make sure to check out our updated deployments docs for more information, as well as information on limitations to rollbacks. If you have any feedback, please let us know via this form.
A few months ago we started getting a handful of crash reports for flowtrackd, our Advanced TCP Protection system that runs on our global network. The provided stack traces indicated that the panics occurred while parsing a TCP packet that was truncated.
What was most interesting wasn’t that we failed to parse the packet. It isn’t rare that we receive malformed packets from the Internet that are (deliberately or not) truncated. Those packets will be caught the first time we parse them and won’t make it to the latter processing stages. However, in our case, the panic occurred the second time we parsed the packet, indicating it had been truncated after we received it and successfully parsed it the first time. Both parse calls were made from a single green thread and referenced the same packet buffer in memory, and we made no attempts to mutate the packet in between.
It can be easy to dread discovering a bug like this. Is there a race condition? Is there memory corruption? Is this a kernel bug? A compiler bug? Our plan to get to the root cause of this potentially complex issue was to identify symptom(s) related to the bug, create theories on what may be occurring and create a way to test our theories or gather more information.
Before we get into the details we first need some background information about AF_XDP and our setup.
AF_XDP overview
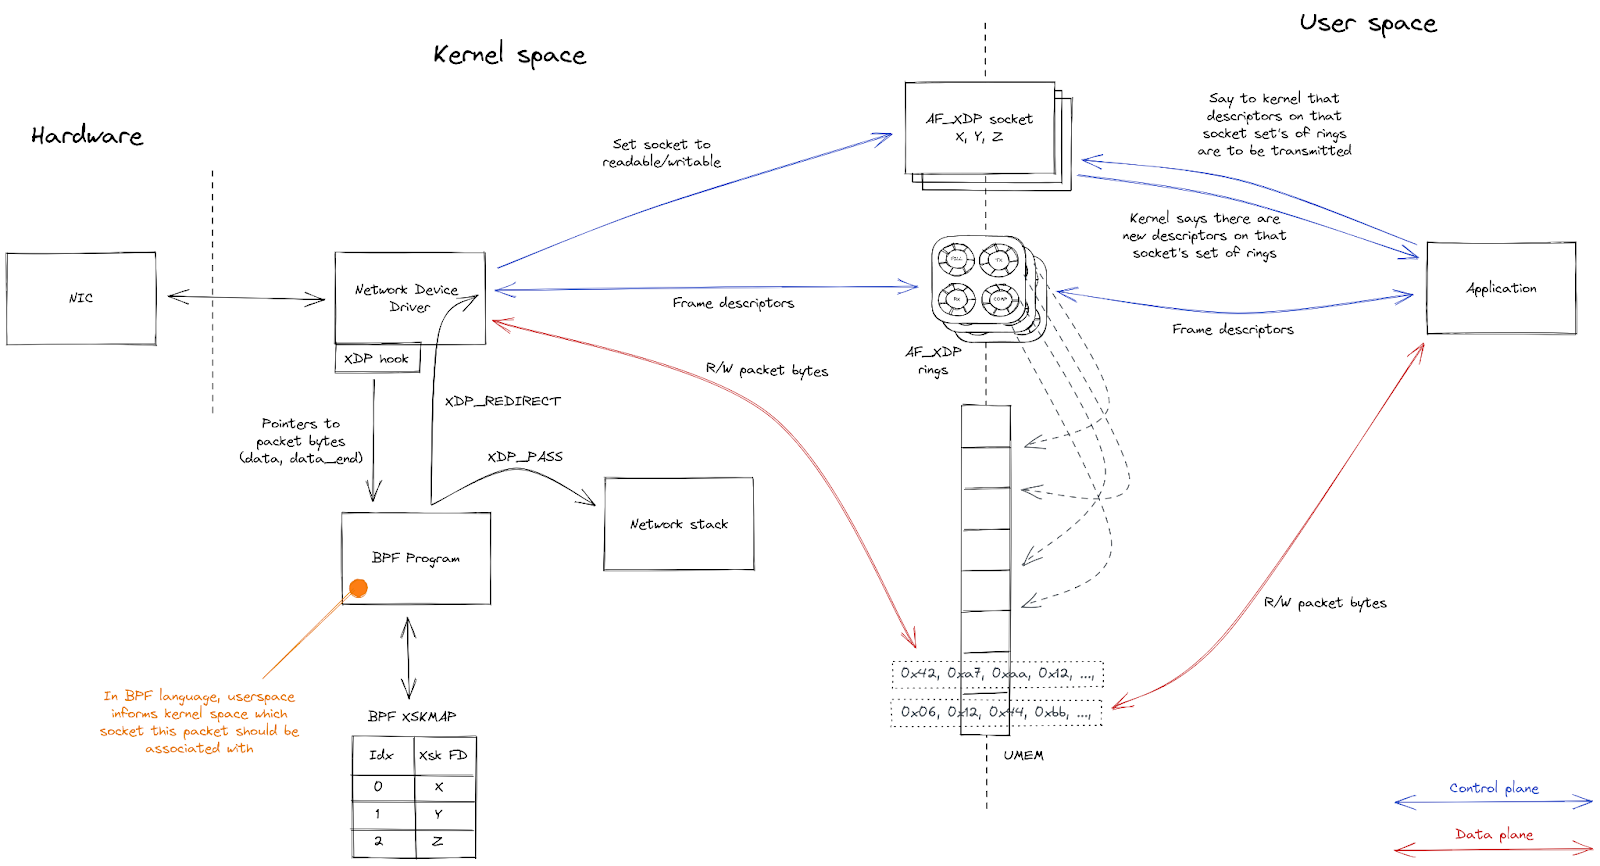
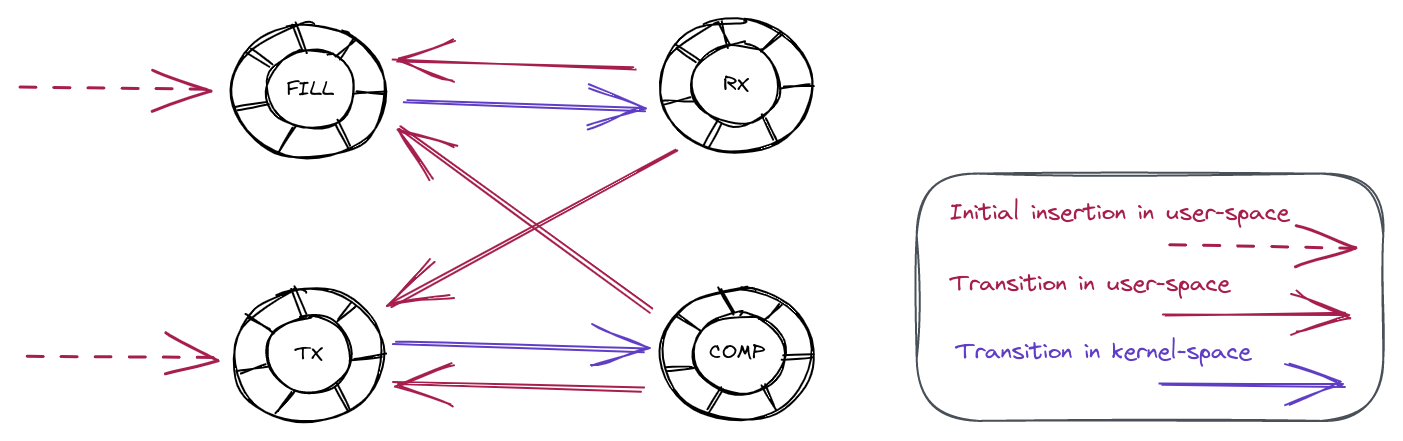
AF_XDP is the high performance asynchronous user-space networking API in the Linux kernel. For network devices that support it, AF_XDP provides a way to perform extremely fast, zero-copy packet forwarding using a memory buffer that’s shared between the kernel and a user-space application.
A number of components need to be set up by the user-space application to start interacting with the packets entering a network device using AF_XDP.
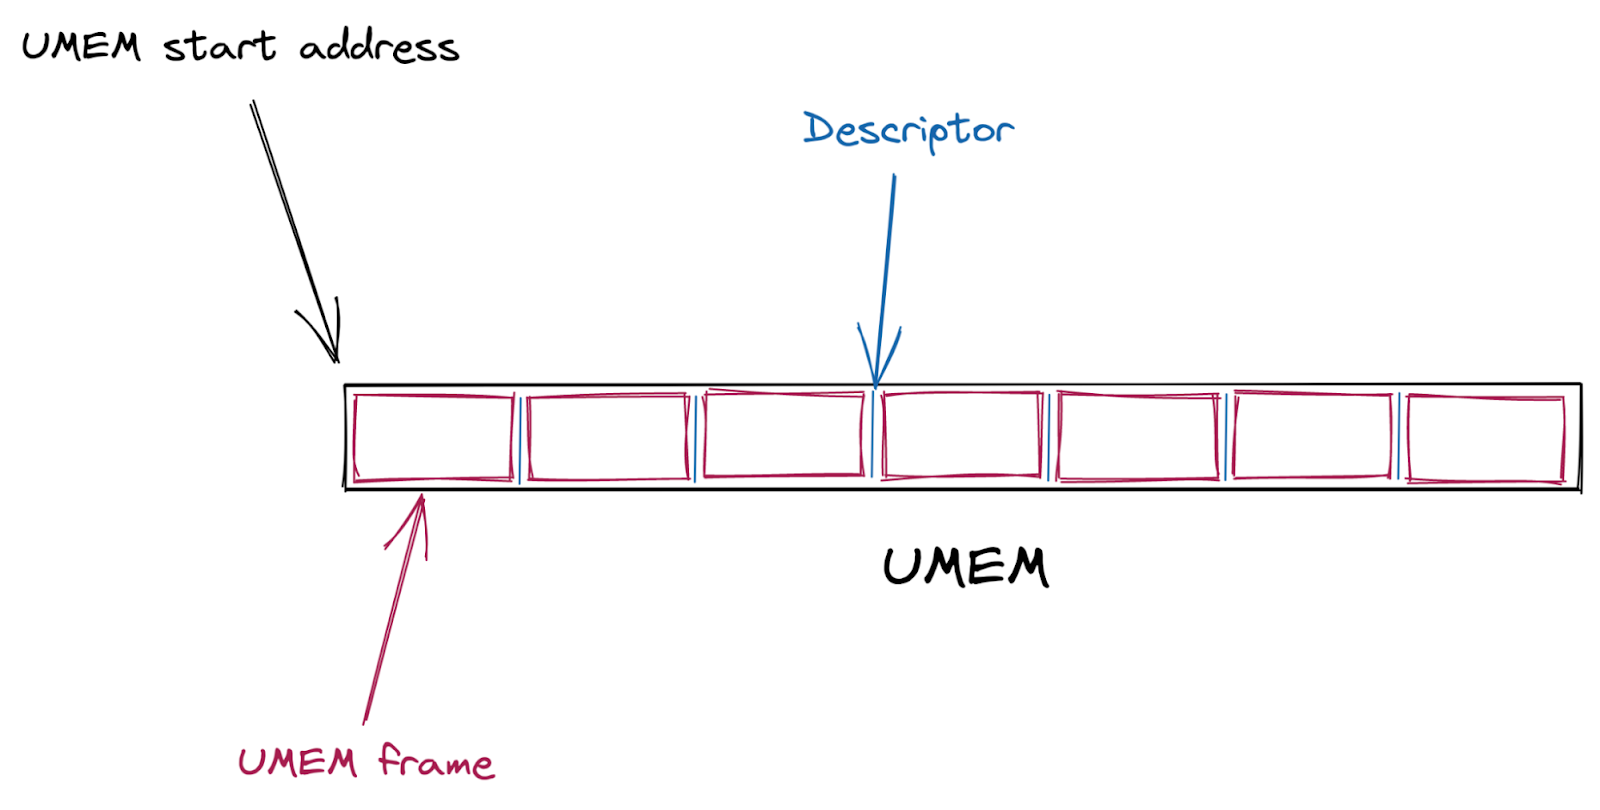
First, a shared packet buffer (UMEM) is created. This UMEM is divided into equal-sized “frames” that are referenced by a “descriptor address,” which is just the offset from the start of the UMEM.
Next, multiple AF_XDP sockets (XSKs) are created – one for each hardware queue on the network device – and bound to the UMEM. Each of these sockets provides four ring buffers (or “queues”) which are used to send descriptors back and forth between the kernel and user-space.
User-space sends packets by taking an unused descriptor and copying the packet into that descriptor (or rather, into the UMEM frame that the descriptor points to). It gives the descriptor to the kernel by enqueueing it on the TX queue. Some time later, the kernel dequeues the descriptor from the TX queue and transmits the packet that it points to out of the network device. Finally, the kernel gives the descriptor back to user-space by enqueueing it on the COMPLETION queue, so that user-space can reuse it later to send another packet.
To receive packets, user-space provides the kernel with unused descriptors by enqueueing them on the FILL queue. The kernel copies packets it receives into these unused descriptors, and then gives them to user-space by enqueueing them on the RX queue. Once user-space processes the packets it dequeues from the RX queue, it either transmits them back out of the network device by enqueueing them on the TX queue, or it gives them back to the kernel for later reuse by enqueueing them on the FILL queue.
Queue
User space
Kernel space
Content description
COMPLETION
Consumes
Produces
Descriptors containing a packet that was successfully transmitted by the kernel
FILL
Produces
Consumes
Descriptors that are empty and ready to be used by the kernel to receive packets
RX
Consumes
Produces
Descriptors containing a packet that was recently received by the kernel
TX
Produces
Consumes
Descriptors containing a packet that is ready to be transmitted by the kernel
Finally, a BPF program is attached to the network device. Its job is to direct incoming packets to whichever XSK is associated with the specific hardware queue that the packet was received on.
Here is an overview of the interactions between the kernel and user-space:
Our setup
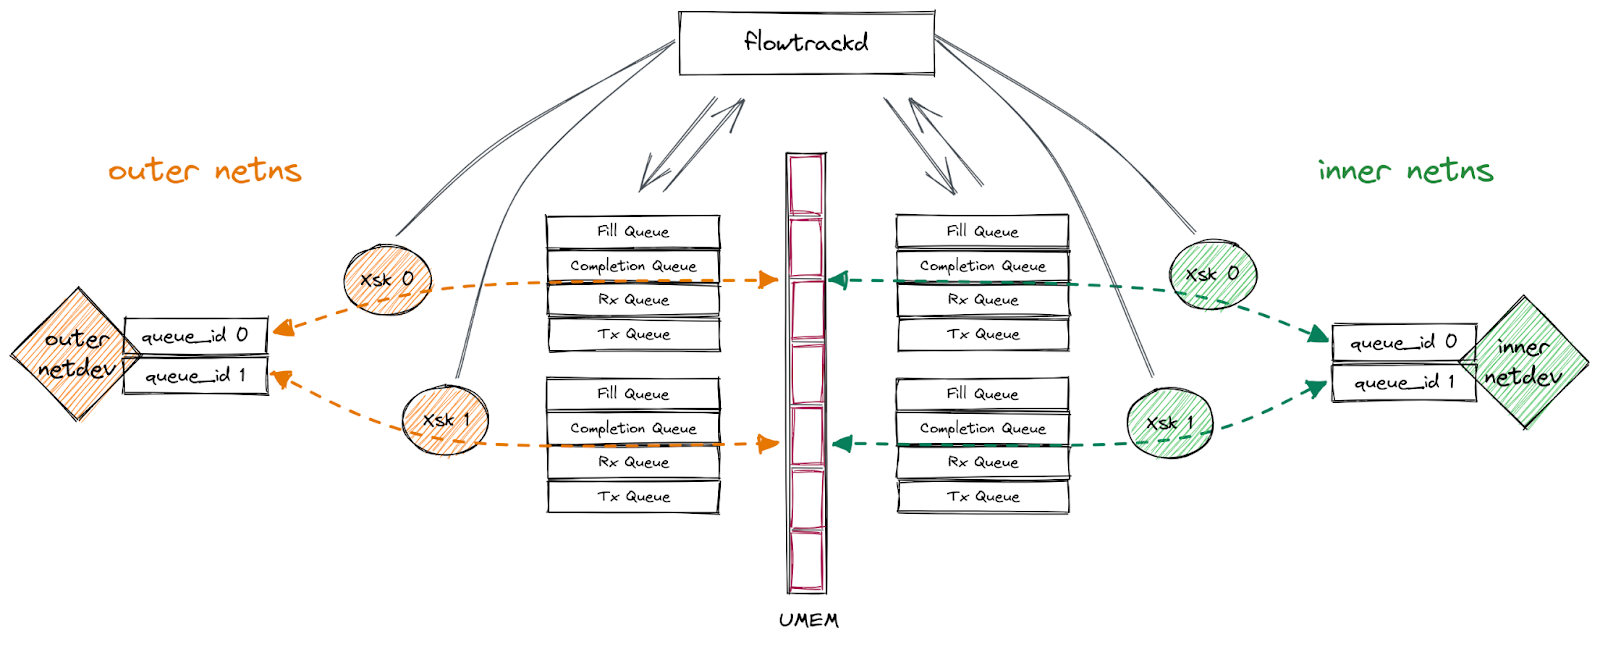
Our application uses AF_XDP on a pair of multi-queue veth interfaces (“outer” and “inner”) that are each in different network namespaces. We follow the process outlined above to bind an XSK to each of the interfaces’ queues, forward packets from one interface to the other, send packets back out of the interface they were received on, or drop them. This functionality enables us to implement bidirectional traffic inspection to perform DDoS mitigation logic.
This setup is depicted in the following diagram:
Information gathering
All we knew to start with was that our program was occasionally seeing corruption that seemed to be impossible. We didn’t know what these corrupt packets actually looked like. It was possible that their contents would reveal more details about the bug and how to reproduce it, so our first step was to log the packet bytes and discard the packet instead of panicking. We could then take the logs with packet bytes in them and create a PCAP file to analyze with Wireshark. This showed us that the packets looked mostly normal, except for Wireshark’s TCP analyzer complaining that their “IPv4 total length exceeds packet length”. In other words, the “total length” IPv4 header field said the packet should be (for example) 60 bytes long, but the packet itself was only 56 bytes long.
Lengths mismatch
Could it be possible that the number of bytes we read from the RX ring was incorrect? Let’s check.
This context structure contains two pointers (as __u32) referring to start and the end of the packet. Getting the packet length can be done by subtracting data from data_end.
If we compare that value with the one we get from the descriptors, we would surely find they are the same right?
We can use the BPF helper function bpf_xdp_adjust_meta() (since the veth driver supports it) to declare a metadata space that will hold the packet buffer length that we computed. We use it the same way this kernel sample code does.
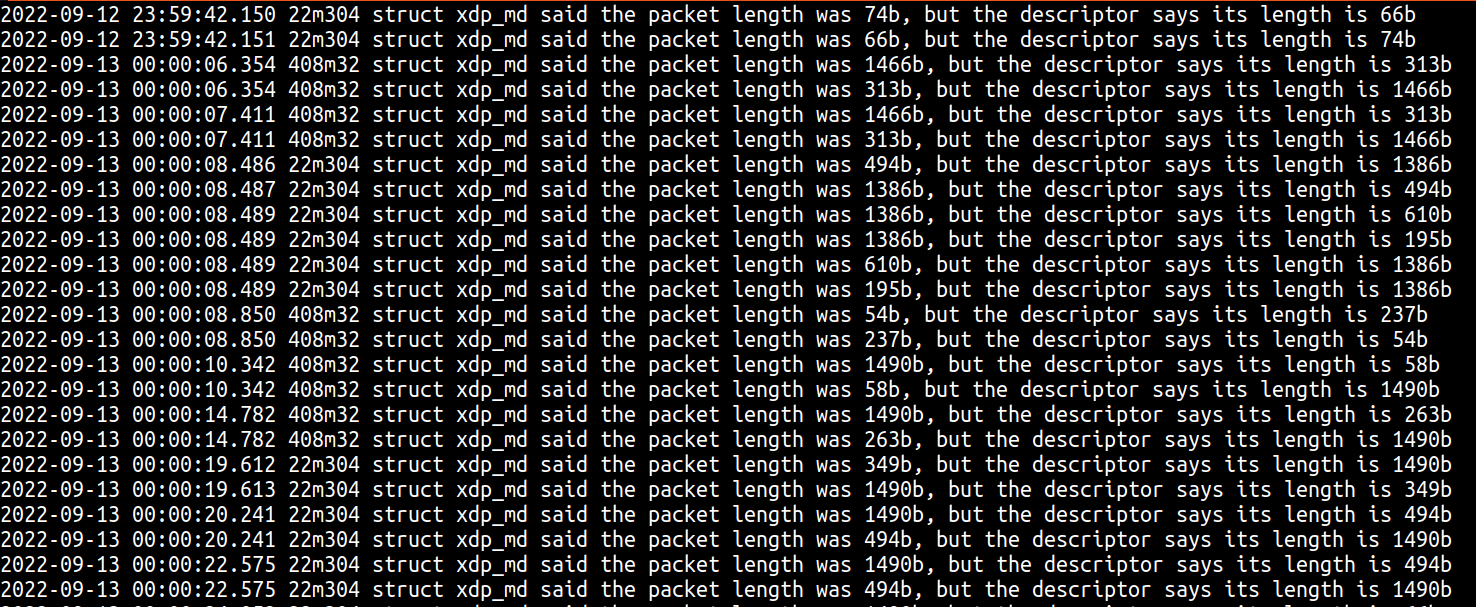
After deploying the new code in production, we saw the following lines in our logs:
Here you can see three interesting things:
As we theorized, the length of the packet when first seen in XDP doesn’t match the length present in the descriptor.
We had already observed from our truncated packet panics that sometimes the descriptor length is shorter than the actual packet length, however the prints show that sometimes the descriptor length might be larger than the real packet bytes.
These often appeared to happen in “pairs” where the XDP length and descriptor length would swap between packets.
Two packets and one buffer?
Seeing the XDP and descriptor lengths swap in “pairs” was perhaps the first lightbulb moment. Are these two different packets being written to the same buffer? This also revealed a key piece of information that we failed to add to our debug prints, the descriptor address! We took this opportunity to print additional information like the packet bytes, and to print at multiple locations in the path to see if anything changed over time.
The real key piece of information that these debug prints revealed was that not only were each swapped “pair” sharing a descriptor address, but nearly every corrupt packet on a single server was always using the same descriptor address. Here you can see 49750 corrupt packets that all used descriptor address 69837056:
This was the second lightbulb moment. Not only are we trying to copy two packets to the same buffer, but it is always the same buffer. Perhaps the problem is that this descriptor has been inserted into the AF_XDP rings twice? We tested this theory by updating our consumer code to test if a batch of descriptors read from the RX ring ever contained the same descriptor twice. This wouldn’t guarantee that the descriptor isn’t in the ring twice since there is no guarantee that the two descriptors will be in the same read batch, but we were lucky enough that it did catch the same descriptor twice in a single read proving this was our issue. In hindsight the linux kernel AF_XDP documentation points out this very issue:
Q: My packets are sometimes corrupted. What is wrong?
A: Care has to be taken not to feed the same buffer in the UMEM into more than one ring at the same time. If you for example feed the same buffer into the FILL ring and the TX ring at the same time, the NIC might receive data into the buffer at the same time it is sending it. This will cause some packets to become corrupted. Same thing goes for feeding the same buffer into the FILL rings belonging to different queue ids or netdevs bound with the XDP_SHARED_UMEM flag.
We now understand why we have corrupt packets, but we still don’t understand how a descriptor ever ends up in the AF_XDP rings twice. I would love to blame this on a kernel bug, but as the documentation points out this is more likely that we’ve placed the descriptor in the ring twice in our application. Additionally, since this is listed as a FAQ for AF_XDP we will need sufficient evidence proving that this is caused by a kernel bug and not user error before reporting to the kernel mailing list(s).
Tracking descriptor transitions
Auditing our application code did not show any obvious location where we might be inserting the same descriptor address into either the FILL or TX ring twice. We do however know that descriptors transition through a set of known states, and we could track those transitions with a state machine. The below diagram shows all the possible valid transitions:
For example, a descriptor going from the RX ring to either the FILL or the TX ring is a perfectly valid transition. On the other hand, a descriptor going from the FILL ring to the COMP ring is an invalid transition.
To test the validity of the descriptor transitions, we added code to track their membership across the rings. This produced some of the following log messages:
Nov 16 23:49:01 fuzzer4 flowtrackd[45807]: thread 'flowtrackd-ZrBh' panicked at 'descriptor 26476800 transitioned from Fill to Tx'
Nov 17 02:09:01 fuzzer4 flowtrackd[45926]: thread 'flowtrackd-Ay0i' panicked at 'descriptor 18422016 transitioned from Comp to Rx'
Nov 29 10:52:08 fuzzer4 flowtrackd[83849]: thread 'flowtrackd-5UYF' panicked at 'descriptor 3154176 transitioned from Tx to Rx'
The first print shows a descriptor was put on the FILL ring and transitioned directly to the TX ring without being read from the RX ring first. This appears to hint at a bug in our application, perhaps indicating that our application duplicates the descriptor putting one copy in the FILL ring and the other copy in the TX ring.
The second invalid transition happened for a descriptor moving from the COMP ring to the RX ring without being put first on the FILL ring. This appears to hint at a kernel bug, perhaps indicating that the kernel duplicated a descriptor and put it both in the COMP ring and the RX ring.
The third invalid transition was from the TX to the RX ring without going through the FILL or COMP ring first. This seems like an extended case of the previous COMP to RX transition and again hints at a possible kernel bug.
Confused by the results we double-checked our tracking code and attempted to find any possible way our application could duplicate a descriptor putting it both in the FILL and TX rings. With no bugs found we felt we needed to gather more information.
Using ftrace as a “flight recorder”
While using a state machine to catch invalid descriptor transitions was able to catch these cases, it still lacked a number of important details which might help track down the ultimate cause of the bug. We still didn’t know if the bug was a kernel issue or an application issue. Confusingly the transition states seemed to indicate it was both.
To gather some more information we ideally wanted to be able to track the history of a descriptor. Since we were using a shared UMEM a descriptor could in theory transition between interfaces, and receive queues. Additionally, our application uses a single green thread to handle each XSK, so it might be interesting to track those descriptor transitions by XSK, CPU, and thread. A simple but unscalable way to achieve this would be to simply print this information at every transition point. This of course is not really an option for a production environment that needs to be able to process millions of packets per second. Both the amount of data produced and the overhead of printing that information will not work.
Up to this point we had been carefully debugging this issue in production systems. The issue was rare enough that even with our large production deployment it might take a day for some production machines to start to display the issue. If we did want to explore more resource intensive debugging techniques we needed to see if we could reproduce this in a test environment. For this we created 10 virtual machines that were continuously load testing our application with iperf. Fortunately with this setup we were able to reproduce the issue about once a day, giving us some more freedom to try some more resource intensive debugging techniques.
Even using a virtual machine it still doesn’t scale to print logs at every descriptor transition, but do you really need to see every transition? In theory the most interesting events are the events right before the bug occurs. We could build something that internally keeps a log of the last N events and only dump that log when the bug occurs. Something like a black box flight recorder used in airplanes to track the events leading up to a crash. Fortunately for us, we don’t really need to build this, and instead can use the Linux kernel’s ftrace feature, which has some additional features that might help us ultimately track down the cause of this bug.
ftrace is a kernel feature that operates by internally keeping a set of per-CPU ring buffers of trace events. Each event stored in the ring buffer is time-stamped and contains some additional information about the context where the event occurred, the CPU, and what process or thread was running at the time of the event. Since these events are stored in per-CPU ring buffers, once the ring is full, new events will overwrite the oldest events leaving a log of the most recent events on that CPU. Effectively we have our flight recorder that we desired, all we need to do is add our events to the ftrace ring buffers and disable tracing when the bug occurs.
ftrace is controlled using virtual files in the debugfs filesystem. Tracing can be enabled and disabled by writing either a 1 or a 0 to:
/sys/kernel/debug/tracing/tracing_on
We can update our application to insert our own events into the tracing ring buffer by writing our messages into the trace_marker file:
/sys/kernel/debug/tracing/trace_marker
And finally after we’ve reproduced the bug and our application has disabled tracing we can extract the contents of all the ring buffers into a single trace file by reading the trace file:
/sys/kernel/debug/tracing/trace
It is worth noting that writing messages to the trace_marker virtual file still involves making a system call and copying your message into the ring buffers. This can still add overhead and in our case where we are logging several prints per packet that overhead might be significant. Additionally, ftrace is a systemwide kernel tracing feature, so you may need to either adjust the permissions of virtual files, or run your application with the appropriate permissions.
There is of course one more big advantage of using ftrace to assist in debugging this issue. As shown above we can log or own application messages to ftrace using the trace_marker file, but at its core ftrace is a kernel tracing feature. This means that we can additionally use ftrace to log events from the kernel side of the AF_XDP packet processing. There are several ways to do this, but for our purposes we used kprobes so that we could target very specific lines of code and print some variables. kprobes can be created directly in ftrace, but I find it easier to create them using the “perf probe” command of perf tool in Linux. Using the “-L” and “-V” arguments you can find which lines of a function can be probed and which variables can be viewed at those probe points. Finally, you can add the probe with the “-a” argument. For example after examining the kernel code we insert the following probe in the receive path of a XSK:
perf probe -a '__xsk_rcv_zc:7 addr len xs xs->pool->fq xs->dev'
This will probe line 7 of __xsk_rcv_zc() and print the descriptor address, the packet length, the XSK address, the fill queue address and the net device address. For context here is what __xsk_rcv_zc() looks like from the perf probe command:
In our case line 7 is the call to xskq_prod_reserve_desc(). At this point in the code the kernel has already removed a descriptor from the FILL queue and copied a packet into that descriptor. The call to xsk_prod_reserve_desc() will ensure that there is space in the RX queue, and if there is space will add that descriptor to the RX queue. It is important to note that while xskq_prod_reserve_desc() will put the descriptor in the RX queue it does not update the producer pointer of the RX ring or notify the XSK that packets are ready to be read because the kernel tries to batch these operations.
Similarly, we wanted to place a probe in the transmit path on the kernel side and ultimately placed the following probe:
perf probe -a 'xp_raw_get_data:0 addr'
There isn’t much interesting to show here in the code, but this probe is placed at a location where descriptors have been removed from the TX queue but have not yet been put in the COMPLETION queue.
In both of these probes it would have been nice to put the probes at the earliest location where descriptors were added or removed from the XSK queues, and to print as much information as possible at these locations. However, in practice the locations where kprobes can be placed and the variables available at those locations limits what can be seen.
With the probes created we still need to enable them to be seen in ftrace. This can be done with:
With our application updated to trace the transition of every descriptor and stop tracing when an invalid transition occurred we were ready to test again.
Tracking descriptor state is not enough
Unfortunately our initial test of our “flight recorder” didn’t immediately tell us anything new. Instead, it mostly confirmed what we already knew, which was that somehow we would end up in a state with the same descriptor twice. It also highlighted the fact that catching an invalid descriptor transition doesn’t mean you have caught the earliest point where the duplicate descriptor appeared. For example assume we have our descriptor A and our duplicate A’. If these are already both present in the FILL queue it is perfectly valid to:
RX A -> FILL A RX A’ -> FILL A’
This can occur for many cycles, before an invalid transition eventually occurs when both descriptors are seen either in the same batch or between queues.
Instead, we needed to rethink our approach. We knew that the kernel removes descriptors from the FILL queue, fills them, and places them in the RX queue. This means that for any given XSK the order that descriptors are inserted into the FILL queue should match the order that they come out of the RX queue. If a descriptor was ever duplicated in this kernel RX path we should see the duplicate descriptor appear out-of-order. With this in mind we updated our application to independently track the order of the FILL queue using a double ended queue. As our application puts descriptors into the FILL queue we also push the descriptor address into the tail of our tracking queue and when we receive packets we pop the descriptor address from the head of our tracking queue and ensure the address matches. If it ever doesn’t match we again can log to trace_marker and stop ftrace.
Below is the end of the first trace we captured with the updated code tracking the order of the FILL to RX queues. The color has been added to improve readability:
Here you can see the power of our ftrace flight recorder. For example, we can follow the full cycle of descriptor 0x16ce900 as it is first received in the kernel, received by our application which forwards the packet by adding to the TX queue, the kernel transmitting, and finally our application receiving the completion and placing the descriptor back in the FILL queue.
The trace starts to get interesting on the next two packets received by the kernel. We can see 0x160a100 received first in the kernel and then by our application. However things go wrong when the kernel receives 0x13d3900 but our application receives 0x1229100. The last print of the trace shows the result of our descriptor order tracking. We can see that the kernel side appears to match our next expected descriptor and the next two descriptors, yet unexpectedly we see 0x1229100 arrive out of nowhere. We do think that the descriptor is present in the FILL queue, but it is much further down the line in the queue. Another potentially interesting detail is that between 0x160a100 and 0x13d3900 the kernel’s softirq switches from CPU 1 to CPU 2.
If you recall, our __xsk_rcv_zc_L7 kprobe was placed on the call to xskq_prod_reserve_desc() which adds the descriptor to the RX queue. Below we can examine that function to see if there are any clues on how the descriptor address received by our application could be different from what we think should have been inserted by the kernel.
Here you can see that the queue’s cached_prod pointer is incremented first before we update the descriptor address and length. As the name implies the cached_prod pointer isn’t the actual producer pointer which means that at some point xsk_flush() must be called to sync the cached_prod pointer and the prod pointer to actually expose the newly received descriptors to user-mode. Perhaps there is a race where xsk_flush() is called after updating the cached_prod pointer, but before the actual descriptor address has been updated in the ring? If this were to occur our application would see the old descriptor address from that slot in the RX queue and would cause us to “duplicate” that descriptor.
We can test our theory by making two more changes. First we can update our application to write back a known “poisoned” descriptor address to each RX queue slot after we have received a packet. In this case we chose 0xdeadbeefdeadbeef as our known invalid address and if we ever receive this value back out of the RX queue we know a race has occurred and exposed an uninitialized descriptor. The second change we can make is to add a kprobe on xsk_flush() to see if we can actually capture the race in the trace.
Here we appear to have our smoking gun. As we predicted we can see that xsk_flush() is called on CPU 0 while a softirq is currently in progress on CPU 2. After the flush our application sees the expected 0xff0900 filled in from the softirq on CPU 0, and then 0xdeadbeefdeadbeef which is our poisoned uninitialized descriptor address.
We now have evidence that the following order of operations is happening:
CPU 2                                                   CPU 0
-----------------------------------                     --------------------------------
__xsk_rcv_zc(struct xdp_sock *xs):                      xsk_flush(struct xdp_sock *xs):

idx = xs->rx->cached_prod++ & xs->rx->ring_mask;
                                                        // Flush the cached pointer as the new head pointer of
                                                        // the RX ring.
                                                        smp_store_release(&xs->rx->ring->producer, xs->rx->cached_prod);

                                                        // Notify user-side that new descriptors have been produced to
                                                        // the RX ring.
                                                        sock_def_readable(&xs->sk);

                                                        // flowtrackd reads a descriptor "too soon" where the addr
                                                        // and/or len fields have not yet been updated.
xs->rx->ring->desc[idx].addr = addr;
xs->rx->ring->desc[idx].len = len;
The AF_XDP documentation states that: “All rings are single-producer/single-consumer, so the user-space application needs explicit synchronization of multiple processes/threads are reading/writing to them.” The explicit synchronization requirement must also apply on the kernel side. How can two operations on the RX ring of a socket run at the same time?
On Linux, a mechanism called NAPI prevents CPU interrupts from occurring every time a packet is received by the network interface. It instructs the network driver to process a certain amount of packets at a frequent interval. For the veth driver that polling function is called veth_poll, and it is registered as the function handler for each queue of the XDP enabled network device. A NAPI-compliant network driver provides the guarantee that the processing of the packets tied to a NAPI context (struct napi_struct *napi) will not be happening at the same time on multiple processors. In our case, a NAPI context exists for each queue of the device which means per AF_XDP socket and their associated set of ring buffers (RX, TX, FILL, COMPLETION).
static int veth_poll(struct napi_struct *napi, int budget)
{
	struct veth_rq *rq =
		container_of(napi, struct veth_rq, xdp_napi);
	struct veth_stats stats = {};
	struct veth_xdp_tx_bq bq;
	int done;

	bq.count = 0;

	xdp_set_return_frame_no_direct();
	done = veth_xdp_rcv(rq, budget, &bq, &stats);

	if (done < budget && napi_complete_done(napi, done)) {
		/* Write rx_notify_masked before reading ptr_ring */
		smp_store_mb(rq->rx_notify_masked, false);
		if (unlikely(!__ptr_ring_empty(&rq->xdp_ring))) {
			if (napi_schedule_prep(&rq->xdp_napi)) {
				WRITE_ONCE(rq->rx_notify_masked, true);
				__napi_schedule(&rq->xdp_napi);
			}
		}
	}

	if (stats.xdp_tx > 0)
		veth_xdp_flush(rq, &bq);
	if (stats.xdp_redirect > 0)
		xdp_do_flush();
	xdp_clear_return_frame_no_direct();

	return done;
}
veth_xdp_rcv() processes as many packets as the budget variable is set to, marks the NAPI processing as complete, potentially reschedules a NAPI polling, and then, calls xdp_do_flush(), breaking the NAPI guarantee cited above. After the call to napi_complete_done(), any CPU is free to execute the veth_poll() function before all the flush operations of the previous call are complete, allowing the race on the RX ring.
The race condition can be fixed by completing all the packet processing before signaling the NAPI poll as complete. The patch as well as the discussion on the kernel mailing list that lead to the fix are available here: [PATCH] veth: Fix race with AF_XDP exposing old or uninitialized descriptors. The patch was recently merged upstream.
Conclusion
We’ve found and fixed a race condition in the Linux virtual ethernet (veth) driver that was corrupting packets for AF_XDP enabled devices!
This issue was a tough one to find (and to reproduce) but logical iterations lead us all the way down to the internals of the Linux kernel where we saw that a few lines of code were not executed in the correct order.
A rigorous methodology and the knowledge of the right debugging tools are essential to go about tracking down the root cause of potentially complex bugs.
This was important for us to fix because while TCP was designed to recover from occasional packet drops, randomly dropping legitimate packets slightly increased the latency of connection establishments and data transfers across our network.
Interested about other deep dive kernel debugging journeys? Read more of them on our blog!
Market-Store is an in-house developed general purpose feature store that is used to serve real-time computed machine learning (ML) features. Market-Store has a stringent SLA around latency, throughput, and availability as it empowers ML models, which are used in Dynamic Pricing and Consumer Experience.
Problem
As Grab continues to grow, introducing new ML models and handling increased traffic, Market-Store started to experience high latency. Market-Store’s SLA states that 99% of transactions should be within 200ms, but our latency increased to 2 seconds. This affected the availability and accuracy of our models that rely on Market-Store for real-time features.
Latency Issue
We used different metrics and logs to debug the latency issue but could not find any abnormalities that directly correlated to the API’s performance. We discovered that the problem went away temporarily when we restarted the service. But during the next peak period, the service began to struggle once again and the problem became more prominent as Market-Store’s query per second (QPS) increased.
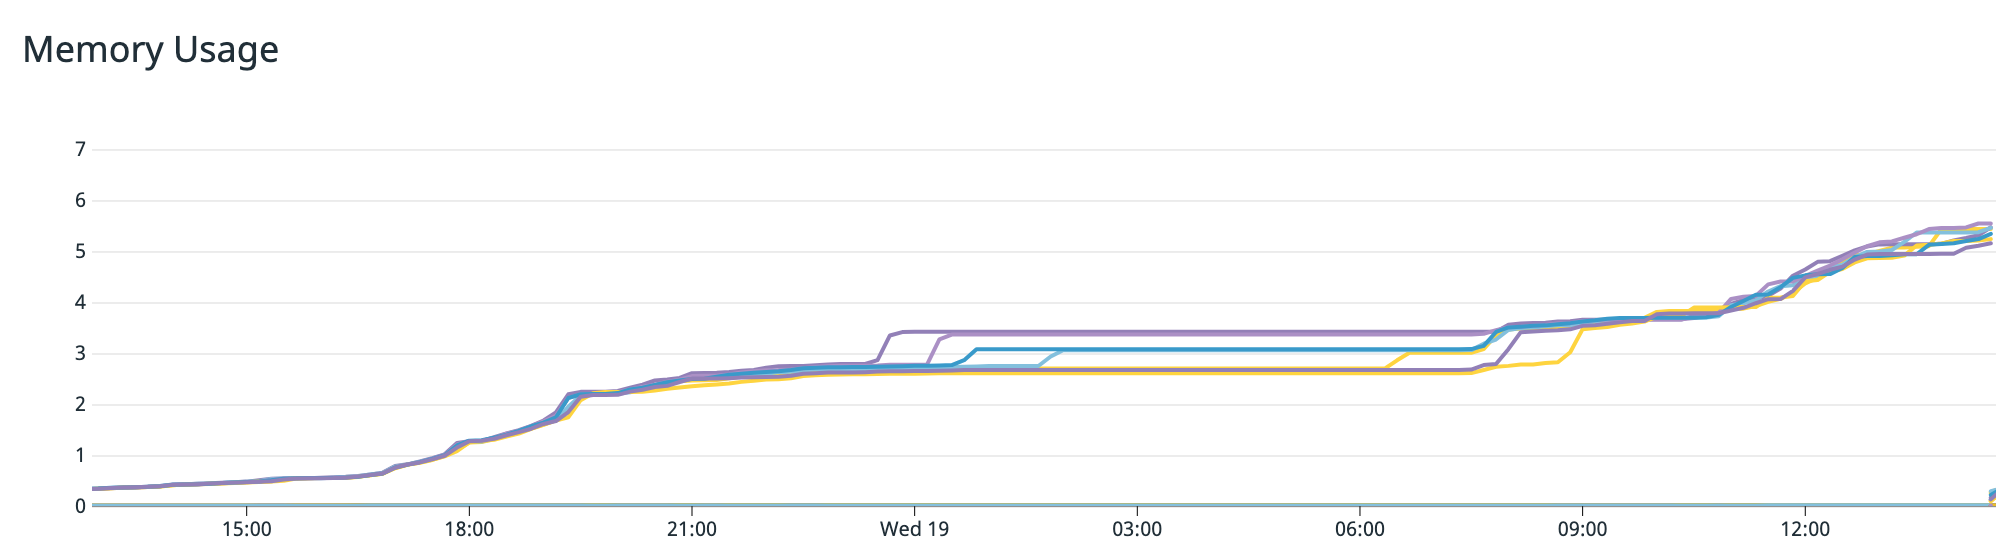
The following graph shows an increase in the memory used with time over 12 hours. Even as the system load receded, memory usage continued to increase.
The continuous increase in memory consumption indicated the possibility of a memory leak, which occurs when memory is allocated but not returned after its use is over. This results in consistently increasing consumed memory until the service runs out of memory and crashes.
Although we could restart the service and resolve the issue temporarily, the increasing memory use suggested a deeper underlying root cause. This meant that we needed to conduct further investigation with tools that could provide deeper insights into the memory allocations.
Debugging Using Go Tools
PPROF is a profiling tool by Golang that helps to visualise and analyse profiles from Go programmes. A profile is a collection of stack traces showing the call sequences in your programme that eventually led to instances of a particular event i.e. allocation. It also provides details such as Heap and CPU information, which could provide insights into the bottlenecks of the Go programme.
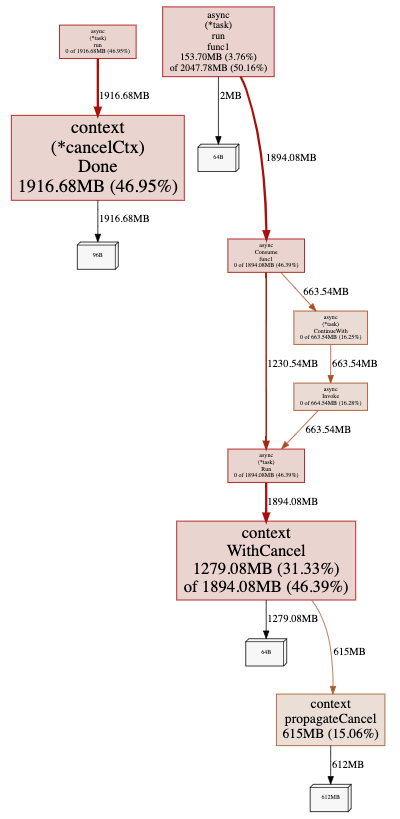
By default, PPROF is enabled on all Grab Go services, making it the ideal tool to use in our scenario. To understand how memory is allocated, we used PPROF to generate Market-Store’s Heap profile, which can be used to understand how inuse memory was allocated for the programme.
You can collect the Heap profile by running this command:
go tool pprof 'http://localhost:6060/debug/pprof/heap'
The command then generates the Heap profile information as shown in the diagram below:
From this diagram, we noticed that a lot of memory was allocated and held by the child context created from Async Library even after the tasks were completed.
In Market-Store, we used the Async Library, a Grab open-source library, which typically used to run concurrent tasks. Any contexts created by the Async Library should be cleaned up after the background tasks are completed. This way, memory would be returned to the service.
However, as shown in the diagram, memory was not being returned, resulting in a memory leak, which explains the increasing memory usage even as Market-Store’s system load decreased.
Uncovering the Real Issue
So we knew that Market-Store’s latency was affected, but we didn’t know why. From the first graph, we saw that memory usage continued to grow even as Market-Store’s system load decreased. Then, PPROF showed us that the memory held by contexts was not cleaned up, resulting in a memory leak.
Through our investigations, we drew a correlation between the increase in memory usage and a degradation in the server’s API latency. In other words, the memory leak resulted in a high memory consumption and eventually, caused the latency issue.
However, there was no change in our service that would have impacted how contexts are created and cleaned up. So what caused the memory leak?
Debugging the Memory Leak
We needed to look into the Async Library and how it worked. For Market-Store, we updated the cache asynchronously for the write-around caching mechanism. We use the Async Library for running the update tasks in the background.
The following code snippet explains how the Async Library works:
async.Consume(context.Background(),runtime.NumCPU()*4,buffer)// Consume runs the tasks with a specific max concurrencyfuncConsume(ctxcontext.Context,concurrencyint,taskschanTask)Task{// code...returnInvoke(ctx,func(context.Context)(interface{},error){workers:=make(chanint,concurrency)concurrentTasks:=make([]Task,concurrency)// code ...t.Run(ctx).ContinueWith(ctx,func(interface{},error)(interface{},error){// code...})}}funcInvoke(ctxcontext.Context,actionWork)Task{returnNewTask(action).Run(ctx)}func(t*task)Run(ctxcontext.Context)Task{ctx,t.cancel=context.WithCancel(ctx)got.run(ctx)returnt}
Note: Code that is not relevant to this article was replaced with code.
As seen in the code snippet above, the Async Library initialises the Consume method with a background context, which is then passed to all its runners. Background contexts are empty and do not track or have links to child contexts that are created from them.
In Market-Store, we use background contexts because they are not bound by request contexts and can continue running even after a request context is cleaned up. This means that once the task has finished running, the memory consumed by child contexts would be freed up, avoiding the issue of memory leaks altogether.
Identifying the Cause of the Memory Leak
Upon further digging, we discovered an MR that was merged into the library to address a task cancellation issue. As shown in the code snippet below, the Consume method had been modified such that task contexts were being passed to the runners, instead of the empty background contexts.
Before we explain the code snippet, we should briefly explain what Golang contexts are. A context is a standard Golang package that carries deadlines, cancellation signals, and other request-scoped values across API boundaries and between processes. We should always remember to cancel contexts after using them.
Importance of Context Cancellation
When a context is cancelled, all contexts derived from it are also cancelled. This means that there will be no unaccounted contexts or links and it can be achieved by using the Async Library’s CancelFunc.
The Async Library’s CancelFunc method will:
Cancel the created child context and its children
Remove the parent reference from the child context
Stop any associated timers
We should always make sure to call the CancelFunc method after using contexts, to ensure that contexts and memory are not leaked.
Explaining the Impact of the MR
In the previous code snippet, we see that task contexts are passed to runners and they are not being cancelled. The Async Library created task contexts from non-empty contexts, which means the task contexts are tracked by the parent contexts. So, even if the work associated with these task contexts is complete, they will not be cleaned up by the system (garbage collected).
As we started using task contexts instead of background contexts and did not cancel them, the memory used by these contexts was never returned, thus resulting in a memory leak.
It took us several tries to debug and investigate the root cause of Market-Store’s high latency issue and through this incident, we learnt several important things that would help prevent a memory leak from recurring.
Always cancel the contexts you’ve created. Leaving it to garbage collection (system cleanup) may result in unexpected memory leaks.
Go profiling can provide plenty of insights about your programme, especially when you’re not sure where to start troubleshooting.
Always benchmark your dependencies when integrating or updating the versions to ensure they don’t have any performance bottlenecks.
Special thanks to Chip Dong Lim for his contributions and for designing the GIFs included in this article.
Join Us
Grab is the leading superapp platform in Southeast Asia, providing everyday services that matter to consumers. More than just a ride-hailing and food delivery app, Grab offers a wide range of on-demand services in the region, including mobility, food, package and grocery delivery services, mobile payments, and financial services across 428 cities in eight countries.
Powered by technology and driven by heart, our mission is to drive Southeast Asia forward by creating economic empowerment for everyone. If this mission speaks to you, join our team today!
The Netflix application runs on hundreds of smart TVs, streaming sticks and pay TV set top boxes. The role of a Partner Engineer at Netflix is to help device manufacturers launch the Netflix application on their devices. In this article we talk about one particularly difficult issue that blocked the launch of a device in Europe.
The mystery begins
Towards the end of 2017, I was on a conference call to discuss an issue with the Netflix application on a new set top box. The box was a new Android TV device with 4k playback, based on Android Open Source Project (AOSP) version 5.0, aka “Lollipop”. I had been at Netflix for a few years, and had shipped multiple devices, but this was my first Android TV device.
All four players involved in the device were on the call: there was the large European pay TV company (the operator) launching the device, the contractor integrating the set-top-box firmware (the integrator), the system-on-a-chip provider (the chip vendor), and myself (Netflix).
The integrator and Netflix had already completed the rigorous Netflix certification process, but during the TV operator’s internal trial an executive at the company reported a serious issue: Netflix playback on his device was “stuttering.”, i.e. video would play for a very short time, then pause, then start again, then pause. It didn’t happen all the time, but would reliably start to happen within a few days of powering on the box. They supplied a video and it looked terrible.
The device integrator had found a way to reproduce the problem: repeatedly start Netflix, start playback, then return to the device UI. They supplied a script to automate the process. Sometimes it took as long as five minutes, but the script would always reliably reproduce the bug.
Meanwhile, a field engineer for the chip vendor had diagnosed the root cause: Netflix’s Android TV application, called Ninja, was not delivering audio data quickly enough. The stuttering was caused by buffer starvation in the device audio pipeline. Playback stopped when the decoder waited for Ninja to deliver more of the audio stream, then resumed once more data arrived. The integrator, the chip vendor and the operator all thought the issue was identified and their message to me was clear: Netflix, you have a bug in your application, and you need to fix it. I could hear the stress in the voices from the operator. Their device was late and running over budget and they expected results from me.
The investigation
I was skeptical. The same Ninja application runs on millions of Android TV devices, including smart TVs and other set top boxes. If there was a bug in Ninja, why is it only happening on this device?
I started by reproducing the issue myself using the script provided by the integrator. I contacted my counterpart at the chip vendor, asked if he’d seen anything like this before (he hadn’t). Next I started reading the Ninja source code. I wanted to find the precise code that delivers the audio data. I recognized a lot, but I started to lose the plot in the playback code and I needed help.
I walked upstairs and found the engineer who wrote the audio and video pipeline in Ninja, and he gave me a guided tour of the code. I spent some quality time with the source code myself to understand its working parts, adding my own logging to confirm my understanding. The Netflix application is complex, but at its simplest it streams data from a Netflix server, buffers several seconds worth of video and audio data on the device, then delivers video and audio frames one-at-a-time to the device’s playback hardware.
Figure 1: Device Playback Pipeline (simplified)
Let’s take a moment to talk about the audio/video pipeline in the Netflix application. Everything up until the “decoder buffer” is the same on every set top box and smart TV, but moving the A/V data into the device’s decoder buffer is a device-specific routine running in its own thread. This routine’s job is to keep the decoder buffer full by calling a Netflix provided API which provides the next frame of audio or video data. In Ninja, this job is performed by an Android Thread. There is a simple state machine and some logic to handle different play states, but under normal playback the thread copies one frame of data into the Android playback API, then tells the thread scheduler to wait 15 ms and invoke the handler again. When you create an Android thread, you can request that the thread be run repeatedly, as if in a loop, but it is the Android Thread scheduler that calls the handler, not your own application.
To play a 60fps video, the highest frame rate available in the Netflix catalog, the device must render a new frame every 16.66 ms, so checking for a new sample every 15ms is just fast enough to stay ahead of any video stream Netflix can provide. Because the integrator had identified the audio stream as the problem, I zeroed in on the specific thread handler that was delivering audio samples to the Android audio service.
I wanted to answer this question: where is the extra time? I assumed some function invoked by the handler would be the culprit, so I sprinkled log messages throughout the handler, assuming the guilty code would be apparent. What was soon apparent was that there was nothing in the handler that was misbehaving, and the handler was running in a few milliseconds even when playback was stuttering.
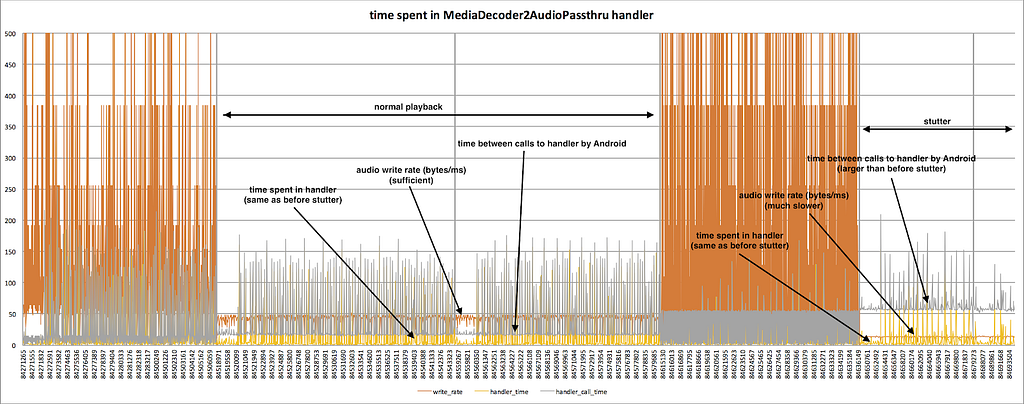
Aha, Insight
In the end, I focused on three numbers: the rate of data transfer, the time when the handler was invoked and the time when the handler passed control back to Android. I wrote a script to parse the log output, and made the graph below which gave me the answer.
Figure 2: Visualizing Audio Throughput and Thread Handler Timing
The orange line is the rate that data moved from the streaming buffer into the Android audio system, in bytes/millisecond. You can see three distinct behaviors in this chart:
The two, tall spiky parts where the data rate reaches 500 bytes/ms. This phase is buffering, before playback starts. The handler is copying data as fast as it can.
The region in the middle is normal playback. Audio data is moved at about 45 bytes/ms.
The stuttering region is on the right, when audio data is moving at closer to 10 bytes/ms. This is not fast enough to maintain playback.
The unavoidable conclusion: the orange line confirms what the chip vendor’s engineer reported: Ninja is not delivering audio data quickly enough.
To understand why, let’s see what story the yellow and grey lines tell.
The yellow line shows the time spent in the handler routine itself, calculated from timestamps recorded at the top and the bottom of the handler. In both normal and stutter playback regions, the time spent in the handler was the same: about 2 ms. The spikes show instances when the runtime was slower due to time spent on other tasks on the device.
The real root cause
The grey line, the time between calls invoking the handler, tells a different story. In the normal playback case you can see the handler is invoked about every 15 ms. In the stutter case, on the right, the handler is invoked approximately every 55 ms. There are an extra 40 ms between invocations, and there’s no way that can keep up with playback. But why?
I reported my discovery to the integrator and the chip vendor (look, it’s the Android Thread scheduler!), but they continued to push back on the Netflix behavior. Why don’t you just copy more data each time the handler is called? This was a fair criticism, but changing this behavior involved deeper changes than I was prepared to make, and I continued my search for the root cause. I dove into the Android source code, and learned that Android Threads are a userspace construct, and the thread scheduler uses the epoll() system call for timing. I knew epoll() performance isn’t guaranteed, so I suspected something was affecting epoll() in a systematic way.
At this point I was saved by another engineer at the chip supplier, who discovered a bug that had already been fixed in the next version of Android, named Marshmallow. The Android thread scheduler changes the behavior of threads depending whether or not an application is running in the foreground or the background. Threads in the background are assigned an extra 40 ms (40000000 ns) of wait time.
A bug deep in the plumbing of Android itself meant this extra timer value was retained when the thread moved to the foreground. Usually the audio handler thread was created while the application was in the foreground, but sometimes the thread was created a little sooner, while Ninja was still in the background. When this happened, playback would stutter.
Lessons learned
This wasn’t the last bug we fixed on this platform, but it was the hardest to track down. It was outside of the Netflix application, in a part of the system that was outside of the playback pipeline, and all of the initial data pointed to a bug in the Netflix application itself.
This story really exemplifies an aspect of my job I love: I can’t predict all of the issues that our partners will throw at me, and I know that to fix them I have to understand multiple systems, work with great colleagues, and constantly push myself to learn more. What I do has a direct impact on real people and their enjoyment of a great product. I know when people enjoy Netflix in their living room, I’m an essential part of the team that made it happen.
By continuing to use the site, you agree to the use of cookies. more information
The cookie settings on this website are set to "allow cookies" to give you the best browsing experience possible. If you continue to use this website without changing your cookie settings or you click "Accept" below then you are consenting to this.