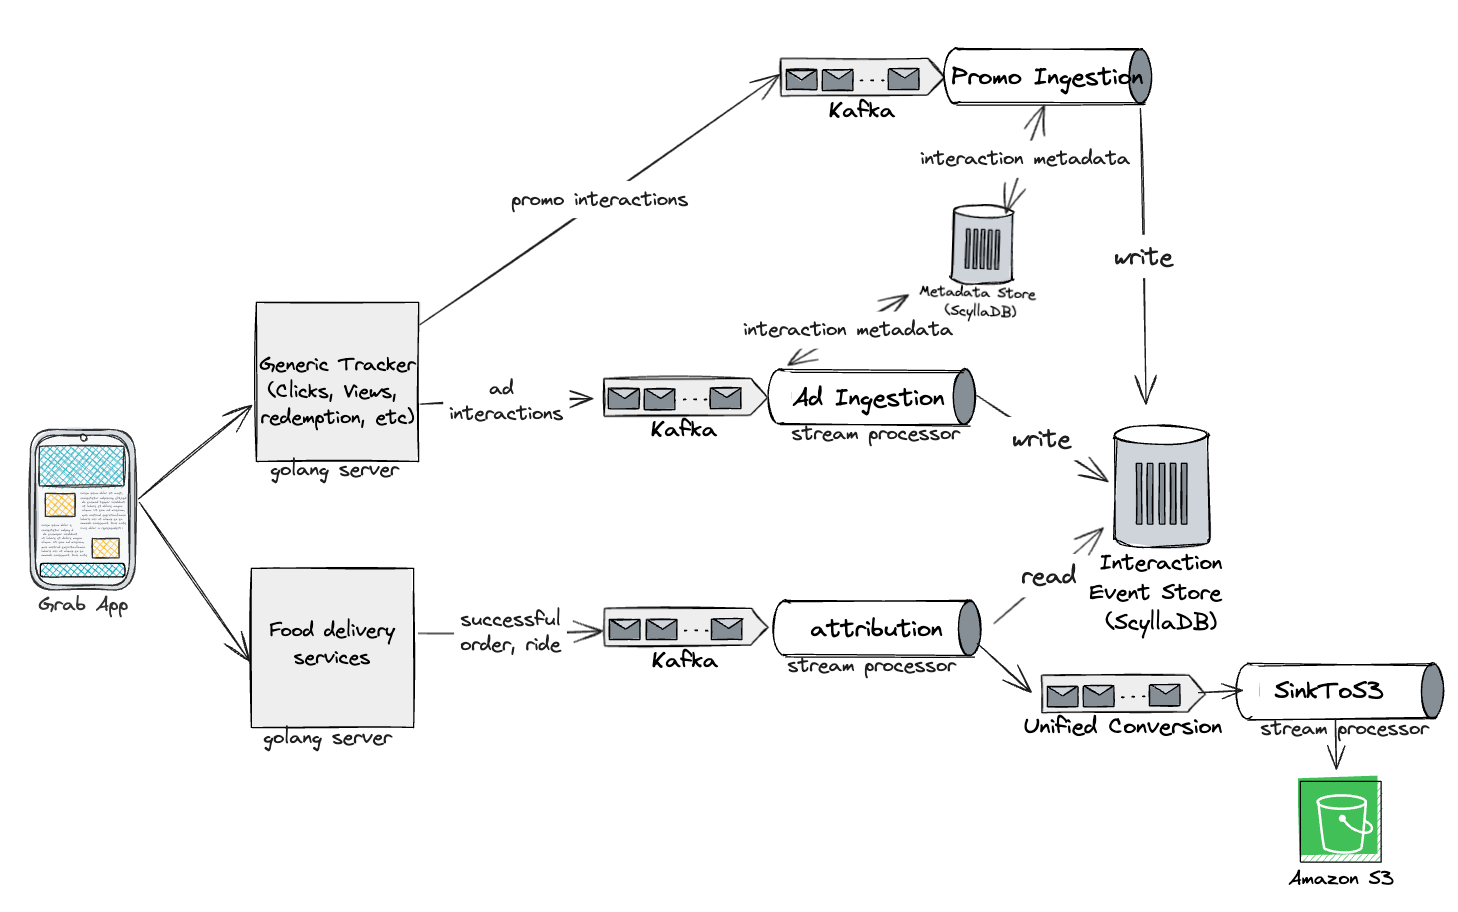
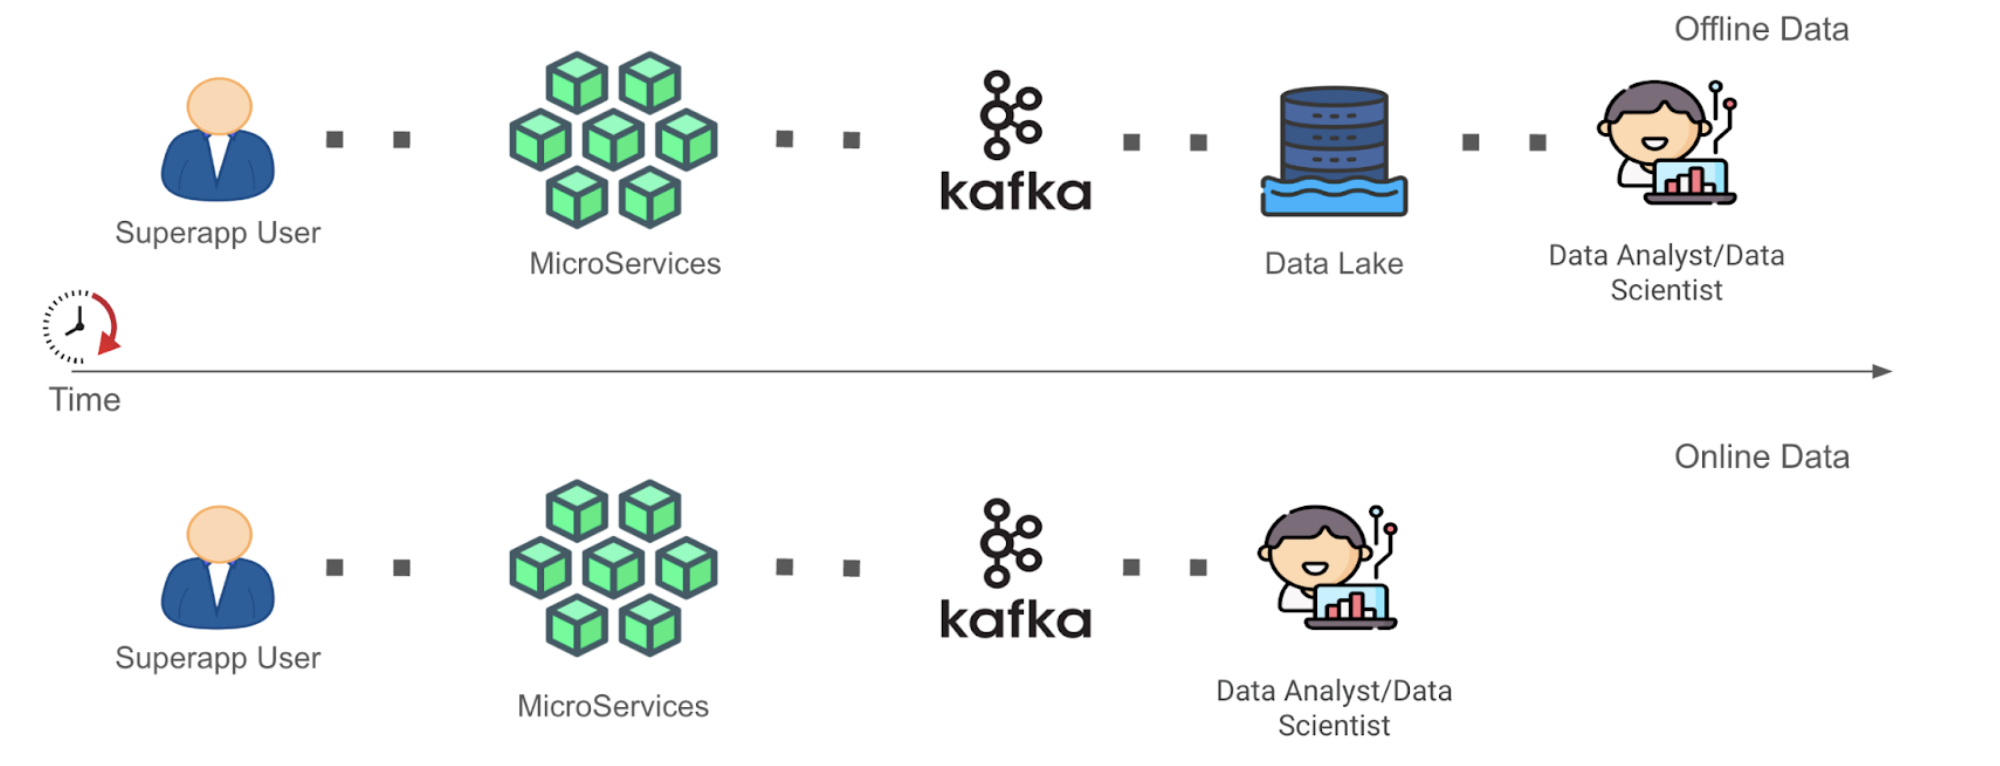
Grab has an in-house Risk Management platform called GrabDefence which relies on ingesting large amounts of data gathered from upstream services to power our heuristic risk rules and data science models in real time.
Fig 1. GrabDefence aggregates data from different upstream services
As Grab’s business grows, so does the amount of data. It becomes imperative that the data which fuels our risk systems is of reliable quality as any data discrepancy or missing data could impact fraud detection and prevention capabilities.
We need to quickly detect any data anomalies, which is where data observability comes in.
Data observability as a solution
Data observability is a type of data operation (DataOps; similar to DevOps) where teams build visibility over the health and quality of their data pipelines. This enables teams to be notified of data quality issues, and allows teams to investigate and resolve these issues faster.
We needed a solution that addresses the following issues:
Alerts for any data quality issues as soon as possible – so this means the observability tool had to work in real time.
With hundreds of data points to observe, we needed a neat and scalable solution which allows users to quickly pinpoint which data points were having issues.
A consistent way to compare, analyse, and compute data that might have different formats.
Hence, we decided to use Flink to standardise data transformations, compute, and observe data trends quickly (in real time) and scalably.
Utilising Flink for real-time computations at scale
What is Flink?
Flink SQL is a powerful, flexible tool for performing real-time analytics on streaming data. It allows users to query continuous data streams using standard SQL syntax, enabling complex event processing and data transformation within the Apache Flink ecosystem, which is particularly useful for scenarios requiring low-latency insights and decisions.
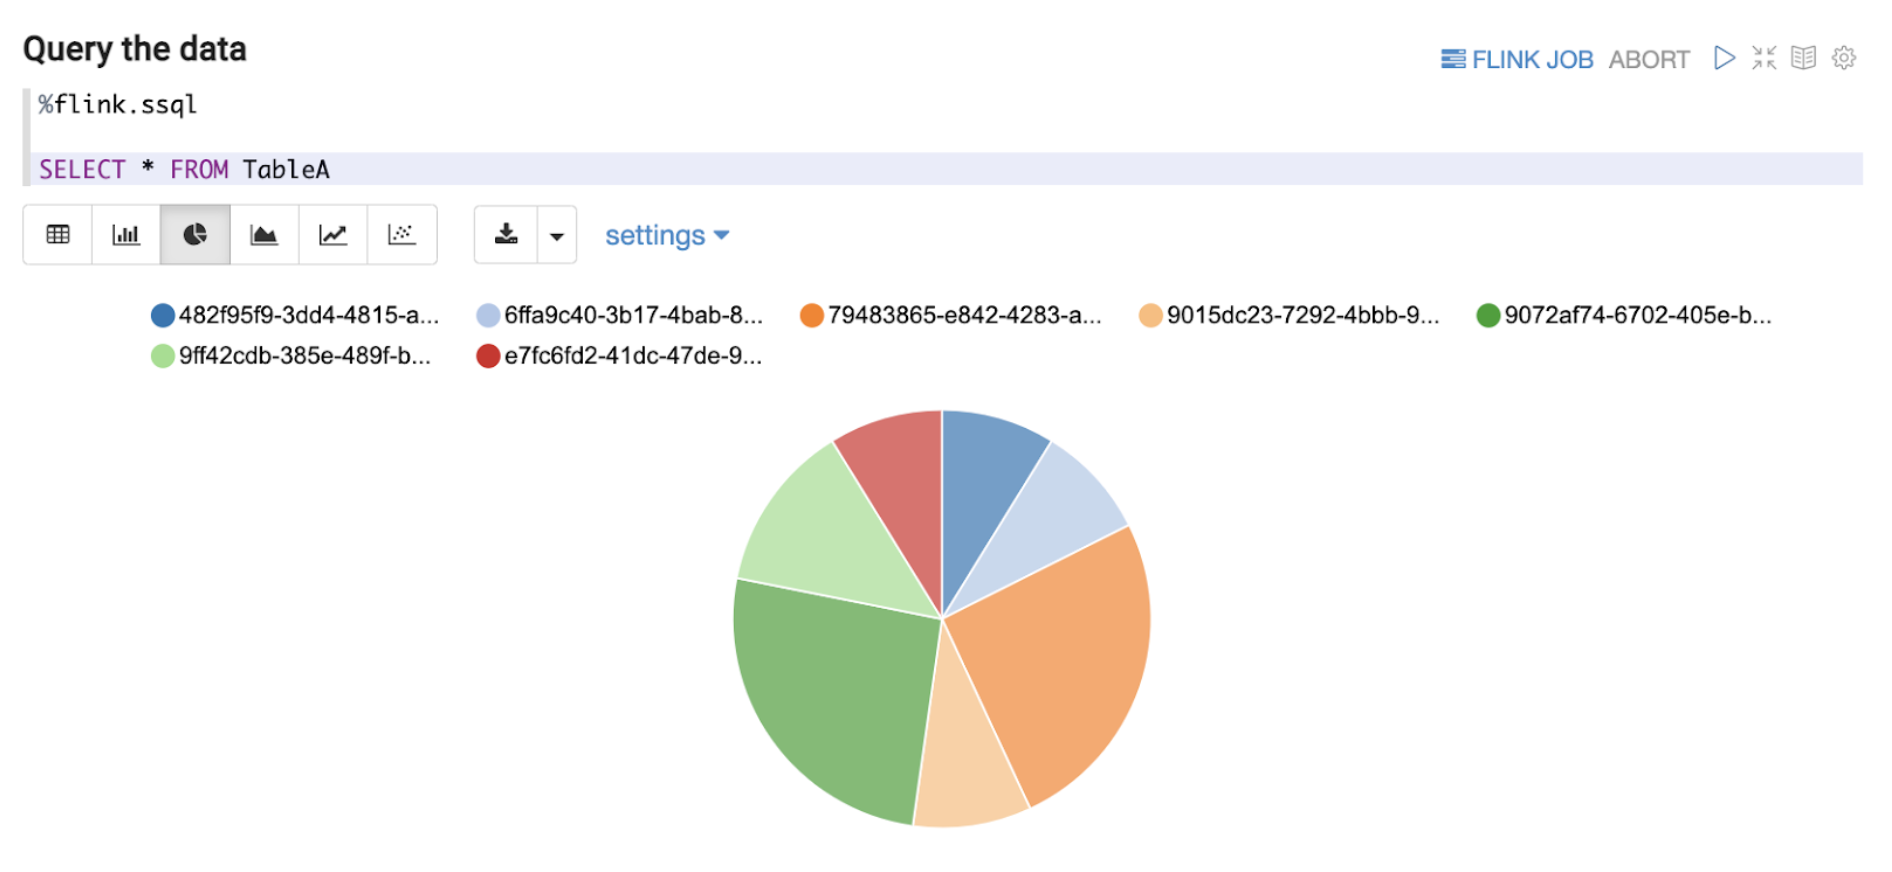
How we used Flink to compute data output
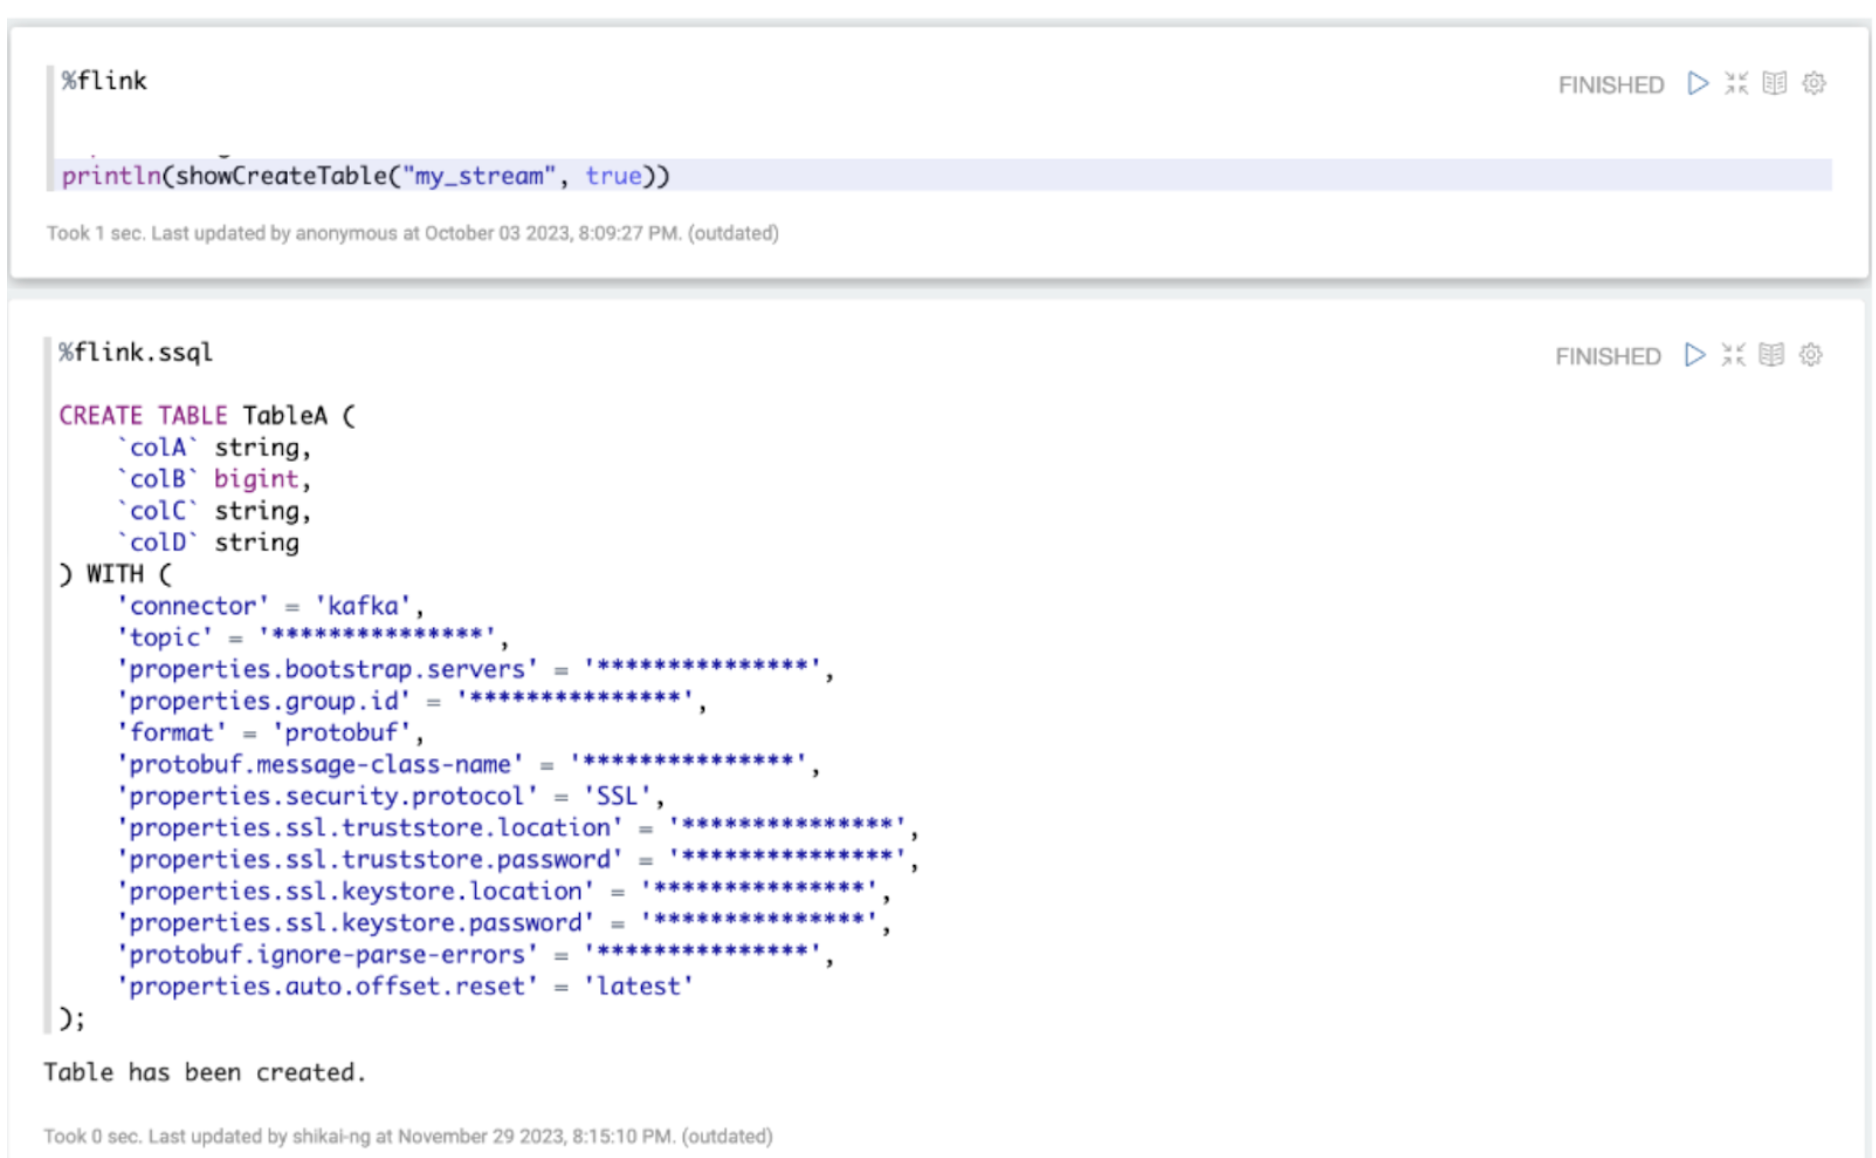
In Grab, data comes from multiple sources and while most of the data is in JSON format, the actual JSON structure differs between services. Because of JSON’s nested and dynamic data structure, it is difficult to consistently analyse the data – posing a significant challenge for real-time analysis.
To help address this issue, Apache Flink SQL has the capability to manage such intricacies with ease. It offers specialised functions tailored for parsing and querying JSON data, ensuring efficient processing.
Another standout feature of Flink SQL is the use of custom table functions, such as JSONEXPLOAD, which serves to deconstruct and flatten nested JSON structures into tabular rows. This transformation is crucial as it enables subsequent aggregation operations. By implementing a 5-minute tumbling window, Flink SQL can easily aggregate these now-flattened data streams. This technique is pivotal for monitoring, observing, and analysing data patterns and metrics in near real-time.
Now that data is aggregated by Flink for easy analysis, we still needed a way to incorporate comprehensive monitoring so that teams could be notified of any data anomalies or discrepancies in real time.
How we interfaced the output with Datadog
Datadog is the observability tool of choice in Grab, with many teams using Datadog for their service reliability observations and alerts. By aggregating data from Apache Flink and integrating it with Datadog, we can harness the synergy of real-time analytics and comprehensive monitoring. Flink excels in processing and aggregating data streams, which, when pushed to Datadog, can be further analysed and visualised. Datadog also provides seamless integration with collaboration tools like Slack, which enables teams to receive instant notifications and alerts.
With Datadog’s out-of-the-box features such as anomaly detection, teams can identify and be alerted to unusual patterns or outliers in their data streams. Taking a proactive approach to monitoring is crucial in maintaining system health and performance as teams can be alerted, then collaborate quickly to diagnose and address anomalies.
This integrated pipeline—from Flink’s real-time data aggregation to Datadog’s monitoring and Slack’s communication capabilities—creates a robust framework for real-time data operations. It ensures that any potential issues are quickly traced and brought to the team’s attention, facilitating a rapid response. Such an ecosystem empowers organisations to maintain high levels of system reliability and performance, ultimately enhancing the overall user experience.
Organising monitors and alerts using out-of-the-box solutions from Datadog
Once we integrated Flink data into Datadog, we realised that it could become unwieldy to try to identify the data point with issues from hundreds of other counters.
Fig 2. Hundreds of data points on a graph make it hard to decipher which ones have issues
We decided to organise the counters according to the service stream it was coming from, and create individual monitors for each service stream. We used Datadog’s Monitor Summary tool to help visualise the total number of service streams we are reading from and the number of underlying data points within each stream.
Fig 3. Data is grouped according to their source stream
Within each individual stream, we used Datadog’s Anomaly Detection feature to create an alert whenever a data point from the stream exceeds a predefined threshold. This can be configured by the service teams on Datadog.
Fig 4. Datadog’s built-in Anomaly Detection function triggers alerts whenever a data point exceeds a threshold
These alerts are then sent to a Slack channel where the Data team is informed when a data point of interest starts throwing anomalous values.
Fig 5. Datadog integration with Slack to help alert users
Impact
Since the deployment of this data observability tool, we have seen significant improvement in the detection of anomalous values. If there are any anomalies or issues, we now get alerts within the same day (or hour) instead of days to weeks later.
Organising the alerts according to source streams have also helped simplify the monitoring load and allows users to quickly narrow down and identify which pipeline has failed.
What’s next?
At the moment, this data observability tool is only implemented on selected checkpoints in GrabDefence. We plan to expand the observability tool’s coverage to include more checkpoints, and continue to refine the workflows to detect and resolve these data issues.
Join us
Grab is the leading superapp platform in Southeast Asia, providing everyday services that matter to consumers. More than just a ride-hailing and food delivery app, Grab offers a wide range of on-demand services in the region, including mobility, food, package and grocery delivery services, mobile payments, and financial services across 428 cities in eight countries.
Powered by technology and driven by heart, our mission is to drive Southeast Asia forward by creating economic empowerment for everyone. If this mission speaks to you, join our team today!
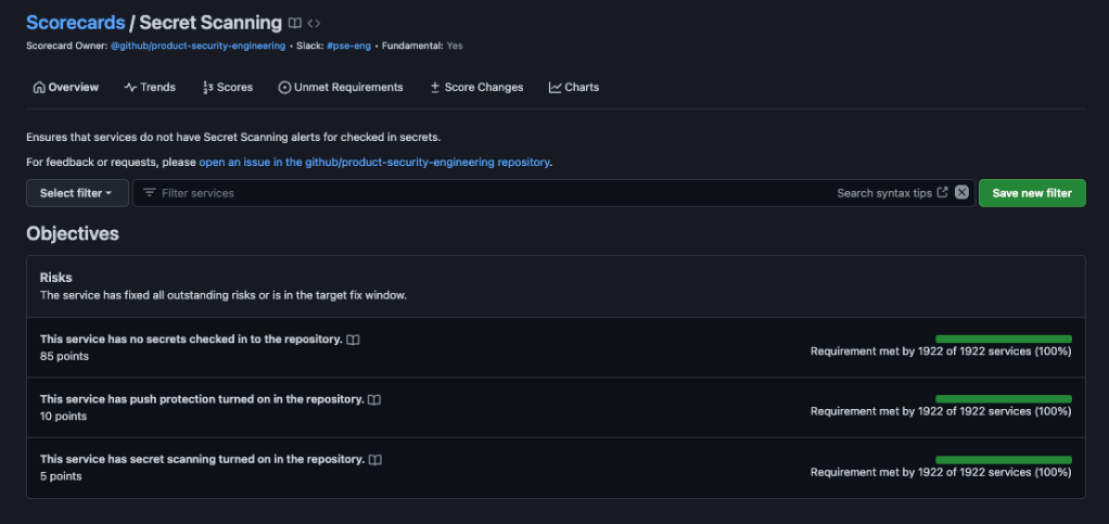
In March, we experienced two incidents that resulted in degraded performance across GitHub services.
March 15 19:42 UTC (lasting 42 minutes)
On March 15, GitHub experienced service degradation from 19:42 to 20:24 UTC due to a regression in the permissions system. This regression caused failures in GitHub Codespaces, GitHub Actions, and GitHub Pages. The problem stemmed from a framework upgrade that introduced MySQL query syntax that is incompatible with the database proxy service used in some production clusters. GitHub responded by rolling back the deployment and fixing a misconfiguration in development and CI environments to prevent similar issues in the future.
March 11 22:45 UTC (lasting 2 hours and 3 minutes)
On March 11, GitHub experienced service degradation from 22:45 to 00:48 UTC due to an inadvertent deployment of network configuration to the wrong environment. This led to intermittent errors in various services, including API requests, GitHub Copilot, GitHub secret scanning, and 2FA using GitHub Mobile. The issue was detected within 4 minutes, and a rollback was initiated immediately. The majority of impact was mitigated by 22:54 UTC. However, the rollback failed in one data center due to system-created configuration records missing a required field, causing 0.4% of requests to continue failing. Full rollback was successful after manual intervention to correct the configuration data, enabling full service restoration by 00:48 UTC. GitHub has implemented measures for safer configuration changes, such as prevention and automatic cleanup of obsolete configuration and faster issue detection, to prevent similar issues in the future.
Please follow our status page for real-time updates on status changes and post-incident recaps. To learn more about what we’re working on, check out the GitHub Engineering Blog.
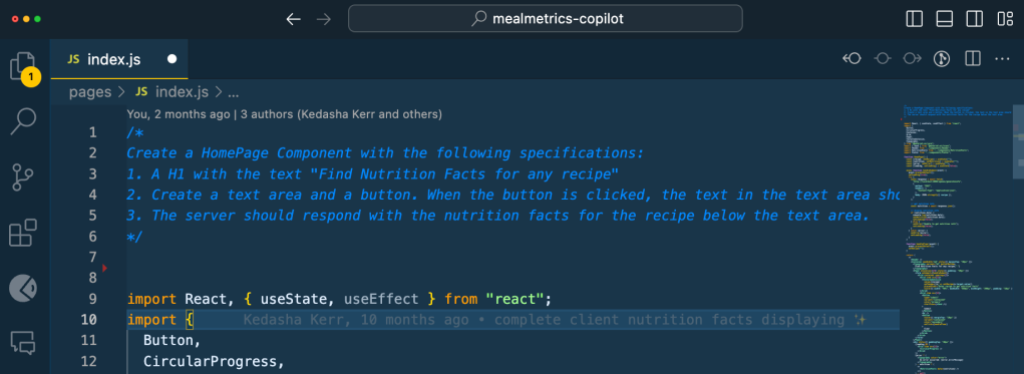
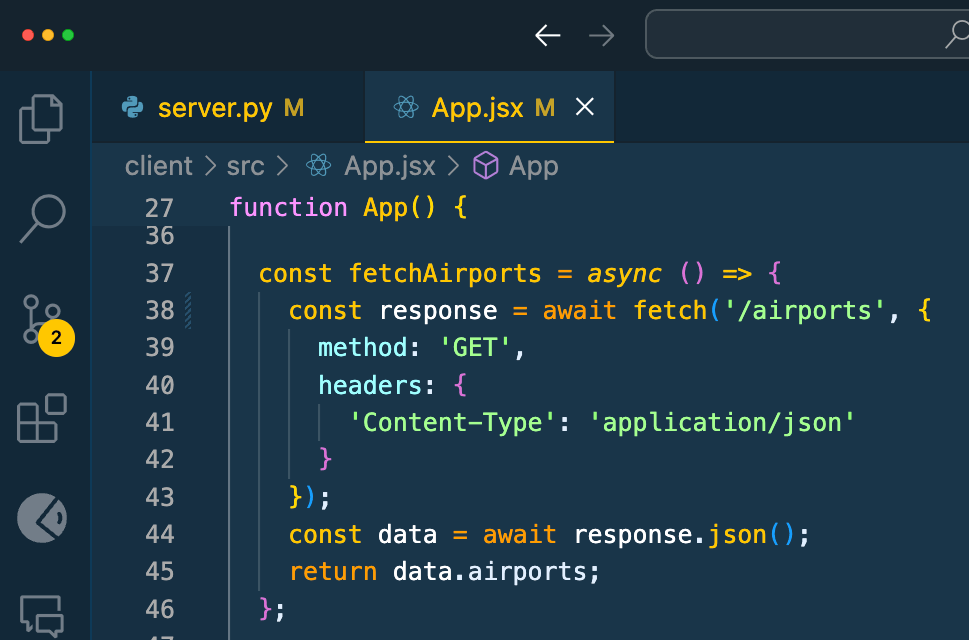
Just recently, I was coding a new feature for GitHub Copilot Chat. My task was to enable the chat to recognize a user’s project dependencies, allowing it to provide magical answers when the user poses a question. While I could have easily listed the project dependencies and considered the task complete, I knew that to extract top-notch responses from these large language models, I needed to be careful to not overload the prompt to avoid confusing the model by providing too much context. This meant pre-processing the dependency list and selecting the most relevant ones to include in the chat prompt.
Creating machine-processable formats for the most prominent frameworks across various programming languages would have consumed days. It was during this time that I experienced one of those “Copilot moments.”
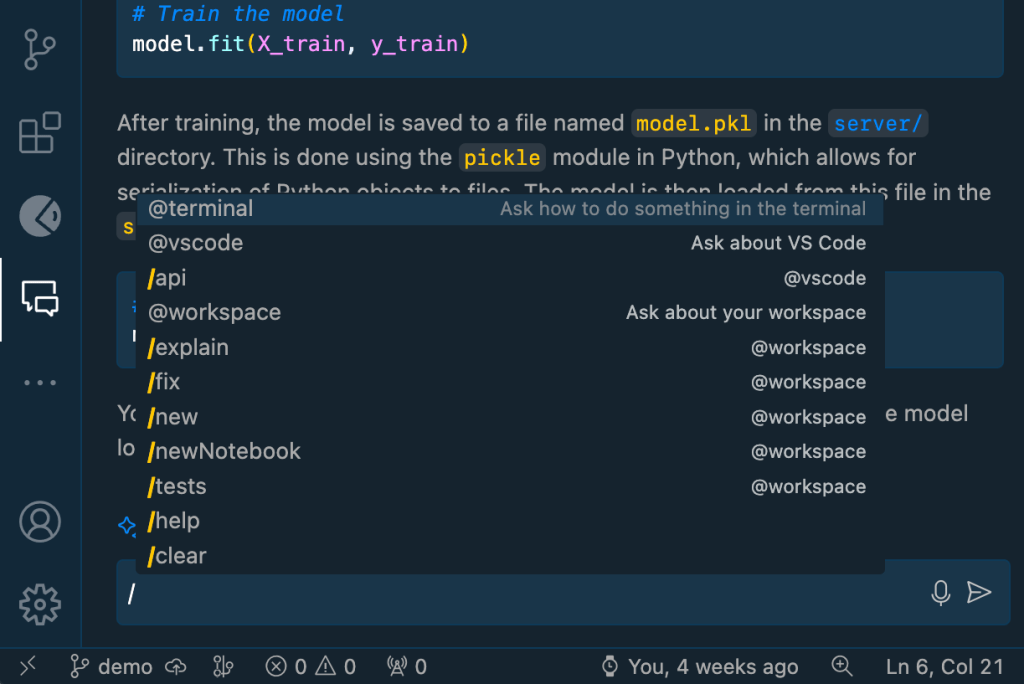
I simply queried the chat in my IDE:
Look at the data structure I have selected and create at least 10 examples that conform to the data structure. The data should cover the most prominent frameworks for the Go programming language.
Voilà, there it was my initial batch of machine-processable dependencies. Just 30 minutes later, I had amassed a comprehensive collection of significant dependencies for nearly all supported languages, complete with parameterized unit tests. Completing a task that would likely have taken days without GitHub Copilot, in just 30 minutes, was truly remarkable.
This led me to ponder: what other “Copilot moments” might my colleagues here at GitHub have experienced? Thus, here are a few ways we use GitHub Copilot at GitHub.
1. Semi-automating repetitive tasks
Semi-automating repetitive tasks is a topic that resonates with a colleague of mine from another team. He mentions that they are tasked with developing and maintaining several live services, many of which utilize protocol buffers for data communication. During maintenance, they often encounter a situation where they need to increment ID numbers in the protobuf definitions, as illustrated in the code snippet below:
He particularly appreciates having GitHub Copilot completions in the editor for these tasks. It serves as a significant time saver, eliminating the need to manually generate ID numbers. Instead, one can simply tab through the completion suggestions until the task is complete.
2. Avoid getting side tracked
Here’s another intriguing use case I heard about from a colleague. He needed to devise a regular expression to capture a Markdown code block and extract the language identifier. Fully immersed in his work, he preferred not to interrupt his flow by switching to chat, even though it could have provided a solution. Instead, he employed a creative approach by formalizing his task in a code comment:
// The string above contains a code block with a language identifier.
// Create a regexp that matches the code block and captures the language
identifier.
// Use tagged capture groups for the language and the code.
This prompted GitHub Copilot to generate the regular expression as the subsequent statement in his editor:
const re = /```(?<lang>\w+)(?<code>[\s\S]+?)```/;
With the comment deleted, the task was swiftly accomplished!
3. Structuring data-related notes
During a pleasant coffee chat, one of our support engineers shared an incident she experienced with a colleague last week. It was a Friday afternoon, and they were attempting to troubleshoot an issue for a specific customer. Eventually, they pinpointed the solution by creating various notes in VSCode. At GitHub, we prioritize remote collaboration. Thus, merely resolving the task wasn’t sufficient; it was also essential to inform our colleagues about the process to ensure the best possible experience for future customer requests. Consequently, even after completing this exhaustive task, they needed to document how they arrived at the solution.
She initiated GitHub Copilot Chat and simply typed something along the lines of, “Organize my notes, structure them, and compile the data in the editor into Markdown tables.” Within seconds, the task was completed, allowing them to commence their well-deserved weekend.
4. Exploring and learning
Enhancing and acquiring new skills are integral aspects of every engineer’s journey. John Berryman, a colleague of mine, undertook the challenge of leveraging GitHub Copilot to tackle a non-trivial coding task in a completely unfamiliar programming language. His goal was to delve into Rust, so on a Sunday, he embarked on this endeavor with the assistance of GitHub Copilot Chat. The task he set out to accomplish was to develop a program capable of converting any numerical input into its written English equivalent. While initially seeming straightforward, this task presented various complexities such as handling teen numbers, naming conventions for tens, placement of “and” in the output, and more.
Twenty-three minutes and nine seconds later, he successfully produced a functional version written in Rust, despite having no prior experience with the language. Notably, he documented his entire process, recording himself throughout the endeavor.
Berryman uses an older, experimental version of GitHub Copilot to write a program in Rust.
Your very own GitHub Copilot moment
I found it incredibly enlightening to discover how my fellow Hubbers utilize GitHub Copilot, and their innovative approaches inspired me to incorporate some of their ideas into my daily workflows. If you’re eager to explore GitHub Copilot firsthand, getting started is a breeze. Simply install it into your preferred editor and ask away.
This article introduces the GrabX Decision Engine, an internal open-source package that offers a comprehensive framework for designing and analysing experiments conducted on online experiment platforms. The package encompasses a wide range of functionalities, including a pre-experiment advisor, a post-experiment analysis toolbox, and other advanced tools. In this article, we explore the motivation behind the development of these functionalities, their integration into the unique ecosystem of Grab’s multi-sided marketplace, and how these solutions strengthen the culture and calibre of experimentation at Grab.
Background
Today, Grab’s Experimentation (GrabX) platform orchestrates the testing of thousands of experimental variants each week. As the platform continues to expand and manage a growing volume of experiments, the need for dependable, scalable, and trustworthy experimentation tools becomes increasingly critical for data-driven and evidence-based
decision-making.
In our previous article, we presented the Automated Experiment Analysis application, a tool designed to automate data pipelines for analyses. However, during the development of this application for Grab’s experimenter community, we noticed a prevailing trend: experiments were predominantly analysed on a one-by-one, manual basis. While such a federated approach may be needed in a few cases, it presents numerous challenges at
the organisational level:
Lack of a contextual toolkit: GrabX facilitates executing a diverse range of experimentation designs, catering to the varied needs and contexts of different tech teams across the organisation. However, experimenters may often rely on generic online tools for experiment configurations (e.g. sample size calculations), which were not specifically designed to cater to the nuances of GrabX experiments or the recommended evaluation method, given the design. This is exacerbated by the fact
that most online tutorials or courses on experimental design do not typically address the nuances of multi-sided marketplaces, and cannot consider the nature or constraints of specific experiments.
Lack of standards: In this federated model, the absence of standardised and vetted practices can lead to reliability issues. In some cases, these can include poorly designed experiments, inappropriate evaluation methods, suboptimal testing choices, and unreliable inferences, all of which are difficult to monitor and rectify.
Lack of scalability and efficiency: Experimenters, coming from varied backgrounds and possessing distinct skill sets, may adopt significantly different approaches to experimentation and inference. This diversity, while valuable, often impedes the transferability and sharing of methods, hindering a cohesive and scalable experimentation framework. Additionally, this variance in methods can extend the lifecycle of experiment analysis, as disagreements over approaches may give rise to
repeated requests for review or modification.
Solution
To address these challenges, we developed the GrabX Decision Engine, a Python package open-sourced internally across all of Grab’s development platforms. Its central objective is to institutionalise best practices in experiment efficiency and analytics, thereby ensuring the derivation of precise and reliable conclusions from each experiment.
In particular, this unified toolkit significantly enhances our end-to-end experimentation processes by:
Ensuring compatibility with GrabX and Automated Experiment Analysis: The package is fully integrated with the Automated Experiment Analysis app, and provides analytics and test results tailored to the designs supported by GrabX. The outcomes can be further used for other downstream jobs, e.g. market modelling, simulation-based calibrations, or auto-adaptive configuration tuning.
Standardising experiment analytics: By providing a unified framework, the package ensures that the rationale behind experiment design and the interpretation of analysis results adhere to a company-wide standard, promoting consistency and ease of review across different teams.
Enhancing collaboration and quality: As an open-source package, it not only fosters a collaborative culture but also upholds quality through peer reviews. It invites users to tap into a rich pool of features while encouraging contributions that refine and expand the toolkit’s capabilities.
The package is designed for everyone involved in the experimentation process, with data scientists and product analysts being the primary users. Referred to as experimenters in this article, these key stakeholders can not only leverage the existing capabilities of the package to support their projects, but can also contribute their own innovations. Eventually, the experiment results and insights generated from the package via the Automated Experiment Analysis app have an even wider reach to stakeholders across all functions.
In the following section, we go deeper into the key functionalities of the package.
Feature details
The package comprises three key components:
An experimentation trusted advisor
A comprehensive post-experiment analysis toolbox
Advanced tools
These have been built taking into account the type of experiments we typically run at Grab. To understand their functionality, it’s useful to first discuss the key experimental designs supported by GrabX.
A note on experimental designs
While there is a wide variety of specific experimental designs implemented, they can be bucketed into two main categories: a between-subject design and a within-subject design.
In a between-subject design, participants — like our app users, driver-partners, and merchant-partners — are split into experimental groups, and each group gets exposed to a distinct condition throughout the experiment. One challenge in this design is that each participant may provide multiple observations to our experimental analysis sample, causing a high within-subject correlation among observations and deviations between the randomisation and session unit. This can affect the accuracy of
pre-experiment power analysis, and post-experiment inference, since it necessitates adjustments, e.g. clustering of standard errors when conducting hypothesis testing.
Conversely, a within-subject design involves every participant experiencing all conditions. Marketplace-level switchback experiments are a common GrabX use case, where a timeslice becomes the experimental unit. This design not only faces the aforementioned challenges, but also creates other complications that need to be accounted for, such as spillover effects across timeslices.
Designing and analysing the results of both experimental approaches requires careful nuanced statistical tools. Ensuring proper duration, sample size, controlling for confounders, and addressing potential biases are important considerations to enhance the validity of the results.
Trusted Advisor
The first key component of the Decision Engine is the Trusted Advisor, which provides a recommendation to the experimenter on key experiment attributes to be considered when preparing the experiment. This is dependent on the design; at a minimum, the experimenter needs to define whether the experiment design is between- or within-subject.
The between-subject design: We strongly recommend that experimenters utilise the “Trusted Advisor” feature in the Decision Engine for estimating their required sample size. This is designed to account for the multiple observations per user the experiment is expected to generate and adjusts for the presence of clustered errors (Moffatt, 2020; List, Sadoff, & Wagner, 2011). This feature allows users to input their data, either as a PySpark or Pandas dataframe. Alternatively, a function is
provided to extract summary statistics from their data, which can then be inputted into the Trusted Advisor. Obtaining the data beforehand is actually not mandatory; users have the option to directly query the recommended sample size based on common metrics derived from a regular data pipeline job. These functionalities are illustrated in the flowchart below.
Trusted Advisor functionalities
Furthermore, the Trusted Advisor feature can identify the underlying characteristics of the data, whether it’s passed directly, or queried from our common metrics database. This enables it to determine the appropriate power analysis for the experiment, without further guidance. For instance, it can detect if the target metric is a binary decision variable, and will adapt the power analysis to the correct context.
The within-subject design: In this case, we instead provide a best practices guideline to follow. Through our experience supporting various Tech Families running switchback experiments, we have observed various challenges highly dependent on the use case. This makes it difficult to create a one-size-fits-all solution.
For instance, an important factor affecting the final sample size requirement is how frequently treatments switch, which is also tied to what data granularity is appropriate to use in the post-experiment analysis. These considerations are dependent on, among other factors, how quickly a given treatment is expected to cause an effect. Some treatments may take effect relatively quickly (near-instantly, e.g. if applied to price checks), while others may take significantly longer (e.g. 15-30 minutes because they may require a trip to be completed). This has further consequences, e.g. autocorrelation between observations within a treatment window, spillover effects between different treatment windows, requirements for cool-down windows when treatments switch, etc.
Another issue we have identified from analysing the history of experiments on our platform is that a significant portion is prone to issues related to sample ratio mismatch (SRM). We therefore also heavily emphasise the post-experiment analysis corrections and robustness checks that are needed in switchback experiments, and do not simply rely on pre-experiment guidance such as power analysis.
Post-experiment analysis
Upon completion of the experiment, a comprehensive toolbox for post-experiment analysis is available. This toolbox consists of a wide range of statistical tests, ranging from normality tests to non-parametric and parametric tests. Here is an overview of the different types of tests included in the toolbox for different experiment setups:
Tests supported by the post-experiment analysis component
Though we make all the relevant tests available, the package sets a default list of output. With just two lines of code specifying the desired experiment design, experimenters can easily retrieve the recommended results, as summarised in the following table.
Types
Details
Basic statistics
The mean, variance, and sample size of Treatment and Control
Uplift tests
Welch’s t-test; Non-parametric tests, such as Wilcoxon signed-rank test and Mann-Whitney U Test
Misc tests
Normality tests such as the Shapiro-Wilk test, Anderson-Darling test, and Kolmogorov-Smirnov test; Levene test which assesses the equality of variances between groups
Regression models
A standard OLS/Logit model to estimate the treatment uplift; Recommended regression models
Warning
Provides a warning or notification related to the statistical analysis or results, for example: – Lack of variation in the variables – Sample size is too small – Too few randomisation units which will lead to under-estimated standard errors
Recommended regression models
Besides reporting relevant statistical test results, we adopt regression models to leverage their flexibility in controlling for confounders, fixed effects and heteroskedasticity, as is commonly observed in our experiments. As mentioned in the section “A note on experimental design”, each approach has different implications on the achieved randomisation, and hence requires its own customised regression models.
Between-subject design: the observations are not independent and identically distributed (i.i.d) but clustered due to repeated observations of the same experimental units. Therefore, we set the default clustering level at the participant level in our regression models, considering that most of our between-subject experiments only take a small portion of the population (Abadie et al., 2022).
Within-subject design: this has further challenges, including spillover effects and randomisation imbalances. As a result, they often require better control of confounding factors. We adopt panel data methods and impose time fixed effects, with no option to remove them. Though users have the flexibility to define these themselves, we use hourly fixed effects as our default as we have found that these match the typical seasonality we observe in marketplace metrics. Similar to between-subject
designs, we use standard error corrections for clustered errors, and small number of clusters, as the default. Our API is flexible for users to include further controls, as well as further fixed effects to adapt the estimator to geo-timeslice designs.
Advanced tools
Apart from the pre-experiment Trusted Advisor and the post-experiment Analysis Toolbox, we have enriched this package by providing more advanced tools. Some of them are set as a default feature in the previous two components, while others are ad-hoc capabilities which the users can utilise via calling the functions directly.
Variance reduction
We bring in multiple methods to reduce variance and improve the power and sensitivity of experiments:
Stratified sampling: recognised for reducing variance during assignment
Post stratification: a post-assignment variance reduction technique
MLRATE: an extension of CUPED that allows for the use of non-linear / machine learning models
These approaches offer valuable ways to mitigate variance and improve the overall effectiveness of experiments. The experimenters can directly access these ad hoc capabilities via the package.
Multiple comparisons problem
A multiple comparisons problem occurs when multiple hypotheses are simultaneously tested, leading to a higher likelihood of false positives. To address this, we implement various statistical correction techniques in this package, as illustrated below.
Statistical correction techniques
Experimenters can specify if they have concerns about the dependency of the tests and whether the test results are expected to be negatively related. This capability will adopt the following procedures and choose the relevant tests to mitigate the risk of false positives accordingly:
False Discovery Rate (FDR) procedures, which control the expected rate of false discoveries.
Family-wise Error Rate (FWER) procedures, which control the probability of making at least one false discovery within a set of related tests referred to as a family.
Multiple treatments and unequal treatment sizes
We developed a capability to deal with experiments where there are multiple treatments. This capability employs a conservative approach to ensure that the size reaches a minimum level where any pairwise comparison between the control and treatment groups has a sufficient sample size.
Heterogeneous treatment effects
Heterogeneous treatment effects refer to a situation where the treatment effect varies across different groups or subpopulations within a larger population. For instance, it may be of interest to examine treatment effects specifically on rainy days compared to non-rainy days. We have incorporated this functionality into the tests for both experiment designs. By enabling this feature, we facilitate a more nuanced analysis that accounts for potential variations in treatment effects based on different factors or contexts.
Maintenance and support
The package is available across all internal DS/Machine Learning platforms and individual local development environments within Grab. Its source code is openly accessible to all developers within Grab and its release adheres to a semantic release standard.
In addition to the technical maintenance efforts, we have introduced a dedicated committee and a workspace to address issues that may extend beyond the scope of the package’s current capabilities.
Experiment Council
Within Grab, there is a dedicated committee known as the ‘Experiment Council’. This committee includes data scientists, analysts, and economists from various functions. One of their responsibilities is to collaborate to enhance and maintain the package, as well as guide users in effectively utilising its functionalities. The Experiment Council plays a crucial role in enhancing the overall operational excellence of conducting experiments and deriving meaningful insights from them.
GrabCausal Methodology Bank
Experimenters frequently encounter challenges regarding the feasibility of conducting experiments for causal problems. To address this concern, we have introduced an alternative workspace called GrabCausal Methodology Bank. Similar to the internal open-source nature of this project, the GrabCausal Methodology bank is open to contributions from all users within Grab. It provides a collaborative space where users can readily share their code, case studies, guidelines, and suggestions related to
causal methodologies. By fostering an open and inclusive environment, this workspace encourages knowledge sharing and promotes the advancement of causal research methods.
The workspace functions as a platform, which now exhibits a wide range of commonly used methods, including Diff-in-Diff, Event studies, Regression Discontinuity Designs (RDD), Instrumental Variables (IV), Bayesian structural time series, and Bunching. Additionally, we are dedicated to incorporating more, such as Synthetic control, Double ML (Chernozhukov et al. 2018), DAG discovery/validation, etc., to further enhance our offerings in this space.
Learnings
Over the past few years, we have invested in developing and expanding this package. Our initial motivation was humble yet motivating – to contribute to improving the quality of experimentation at Grab, helping it develop from its initial start-up modus operandi to a more consolidated, rigorous, and guided approach.
Throughout this journey, we have learned that prioritisation holds the utmost significance in open-source projects of this nature; the majority of user demands can be met through relatively small yet pivotal efforts. By focusing on these core capabilities, we avoid spreading resources too thinly across all areas at the initial stage of planning and development.
Meanwhile, we acknowledge that there is still a significant journey ahead. While the package now focuses solely on individual experiments, an inherent challenge in online-controlled experimentation platforms is the interference between experiments (Gupta, et al, 2019). A recent development in the field is to embrace simultaneous tests (Microsoft, Google, Spotify and booking.com and Optimizely), and to carefully consider the tradeoff between accuracy and velocity.
The key to overcoming this challenge will be a close collaboration between the community of experimenters, the teams developing this unified toolkit, and the GrabX platform engineers. In particular, the platform developers will continue to enrich the experimentation SDK by providing diverse assignment strategies, sampling mechanisms, and user interfaces to manage potential inference risks better. Simultaneously, the community of experimenters can coordinate among themselves effectively to
avoid severe interference, which will also be monitored by GrabX. Last but not least, the development of this unified toolkit will also focus on monitoring, evaluating, and managing inter-experiment interference.
In addition, we are committed to keeping this package in sync with industry advancements. Many existing tools in this package, despite being labelled as “advanced” in the earlier discussions, are still relatively simplified. For instance,
Incorporating standard errors clustering based on the diverse assignment and sampling strategies requires attention (Abadie, et al, 2023).
Sequential testing will play a vital role in detecting uplifts earlier and safely, avoiding p-hacking. One recent innovation is the “always valid inference” (Johari, et al., 2022)
The advancements in investigating heterogeneous effects, such as Causal Forest (Athey and Wager, 2019), have extended beyond linear approaches, now incorporating nonlinear and more granular analyses.
Estimating the long-term treatment effects observed from short-term follow-ups is also a long-term objective, and one approach is using a Surrogate Index (Athey, et al 2019).
Continuous effort is required to stay updated and informed about the latest advancements in statistical testing methodologies, to ensure accuracy and effectiveness.
This article marks the beginning of our journey towards automating the experimentation and product decision-making process among the data scientist community. We are excited about the prospect of expanding the toolkit further in these directions. Stay tuned for more updates and posts.
References
Abadie, Alberto, et al. “When should you adjust standard errors for clustering?.” The Quarterly Journal of Economics 138.1 (2023): 1-35.
Athey, Susan, et al. “The surrogate index: Combining short-term proxies to estimate long-term treatment effects more rapidly and precisely.” No. w26463. National Bureau of Economic Research, 2019.
Athey, Susan, and Stefan Wager. “Estimating treatment effects with causal forests: An application.” Observational studies 5.2 (2019): 37-51.
Chernozhukov, Victor, et al. “Double/debiased machine learning for treatment and structural parameters.” (2018): C1-C68.
Facure, Matheus. Causal Inference in Python. O’Reilly Media, Inc., 2023.
Gupta, Somit, et al. “Top challenges from the first practical online controlled experiments summit.” ACM SIGKDD Explorations Newsletter 21.1 (2019): 20-35.
Huntington-Klein, Nick. The Effect: An Introduction to Research Design and Causality. CRC Press, 2021.
Imbens, Guido W. and Donald B. Rubin. Causal Inference for Statistics, Social, and Biomedical Sciences: An Introduction. Cambridge University Press, 2015.
Johari, Ramesh, et al. “Always valid inference: Continuous monitoring of a/b tests.” Operations Research 70.3 (2022): 1806-1821.
List, John A., Sally Sadoff, and Mathis Wagner. “So you want to run an experiment, now what? Some simple rules of thumb for optimal experimental design.” Experimental Economics 14 (2011): 439-457.
Moffatt, Peter. Experimetrics: Econometrics for Experimental Economics. Bloomsbury Publishing, 2020.
Join us
Grab is the leading superapp platform in Southeast Asia, providing everyday services that matter to consumers. More than just a ride-hailing and food delivery app, Grab offers a wide range of on-demand services in the region, including mobility, food, package and grocery delivery services, mobile payments, and financial services across 428 cities in eight countries.
Powered by technology and driven by heart, our mission is to drive Southeast Asia forward by creating economic empowerment for everyone. If this mission speaks to you, join our team today!
One of the hottest topics in AI right now is RAG, or retrieval-augmented generation, which is a retrieval method used by some AI tools to improve the quality and relevance of their outputs.
Organizations want AI tools that use RAG because it makes those tools aware of proprietary data without the effort and expense of custom model training. RAG also keeps models up to date. When generating an answer without RAG, models can only draw upon data that existed when they were trained. With RAG, on the other hand, models can leverage a private database of newer information for more informed responses.
We talked to GitHub Next’s Senior Director of Research, Idan Gazit, and Software Engineer, Colin Merkel, to learn more about RAG and how it’s used in generative AI tools.
Why everyone’s talking about RAG
One of the reasons you should always verify outputs from a generative AI tool is because its training data has a knowledge cut-off date. While models are able to produce outputs that are tailored to a request, they can only reference information that existed at the time of their training. But with RAG, an AI tool can use data sources beyond its model’s training data to generate an output.
The difference between RAG and fine-tuning
Most organizations currently don’t train their own AI models. Instead, they customize pre-trained models to their specific needs, often using RAG or fine-tuning. Here’s a quick breakdown of how these two strategies differ.
Fine-tuning requires adjusting a model’s weights, which results in a highly customized model that excels at a specific task. It’s a good option for organizations that rely on codebases written in a specialized language, especially if the language isn’t well-represented in the model’s original training data.
RAG, on the other hand, doesn’t require weight adjustment. Instead, it retrieves and gathers information from a variety of data sources to augment a prompt, which results in an AI model generating a more contextually relevant response for the end user.
Some organizations start with RAG and then fine-tune their models to accomplish a more specific task. Other organizations find that RAG is a sufficient method for AI customization alone.
How AI models use context
In order for an AI tool to generate helpful responses, it needs the right context. This is the same dilemma we face as humans when making a decision or solving a problem. It’s hard to do when you don’t have the right information to act on.
So, let’s talk more about context in the context () of generative AI:
Today’s generative AI applications are powered by large language models (LLMs) that are structured as transformers, and all transformer LLMs have a context window— the amount of data that they can accept in a single prompt. Though context windows are limited in size, they can and will continue to grow larger as more powerful models are released.
Input data will vary depending on the AI tool’s capabilities. For instance, when it comes to GitHub Copilot in the IDE, input data comprises all of the code in the file that you’re currently working on. This is made possible because of our Fill-in-the-Middle (FIM) paradigm, which makes GitHub Copilot aware of both the code before your cursor (the prefix) and after your cursor (the suffix).
GitHub Copilot also processes code from your other open tabs (a process we call neighboring tabs) to potentially find and add relevant information to the prompt. When there are a lot of open tabs, GitHub Copilot will scan the most recently reviewed ones.
Because of the context window’s limited size, the challenge of ML engineers is to figure out what input data to add to the prompt and in what order to generate the most relevant suggestion from the AI model. This task is known as prompt engineering.
How RAG enhances an AI model’s contextual understanding
With RAG, an LLM can go beyond training data and retrieve information from a variety of data sources, including customized ones.
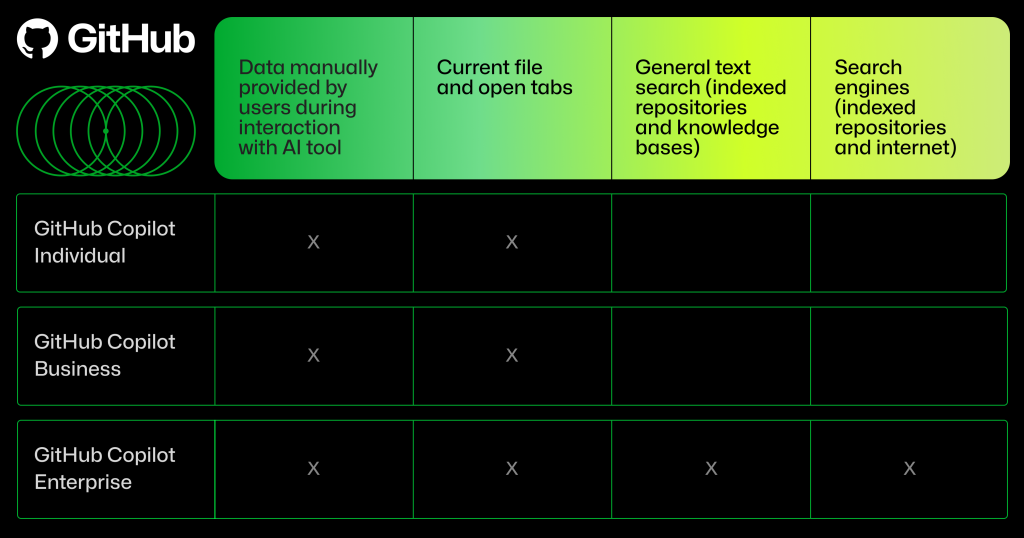
When it comes to GitHub Copilot Chat within GitHub.com and in the IDE, input data can include your conversation with the chat assistant, whether it’s code or natural language, through a process called in-context learning. It can also include data from indexed repositories (public or private), a collection of Markdown documentation across repositories (that we refer to as knowledge bases), and results from integrated search engines. From these other sources, RAG will retrieve additional data to augment the initial prompt. As a result, it can generate a more relevant response.
The type of input data used by GitHub Copilot will depend on which GitHub Copilot plan you’re using.
RAG and semantic search
Unlike keyword search or Boolean search operators, an ML-powered semantic search system uses its training data to understand the relationship between your keywords. So, rather than view, for example, “cats” and “kittens” as independent terms as you would in a keyword search, a semantic search system can understand, from its training, that those words are often associated with cute videos of the animal. Because of this, a search for just “cats and kittens” might rank a cute animal video as a top search result.
How does semantic search improve the quality of RAG retrievals? When using a customized database or search engine as a RAG data source, semantic search can improve the context added to the prompt and overall relevance of the AI-generated output.
The semantic search process is at the heart of retrieval. “It surfaces great examples that often elicit great results,” Gazit says.
Developers can use Copilot Chat on GitHub.com to ask questions and receive answers about a codebase in natural language, or surface relevant documentation and existing solutions.
RAG data sources: Where RAG uses semantic search
You’ve probably read dozens of articles (including some of our own) that talk about RAG, vector databases, and embeddings. And even if you haven’t, here’s something you should know: RAG doesn’t require embeddings or vector databases.
A RAG system can use semantic search to retrieve relevant documents, whether from an embedding-based retrieval system, traditional database, or search engine. The snippets from those documents are then formatted into the model’s prompt. We’ll provide a quick recap of vector databases and then, using GitHub Copilot Enterprise as an example, cover how RAG retrieves data from a variety of sources.
Vector databases
Vector databases are optimized for storing embeddings of your repository code and documentation. They allow us to use novel search parameters to find matches between similar vectors.
To retrieve data from a vector database, code and documentation are converted into embeddings, a type of high-dimensional vector, to make them searchable by a RAG system.
Here’s how RAG retrieves data from vector databases: while you code in your IDE, algorithms create embeddings for your code snippets, which are stored in a vector database. Then, an AI coding tool can search that database by embedding similarity to find snippets from across your codebase that are related to the code you’re currently writing and generate a coding suggestion. Those snippets are often highly relevant context, enabling an AI coding assistant to generate a more contextually relevant coding suggestion. GitHub Copilot Chat uses embedding similarity in the IDE and on GitHub.com, so it finds code and documentation snippets related to your query.
Embedding similarity is incredibly powerful because it identifies code that has subtle relationships to the code you’re editing.
“Embedding similarity might surface code that uses the same APIs, or code that performs a similar task to yours but that lives in another part of the codebase,” Gazit explains. “When those examples are added to a prompt, the model’s primed to produce responses that mimic the idioms and techniques that are native to your codebase—even though the model was not trained on your code.”
General text search and search engines
With a general text search, any documents that you want to be accessible to the AI model are indexed ahead of time and stored for later retrieval. For instance, RAG in GitHub Copilot Enterprise can retrieve data from files in an indexed repository and Markdown files across repositories.
RAG can also retrieve information from external and internal search engines. When integrated with an external search engine, RAG can search and retrieve information from the entire internet. When integrated with an internal search engine, it can also access information from within your organization, like an internal website or platform. Integrating both kinds of search engines supercharges RAG’s ability to provide relevant responses.
For instance, GitHub Copilot Enterprise integrates both Bing, an external search engine, and an internal search engine built by GitHub into Copilot Chat on GitHub.com. Bing integration allows GitHub Copilot Chat to conduct a web search and retrieve up-to-date information, like about the latest Java release. But without a search engine searching internally, ”Copilot Chat on GitHub.com cannot answer questions about your private codebase unless you provide a specific code reference yourself,” explains Merkel, who helped to build GitHub’s internal search engine from scratch.
Here’s how this works in practice. When a developer asks a question about a repository to GitHub Copilot Chat in GitHub.com, RAG in Copilot Enterprise uses the internal search engine to find relevant code or text from indexed files to answer that question. To do this, the internal search engine conducts a semantic search by analyzing the content of documents from the indexed repository, and then ranking those documents based on relevance. GitHub Copilot Chat then uses RAG, which also conducts a semantic search, to find and retrieve the most relevant snippets from the top-ranked documents. Those snippets are added to the prompt so GitHub Copilot Chat can generate a relevant response for the developer.
Key takeaways about RAG
RAG offers an effective way to customize AI models, helping to ensure outputs are up to date with organizational knowledge and best practices, and the latest information on the internet.
GitHub Copilot uses a variety of methods to improve the quality of input data and contextualize an initial prompt, and that ability is enhanced with RAG. What’s more, the RAG retrieval method in GitHub Copilot Enterprise goes beyond vector databases and includes data sources like general text search and search engine integrations, which provides even more cost-efficient retrievals.
Context is everything when it comes to getting the most out of an AI tool. To improve the relevance and quality of a generative AI output, you need to improve the relevance and quality of the input.
As Gazit says, “Quality in, quality out.”
Looking to bring the power of GitHub Copilot Enterprise to your organization? Learn more about GitHub Copilot Enterprise or get started now.
Iris (/ˈaɪrɪs/), a name inspired by the Olympian mythological figure who personified the rainbow and served as the messenger of the gods, is a comprehensive observability platform for Extract, Transform, Load (ETL) jobs. Just as the mythological Iris connected the gods to humanity, our Iris platform bridges the gap between raw data and meaningful insights, serving the needs of data-driven organisations. Specialising in meticulous monitoring and tracking of Spark and Presto jobs, Iris stands as a transformative tool for peak observability and effective decision-making.
Iris captures critical job metrics right at the Java Virtual Machine (JVM) level, including but not limited to runtime, CPU and memory utilisation rates, garbage collection statistics, stage and task execution details, and much more.
Iris not only regularly records these metrics but also supports real-time monitoring and offline analytics of metrics in the data lake. This gives you multi-faceted control and insights into the operational aspects of your workloads.
Iris gives you an overview of your jobs, predicts if your jobs are over or under-provisioned, and provides suggestions on how to optimise resource usage and save costs.
Understanding the needs
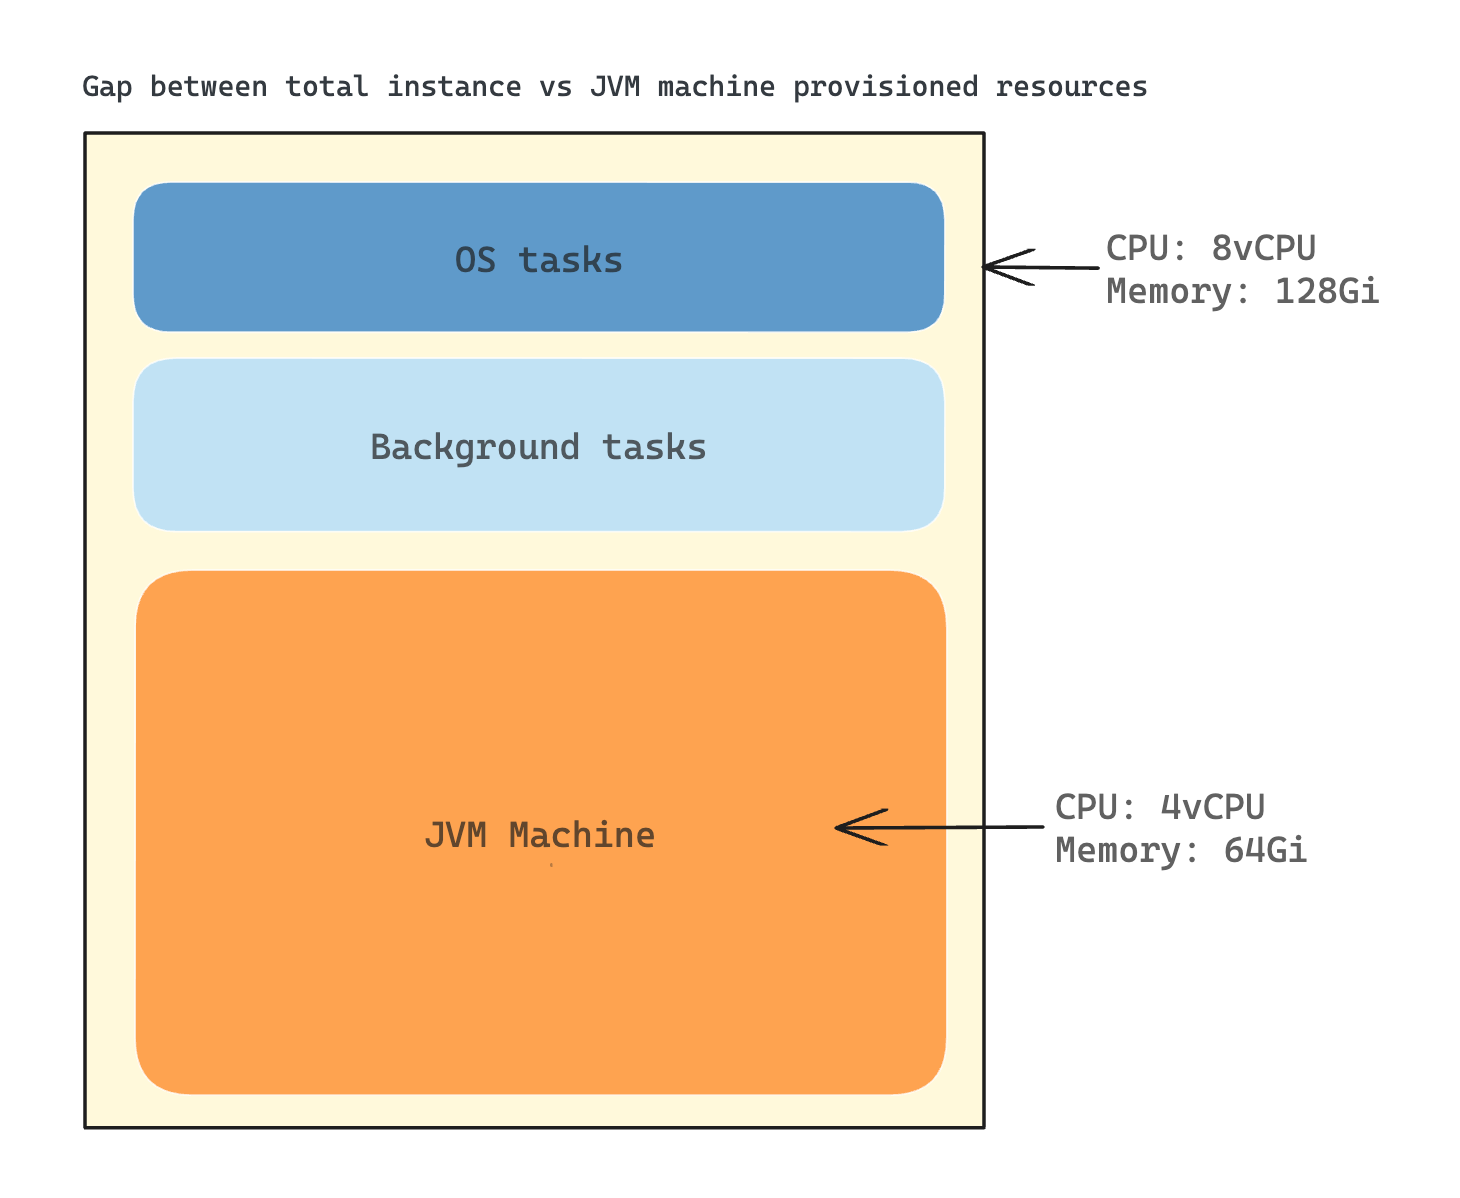
When examining ETL job monitoring across various platforms, a common deficiency became apparent. Existing tools could only provide CPU and memory usage data at the instance level, where an instance could refer to an EC2 unit or a Kubernetes pod with resources bound to the container level.
However, this CPU and memory usage data included usage from the operating system and other background tasks, making it difficult to isolate usage specific to Spark jobs (JVM level). A sizeable fraction of resource consumption, thus, could not be attributed directly to our ETL jobs. This lack of granularity posed significant challenges when trying to perform effective resource optimisation for individual jobs.
Gap between total instance and JVM provisioned resources
The situation was further complicated when compute instances were shared among various jobs. In such cases, determining the precise resource consumption for a specific job became nearly impossible. This made in-depth analysis and performance optimisation of specific jobs a complex and often ineffective process.
In the initial stages of my career in Spark, I took the reins of handling SEGP ETL jobs deployed in Chimera. Then, Chimera did not possess any tool for observing and understanding SEGP jobs. The lack of an efficient tool for close-to-real-time visualisation of Spark cluster/job metrics, profiling code class/function runtime durations, and investigating deep-level job metrics to assess CPU and memory usage, posed a significant challenge even back then.
In the quest for solutions within Grab, I found no tool that could fulfill all these needs. This prompted me to extend my search beyond the organisation, leading me to discover that Uber had an exceptional tool known as the JVM Profiler. This tool could collect JVM metrics and profile the job. Further research also led me to sparkMeasure, a standalone tool known for its ability to measure Spark metrics on-the-fly without any code changes.
This personal research and journey highlights the importance of a comprehensive, in-depth observability tool – emphasising the need that Iris aims to fulfill in the world of ETL job monitoring. Through this journey, Iris was ideated, named after the Greek deity, encapsulating the mission to bridge the gap between the realm of raw ETL job metrics and the world of actionable insights.
Observability with Iris
Platform architecture
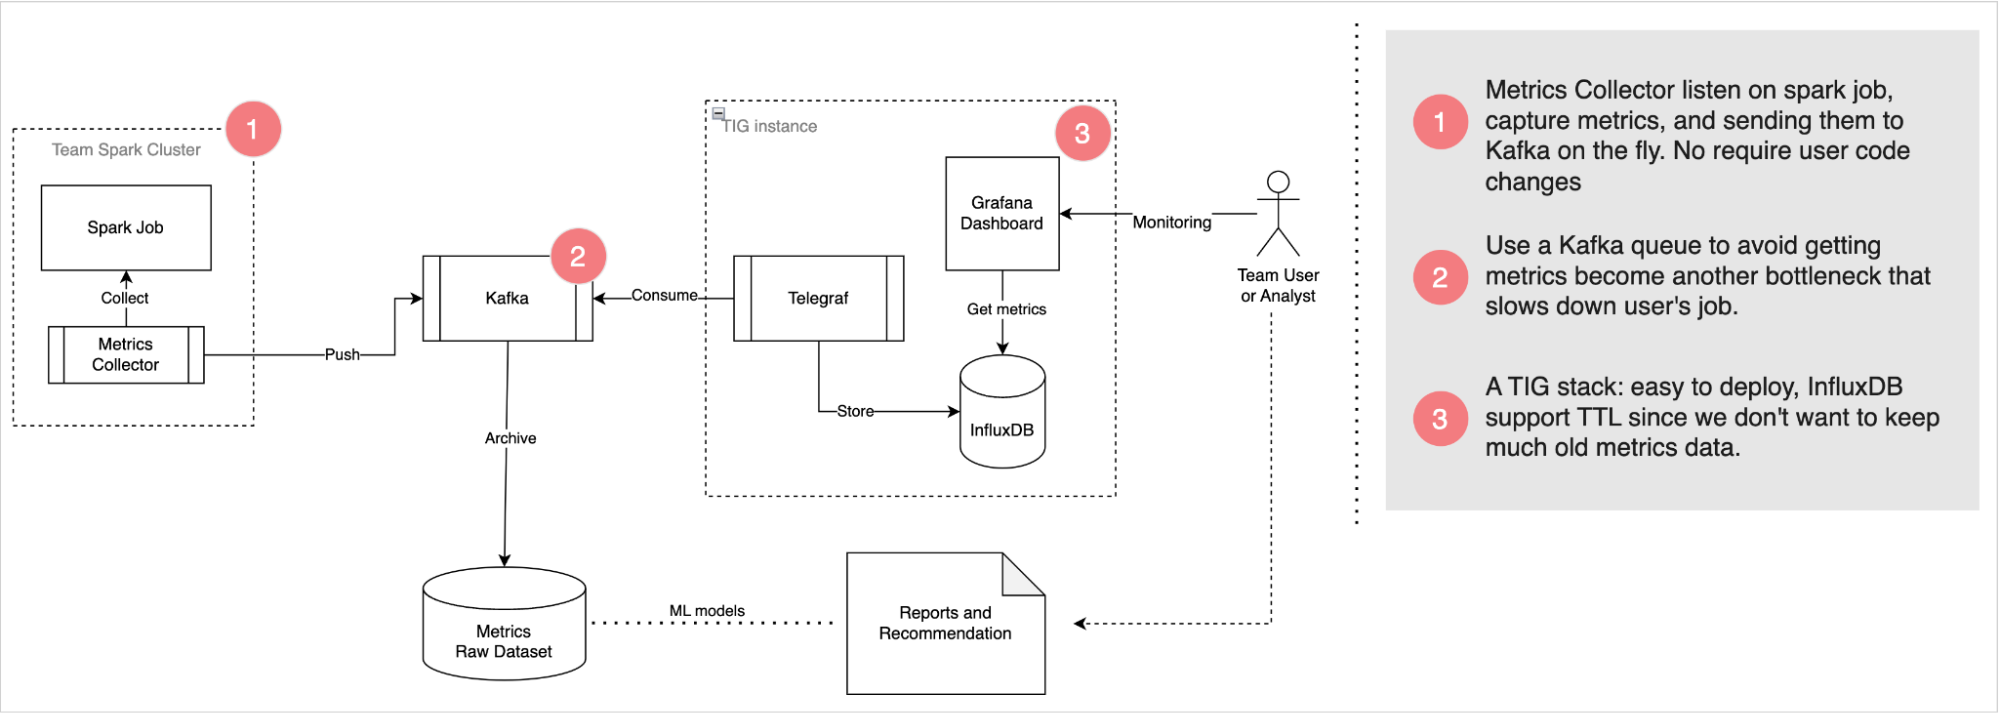
Platform architecture of Iris
Iris’s robust architecture is designed to smartly deliver observability into Spark jobs with high reliability. It consists of three main modules: Metrics Collector, Kafka Queue, and Telegraf, InfluxDB, and Grafana (TIG) Stack.
Metrics Collector: This module listens to Spark jobs, collects metrics, and funnels them to the Kafka queue. What sets this apart is its unobstructive nature – there is no need for end-users to update their application code or notebook.
Kafka Queue: Serving as an asynchronous deliverer of metrics messages, Kafka is leveraged to prevent Iris from becoming another bottleneck slowing down user jobs. By functioning as a message queue, it enables the efficient processing of metric data.
TIG Stack: This component is utilised for real-time monitoring, making visualising performance metrics a cinch. The TIG stack proves to be an effective solution for real-time data visualisation.
For offline analytics, Iris pushes metrics data from Kafka into our data lake. This creates a wealth of historical data that can be utilised for future research, analysis, and predictions. The strategic combination of real-time monitoring and offline analysis forms the basis of Iris’s ability to provide valuable insights.
Next, we will delve into how Iris collects the metrics.
Data collection
Iris’s metrics is now primarily driven by two tools that operate under the Metrics Collector module: JVM Profiler and sparkMeasure.
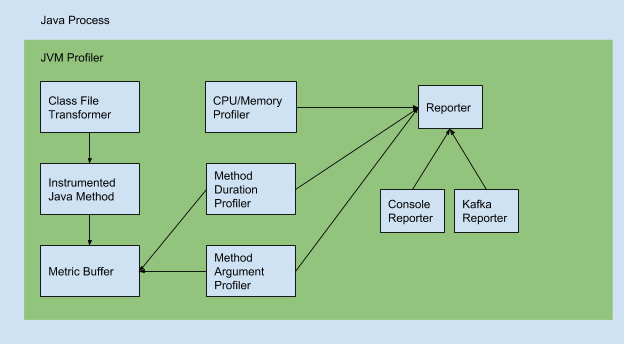
JVM Profiler
As mentioned earlier, JVM Profiler is an exceptional tool that helps to collect and profile metrics at JVM level.
Java process for the JVM Profiler tool
Uber JVM Profiler supports the following features:
Debug memory usage for all your Spark application executors, including java heap memory, non-heap memory, native memory (VmRSS, VmHWM), memory pool, and buffer pool (directed/mapped buffer).
Debug CPU usage, garbage collection time for all Spark executors.
Debug arbitrary Java class methods (how many times they run, how long they take), also called Duration Profiling.
Debug arbitrary Java class method call and trace its argument value, also known as Argument Profiling.
Do Stacktrack Profiling and generate flamegraph to visualise CPU time spent for the Spark application.
Debug I/O metrics (disk read/write bytes for the application, CPU iowait for the machine).
Debug JVM Thread Metrics like Count of Total Threads, Peak Threads, Live/Active Threads, and newThreads.
A list of all metrics and information corresponding to them can be found here.
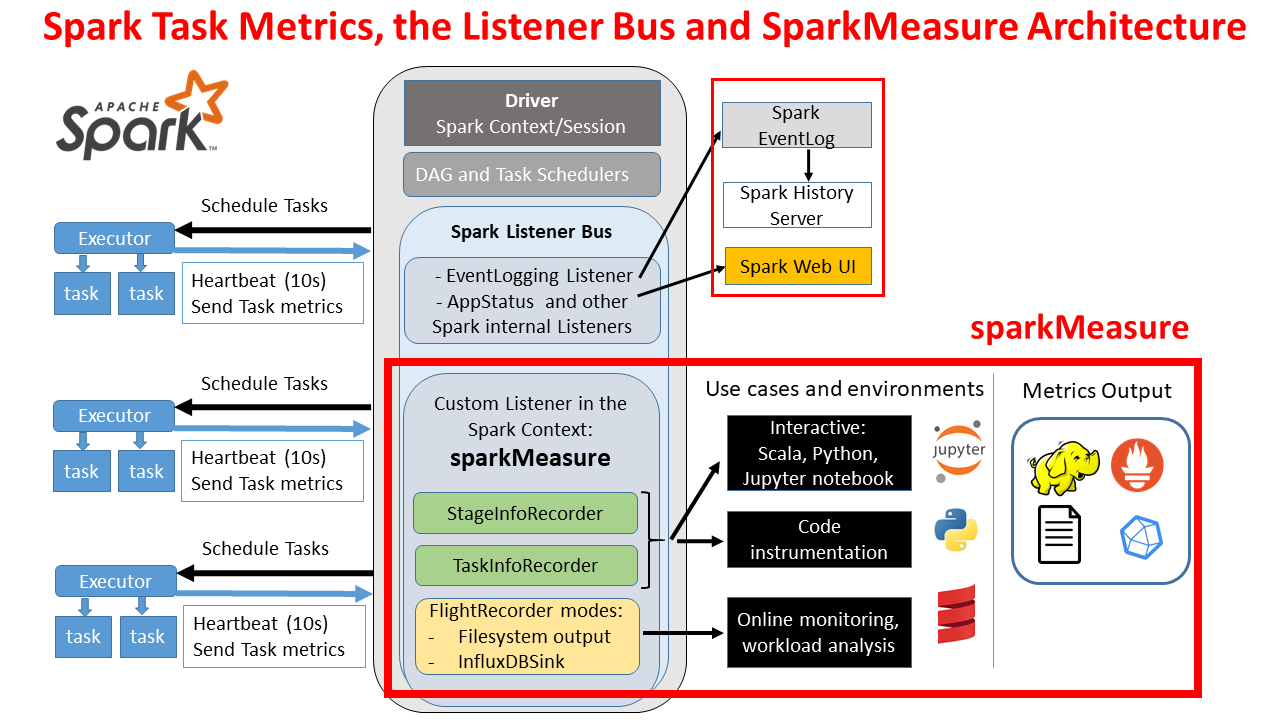
sparkMeasure
Complementing the JVM Profiler is sparkMeasure, a standalone tool that was built to robustly capture Spark job-specific metrics.
Architecture of Spark Task Metrics, Listener Bus, and sparkMeasure (Source)
It is registered as a custom listener and operates by collection built-in metrics that Spark exchanges between the driver node and executor nodes. Its standout feature is the ability to collect all metrics supported by Spark, as defined in Spark’s official documentation here.
Example stage metrics collected by sparkMeasure (Source code)
The architecture of Iris is designed to efficiently route metrics to two key destinations:
Real-time datasets: InfluxDB
Offline datasets: GrabTech Datalake in AWS
Real-time dataset
Freshness/latency: 5 to 10 seconds
All metrics flowing in through Kafka topics are instantly wired into InfluxDB. A crucial part of this process is accomplished by Telegraf, a plugin-driven server agent used for collecting and sending metrics. Acting as a Kafka consumer, Telegraf listens to each Kafka topic according to its corresponding metrics profiling. It parses the incoming JSON messages and extracts crucial data points (such as role, hostname, jobname, etc.). Once the data is processed, Telegraf writes it into the InfluxDB.
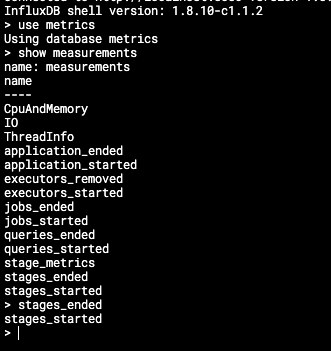
InfluxDB organises the stored data in what we call ‘measurements’, which could analogously be considered as tables in traditional relational databases.
In Iris’s context, we have structured our real-time data into the following crucial measurements:
CpuAndMemory: This measures CPU and memory-related metrics, giving us insights into resource utilisation by Spark jobs.
I/O: This records input/output metrics, providing data on the reading and writing operations happening during the execution of jobs.
ThreadInfo: This measurement holds data related to job threading, allowing us to monitor concurrency and synchronisation aspects.
application_started and application_ended: These measurements allow us to track Spark application lifecycles, from initiation to completion.
executors_started and executors_removed: These measurements give us a look at the executor dynamics during Spark application execution.
jobs_started and jobs_ended: These provide vital data points relating to the lifecycle of individual Spark jobs within applications.
queries_started and queries_ended: These measurements are designed to track the lifecycle of individual Spark SQL queries.
stage_metrics, stages_started, and stages_ended: These measurements help monitor individual stages within Spark jobs, a valuable resource for tracking the job progress and identifying potential bottlenecks.
The real-time data collected in these measurements form the backbone of the monitoring capabilities of Iris, providing an accurate and current picture of Spark job performances.
Offline dataset
Freshness/latency: 1 hour
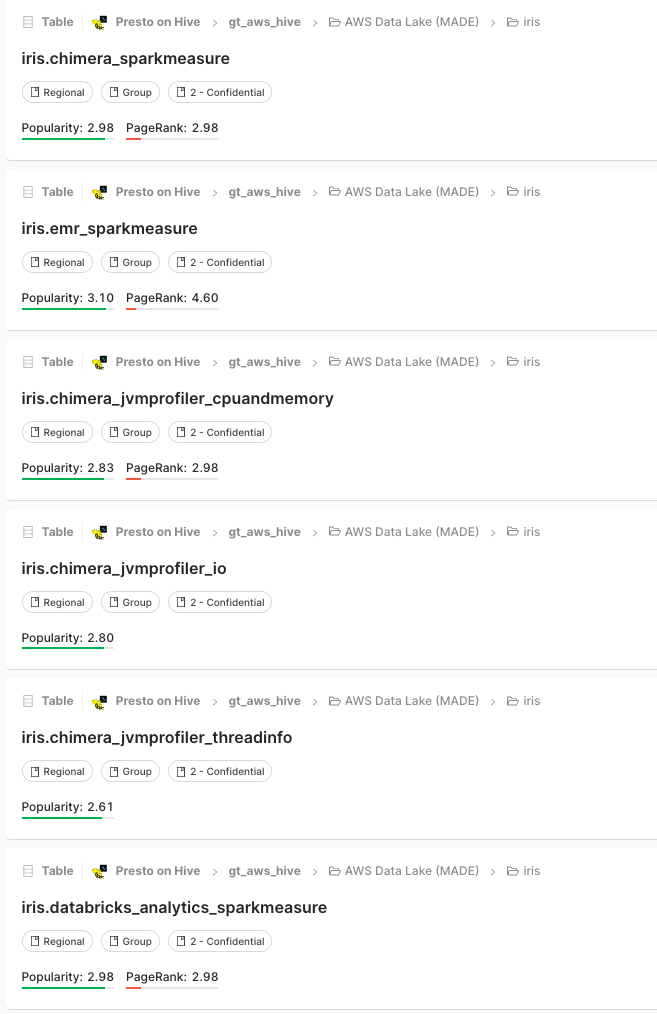
In addition to real-time data management with InfluxDB, Iris is also responsible for routing metrics to our offline data storage in the Grab Tech Datalake for long-term trend studies, pattern analysis, and anomaly detection.
The metrics from Kafka are periodically synchronised to the Amazon S3 tables under the iris schema in the Grab Tech AWS catalogue. This valuable historical data from Kafka is meticulously organised with a one-to-one mapping between the platform or Kafka topic to the table in the iris schema. For example: iris.chimera_jvmprofiler_cpuandmemory map with prd-iris-chimera-jvmprofiler-cpuandmemory Kafka topic.
This streamlined organisation means you can write queries to retrieve information from the AWS dataset very similarly to how you would do it from InfluxDB. Whether it’s CPU and memory usage, I/O, thread info, or spark metrics, you can conveniently fetch historical data for your analysis.
Data visualisation
A well-designed visual representation makes it easier to see patterns, trends, and outliers in groups of data. Iris employs different visualisation tools based on whether the data is real-time or historical.
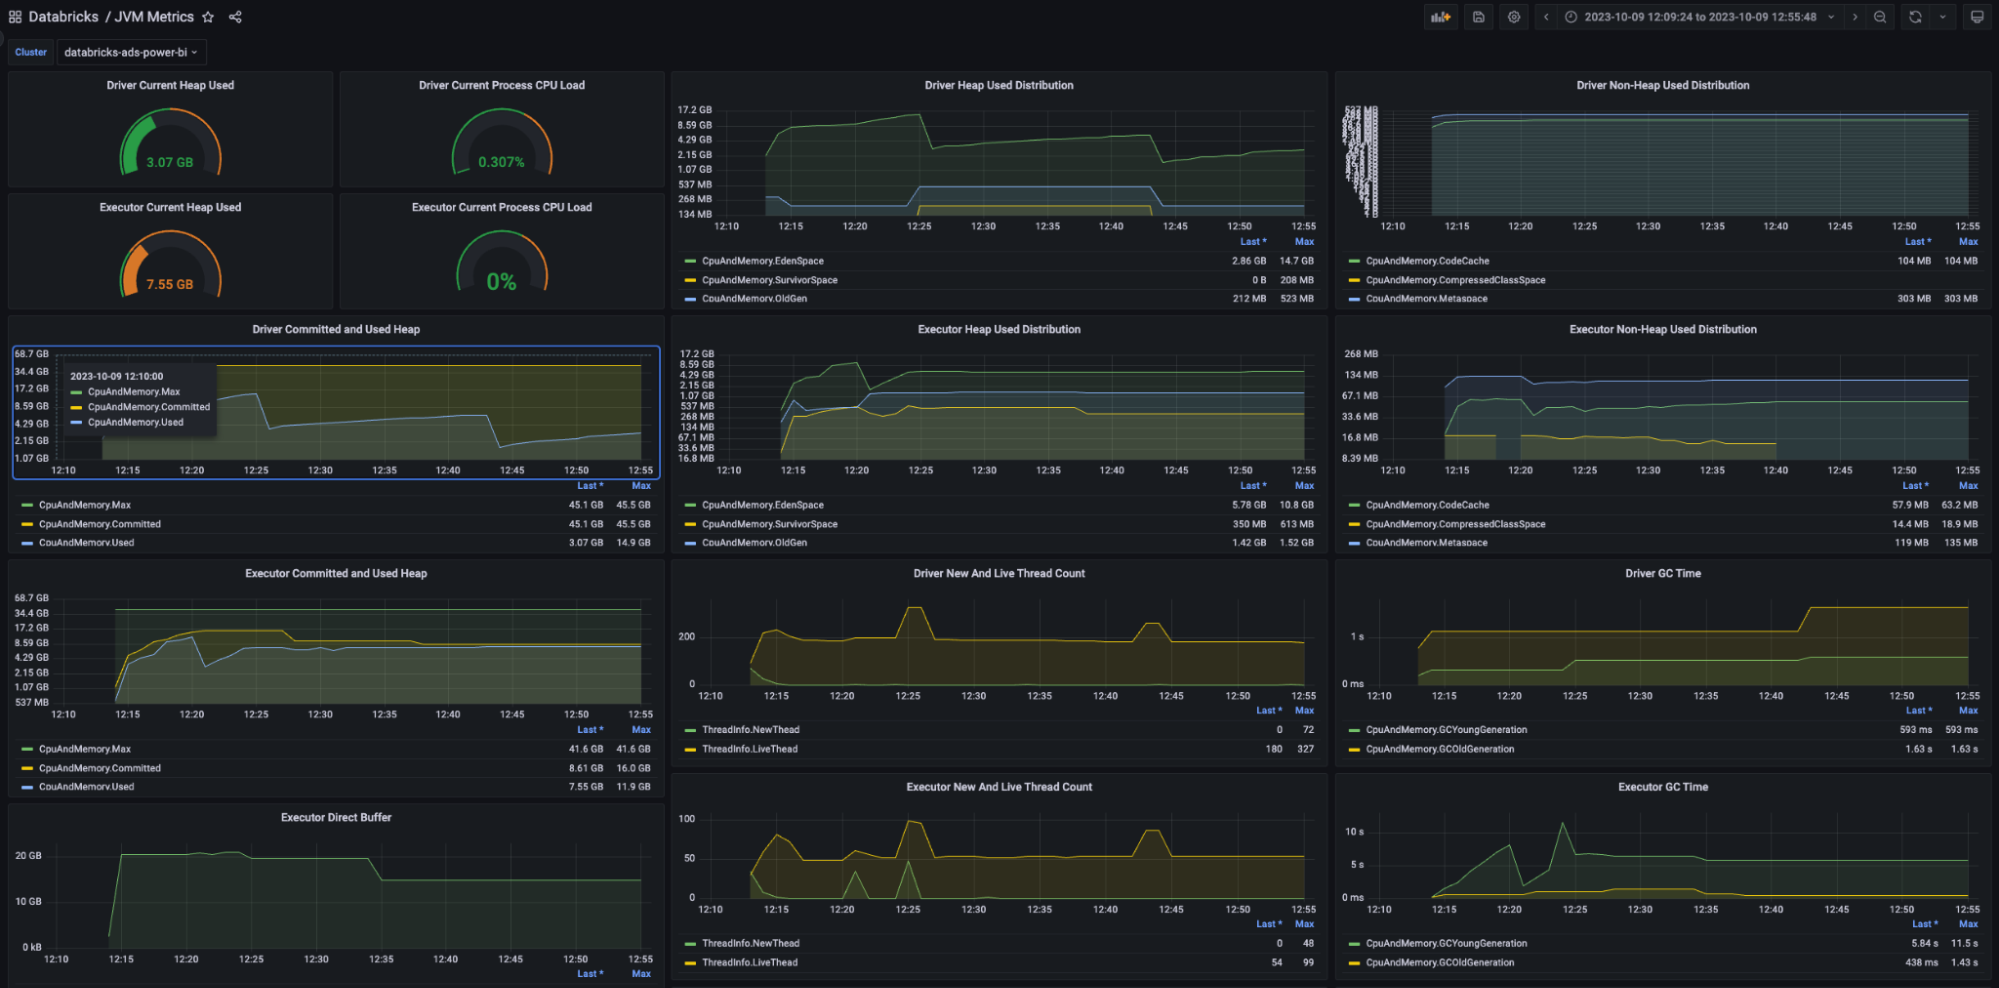
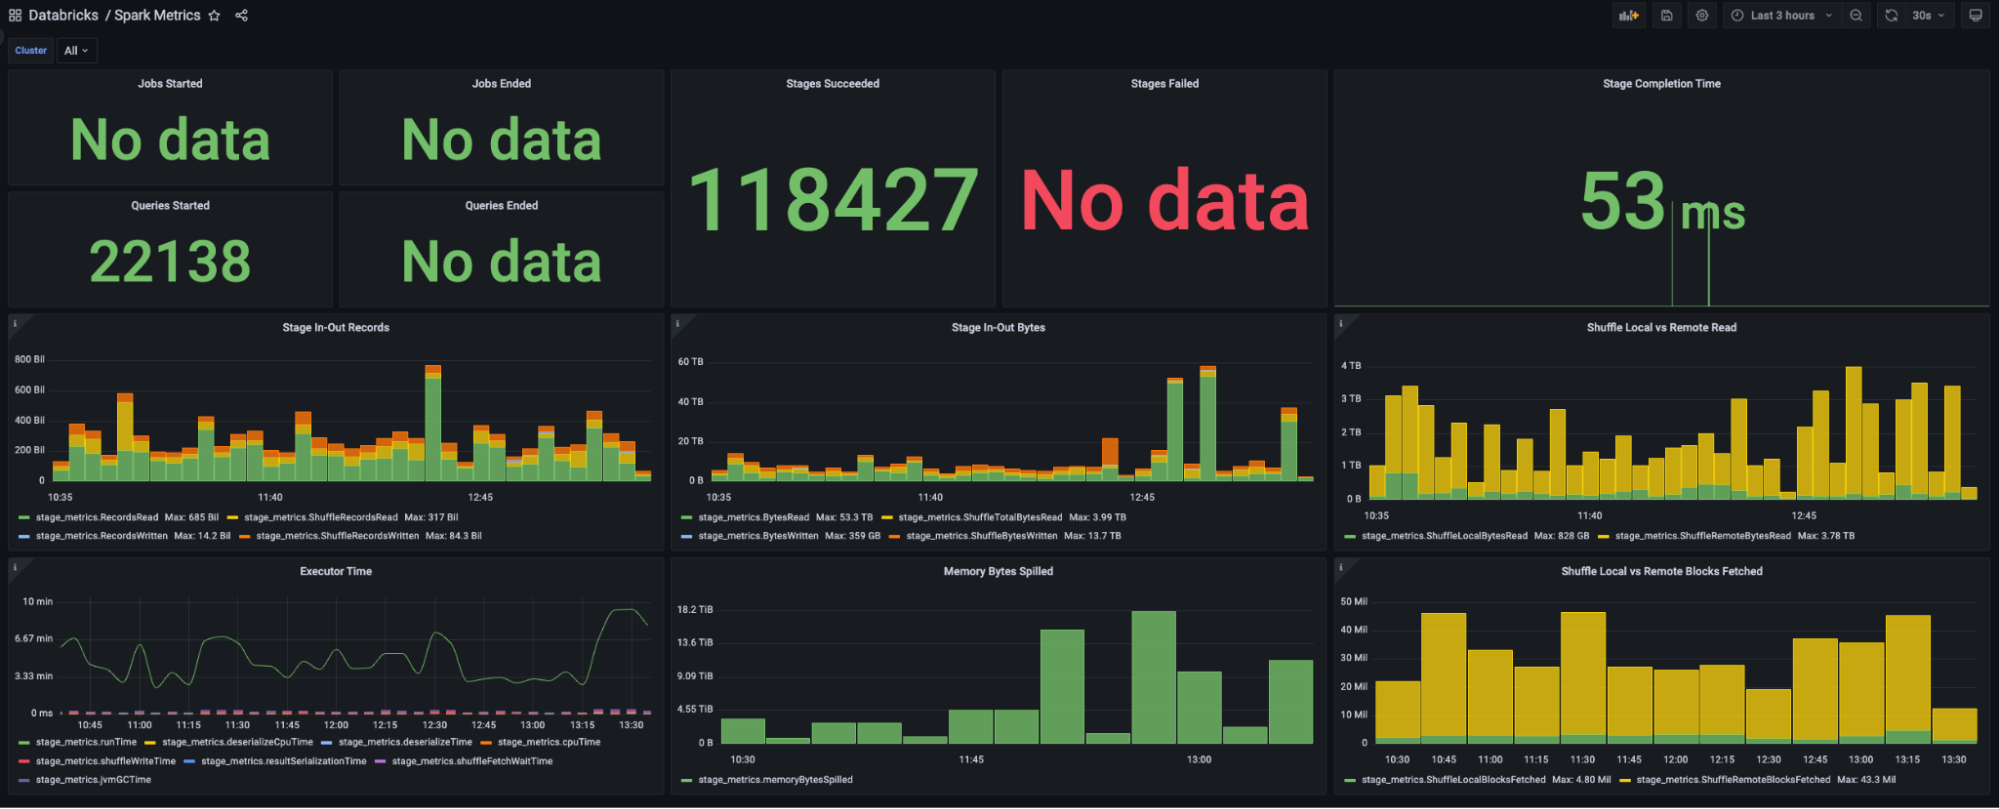
Real-Time data visualisation – Grafana
Iris uses Grafana for showcasing real-time data. For each platform, two primary dashboards have been set up: JVM metrics and Spark metrics.
JVM metrics dashboard: This dashboard is designed to display information related to the JVM.
Spark metrics dashboard: This dashboard primarily focuses on visualising Spark-specific elements.
Offline data visualisation
While real-time visualisation is crucial for immediate awareness and decision-making, visualising historical data provides invaluable insights about long-term trends, patterns, and anomalies. Developers can query the raw or aggregated data from the Iris tables for their specific analyses.
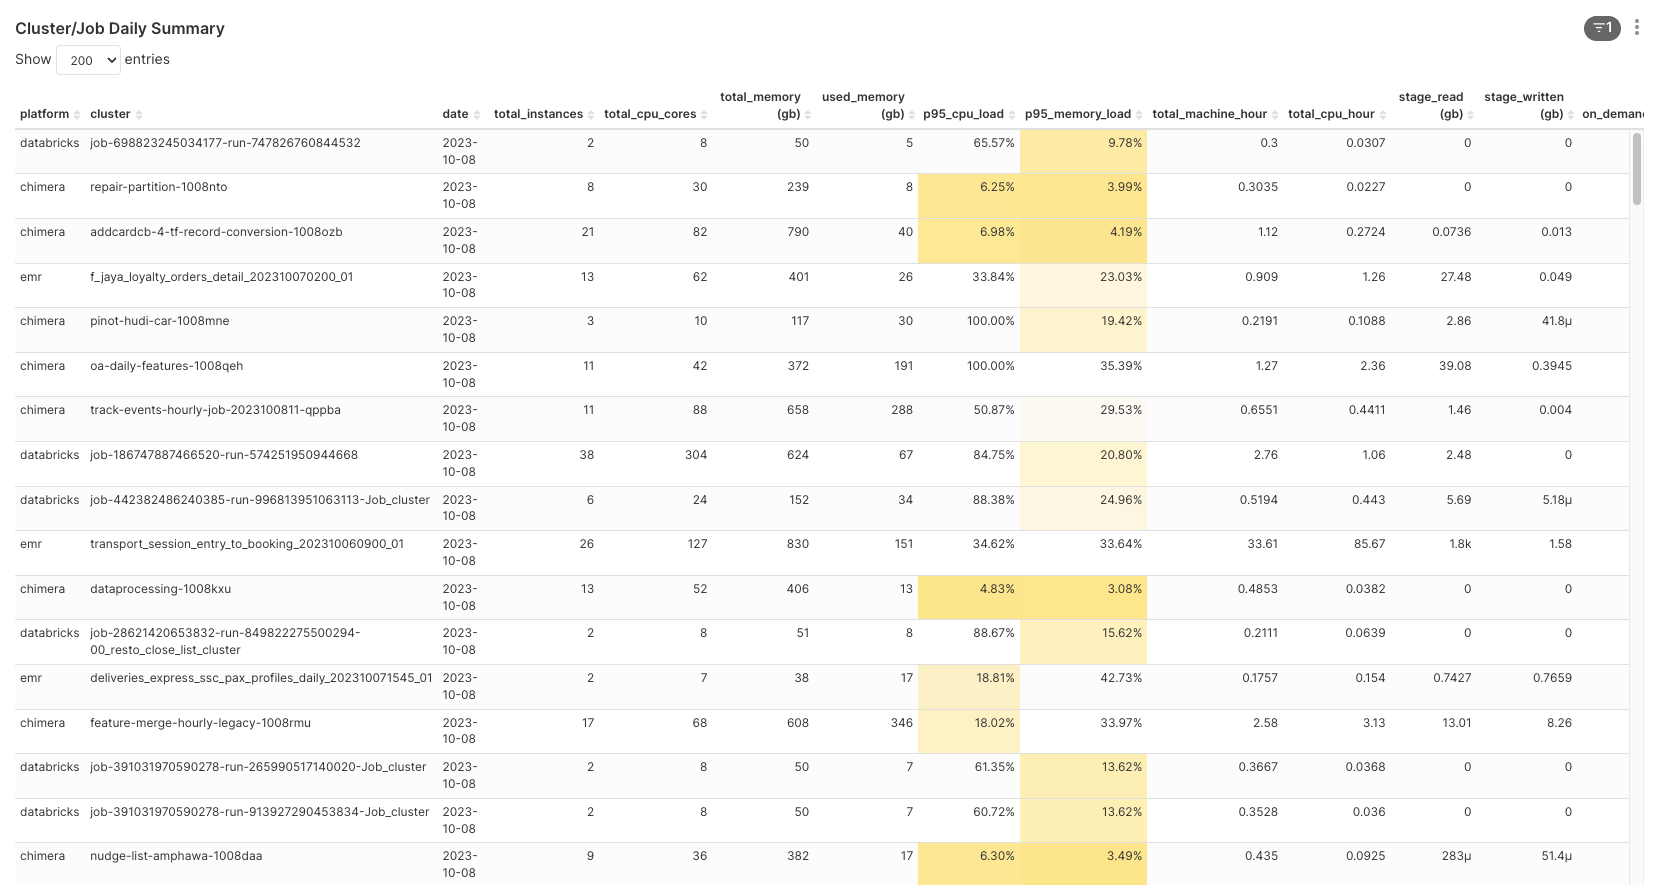
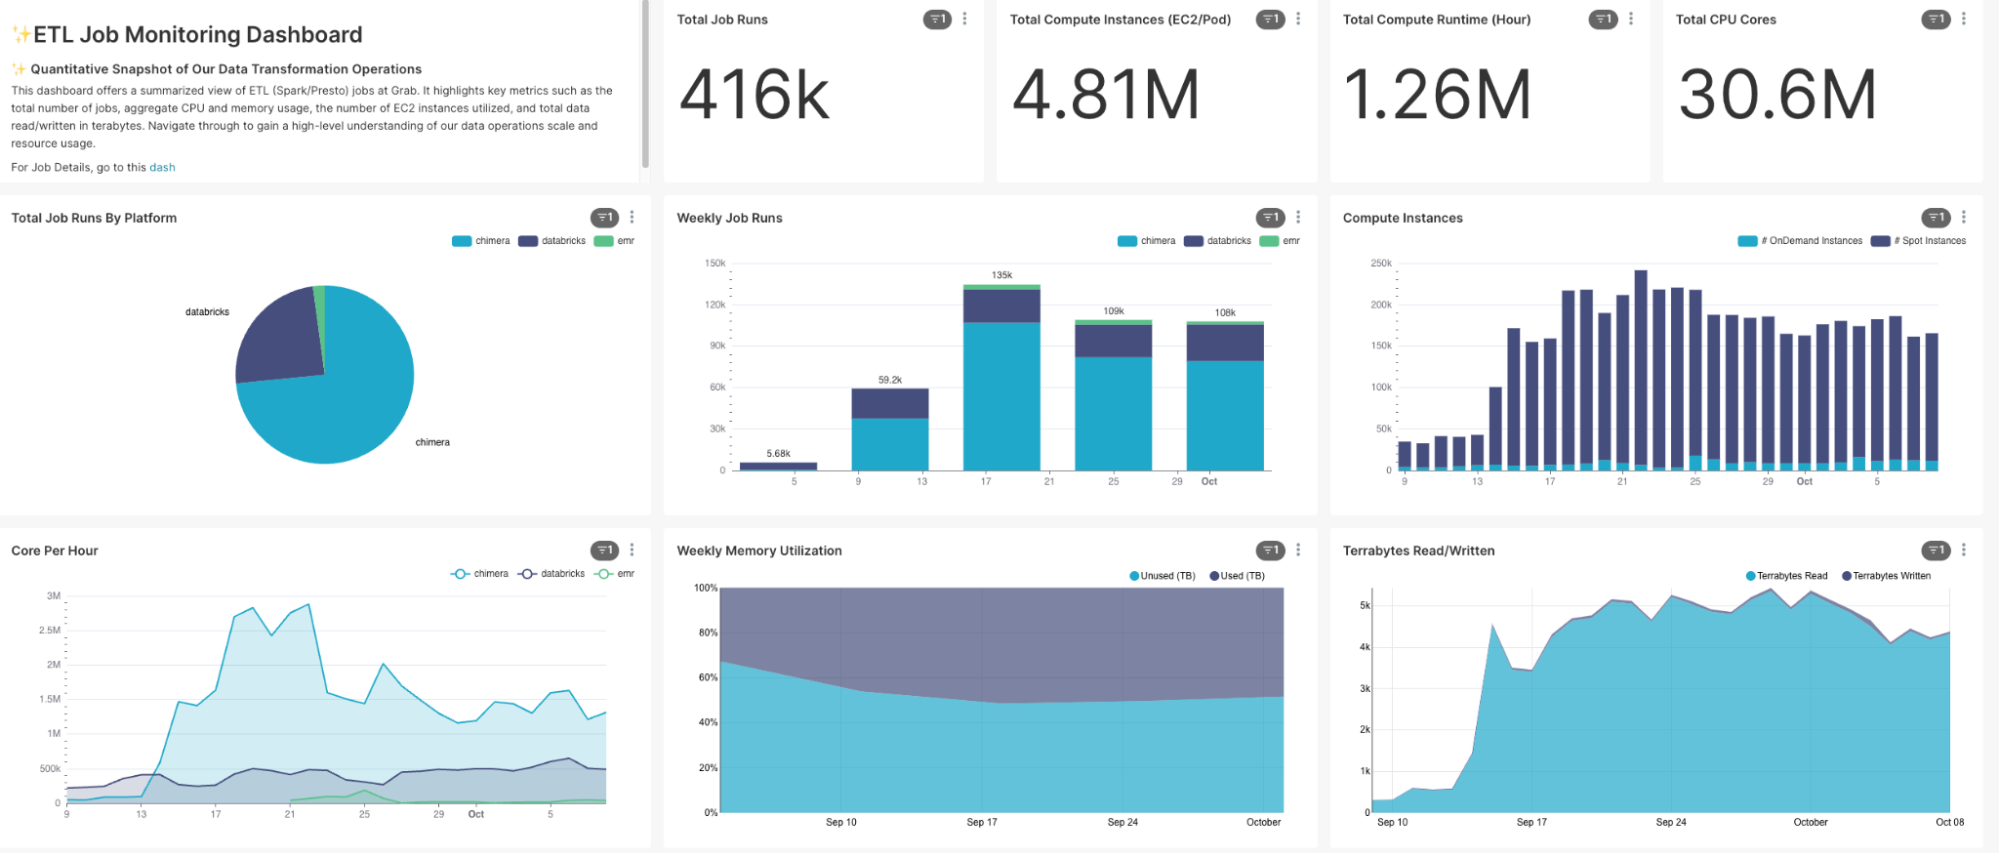
Moreover, to assist platform owners and end-users in obtaining a quick summary of their job data, we provide built-in dashboards with pre-aggregated visuals. These dashboards contain a wealth of information expressed in an easy-to-understand format. Key metrics include:
Total instances
Total CPU cores
Total memory
CPU and memory utilisation
Total machine runtimes
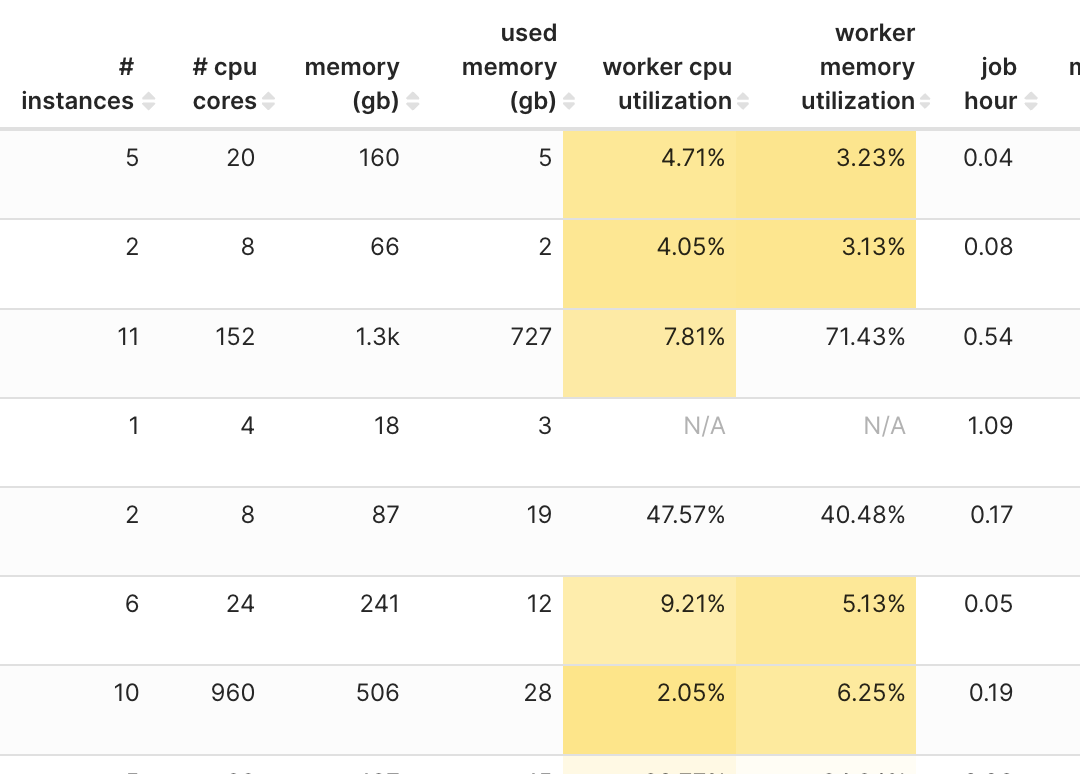
Besides visualisations for individual jobs, we have designed an overview dashboard providing a comprehensive summary of all resources consumed by all ETL jobs. This is particularly useful for platform owners and tech leads, allowing them to have an all-encompassing visibility of the performance and resource usage across the ETL jobs.
Dashboard for monitoring ETL jobs
These dashboards’ visuals effectively turn the historical metrics data into clear, comprehensible, and insightful information, guiding users towards objective-driven decision-making.
Transforming observations into insights
While our journey with Iris is just in the early stages, we’ve already begun harnessing its ability to transform raw data into concrete insights. The strength of Iris lies not just in its data collection capabilities but also in its potential to analyse and infer patterns from the collated data.
Currently, we’re experimenting with a job classification model that aims to predict resource allocation efficiency (i.e. identifying jobs as over or under-provisioned). This information, once accurately predicted, can help optimise the usage of resources by fine-tuning the provisions for each job. While this model is still in its early stages of testing and lacks sufficient validation data, it exemplifies the direction we’re heading – integrating advanced analytics with operational observability.
As we continue to refine Iris and develop more models, our aim is to empower users with deep insights into their Spark applications. These insights can potentially identify bottlenecks, optimise resource allocation and ultimately, enhance overall performance. In the long run, we see Iris evolving from being a data collection tool to a platform that can provide actionable recommendations and enable data-driven decision-making.
Job classification feature set
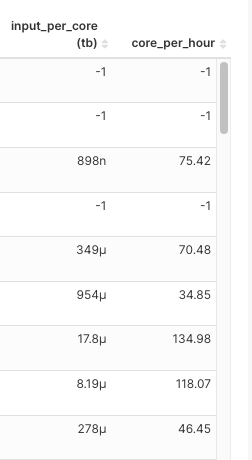
At the core of our job classification model, there are two carefully selected metrics:
CPU cores per hour: This represents the number of tasks a job can handle concurrently in a given hour. A higher number would mean more tasks being processed simultaneously.
Total Terabytes of data input per core: This considers only the input from the underlying HDFS/S3 input, excluding shuffle data. It represents the volume of data one CPU core needs to process. A larger input would mean more CPUs are required to complete the job in a reasonable timeframe.
The choice of these two metrics for building feature sets is based on a nuanced understanding of Spark job dynamics:
Allocating the right CPU cores is crucial as a higher number of cores means more tasks being processed concurrently. This is especially important for jobs with larger input data and more partitioned files, as they often require more concurrent processing capacity, hence, more CPU cores.
The total data input helps to estimate the data processing load of a job. A job tasked with processing a high volume of input data but assigned low CPU cores might be under-provisioned and result in an extended runtime.
As for CPU and memory utilisation, while it could offer useful insights, we’ve found it may not always contribute to predicting if a job is over or under-provisioned because utilisation can vary run-to-run. Thus, to keep our feature set robust and consistent, we primarily focus on CPU cores per hour and total terabytes of input data.
With these metrics as our foundation, we are developing models that can classify jobs into over-provisioned or under-provisioned, helping us optimise resource allocation and improve job performance in the long run.
As always, treat any information related to our job classification feature set and the insights derived from it with utmost care for data confidentiality and integrity.
We’d like to reiterate that these models are still in the early stages of testing and we are constantly working to enhance their predictive accuracy. The true value of this model will be unlocked as it is refined and as we gather more validation data.
Model training and optimisation
Choosing the right model is crucial for deriving meaningful insights from datasets. We decided to start with a simple, yet powerful algorithm – K-means clustering, for job classification. K-means is a type of unsupervised machine learning algorithm used to classify items into groups (or clusters) based on their features.
Here is our process:
Model exploration: We began by exploring the K-means algorithm using a small dataset for validation.
Platform-specific cluster numbers: To account for the uniqueness of every platform, we ran a Score Test (an evaluation method to determine the optimal number of clusters) for each platform. The derived optimal number of clusters is then used in the monthly job for that respective platform’s data.
Set up a scheduled job: After ensuring the code was functioning correctly, we set up a job to run the model on a monthly schedule. Monthly re-training was chosen to encapsulate possible changes in the data patterns over time.
Model saving and utilisation: The trained model is saved to our S3 bucket and used to classify jobs as over-provisioned or under-provisioned based on the daily job runs.
This iterative learning approach, through which our model learns from an ever-increasing pool of historical data, helps maintain its relevance and improve its accuracy over time.
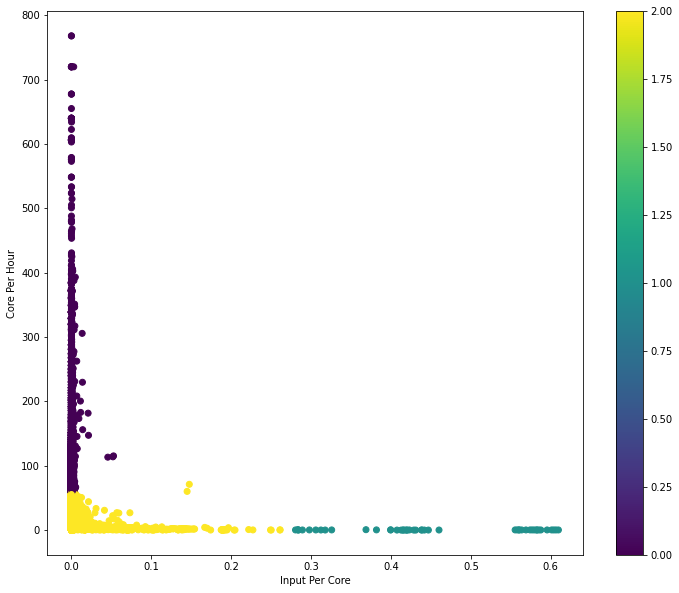
Here is an example output from Databricks train run:
Blue green group: Input per core is too large but the CPU per hour is small, so the job may take a lot of time to complete.
Purple group: Input per core is too small but the CPU per hour is too high. There may be a lot of wasted CPU here.
Yellow group: I think this is the ideal group where input per core and CPU per hour is not high.
Keep in mind that classification insights provided by our K-means model are still in the experimental stage. As we continue to refine the approach, the reliability of these insights is expected to grow, providing increasingly valuable direction for resource allocation optimisation.
Seeing Iris in action
This section provides practical examples and real-case scenarios that demonstrate Iris’s capacity for delivering insights from ETL job observations.
Case study 1: Spark benchmarking
From August to September 2023, we carried out a Spark benchmarking exercise to measure and compare the cost and performance of Grab’s Spark platforms: Open Source Spark on Kubernetes (Chimera), Databricks and AWS EMR. Since each platform has its own way to measure a job’s performance and cost, Iris was used to collect the necessary Spark metrics in order to calculate the cost for each job. Furthermore, many other metrics were collected by Iris in order to compare the platforms’ performances like CPU and memory utilisation, runtime, etc.
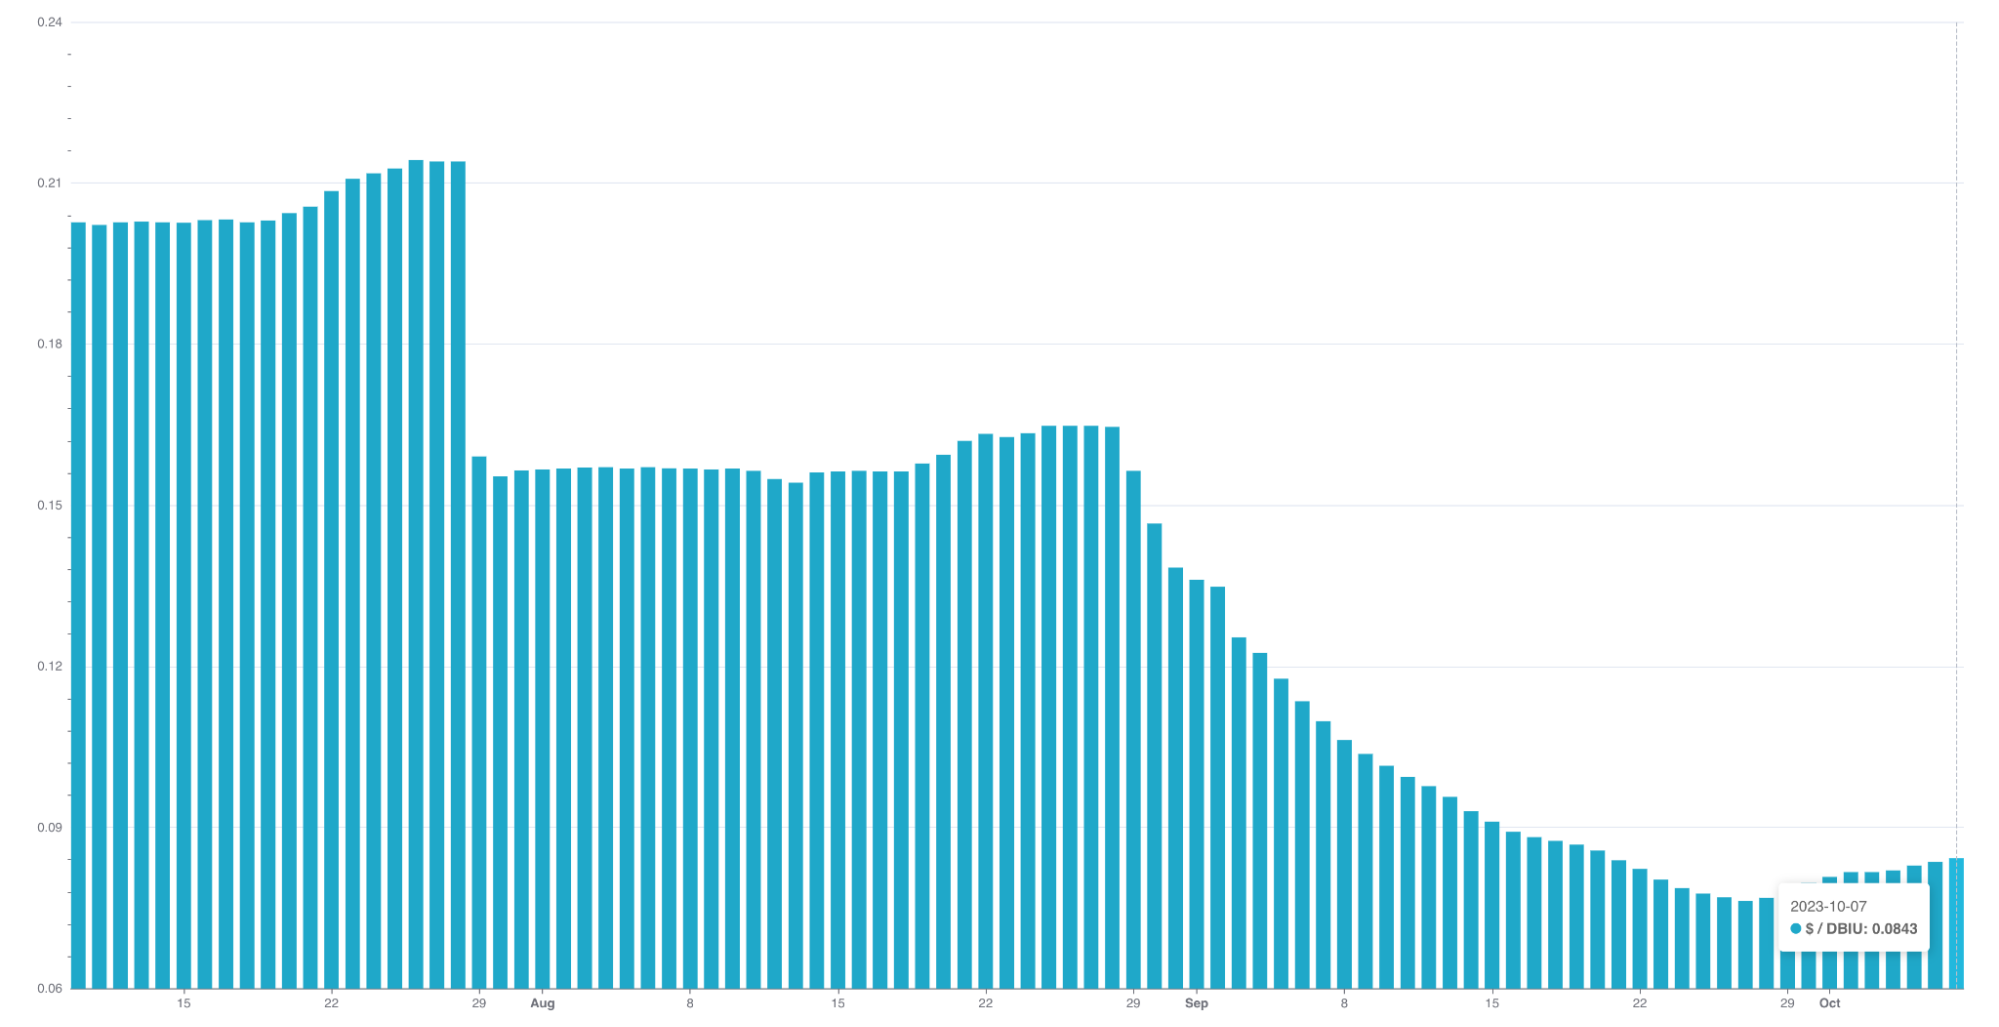
Case study 2: Improving Databricks Infra Cost Unit (DBIU) Accuracy with Iris
Being able to accurately calculate and fairly distribute Databricks infrastructure costs has always been a challenge, primarily due to difficulties in distinguishing between on-demand and Spot instance usage. This was further complicated by two conditions:
Fallback to on-demand instances: Databricks has a feature that automatically falls back to on-demand instances when Spot instances are not readily available. While beneficial for job execution, this feature has traditionally made it difficult to accurately track per-job Spot vs. on-demand usage.
User configurable hybrid policy: Users can specify a mix of on-demand and Spot instances for their jobs. This flexible, hybrid approach often results in complex, non-uniform usage patterns, further complicating cost categorisation.
Iris has made a key difference in resolving these dilemmas. By providing granular, instance-level metrics including whether each instance is on-demand or Spot, Iris has greatly improved our visibility into per-job instance usage.
This precise data enables us to isolate the on-demand instance usage, which was previously bundled in the total cost calculation. Similarly, it allows us to accurately gauge and consider the usage ratio of on-demand instances in hybrid policy scenarios.
The enhanced transparency provided by Iris metrics allows us to standardise DBIU cost calculations, making them fairer for users who majorly or only use Spot instances. In other words, users need to pay more if they intentionally choose or fall back to on-demand instances for their jobs.
The practical application of Iris in enhancing DBIU accuracy illustrates its potential in driving data-informed decisions and fostering fairness in resource usage and cost distribution.
Case study 3: Optimising job configuration for better performance and cost efficiency
One of the key utilities of iris is its potential to assist with job optimisation. For instance, we have been able to pinpoint jobs that were consistently over-provisioned and work with end-users to tune their job configurations.
Through this exercise and continuous monitoring, we’ve seen substantial results from the job optimisations:
Cost reductions ranging from 20% to 50% for most jobs.
Positive feedback from users about improvements in job performance and cost efficiency.
By the way, interestingly, our analysis led us to identify certain the following patterns. These patterns could be leveraged to widen the impact of our optimisation efforts across multiple use-cases in our platforms:
Pattern
Recommendation
Job duration < 20 minutes
Input per core < 1GB
Total used instance is 2x/3x of max worker nodes
Use fixed number of workers nodes potentially speeding up performance and certainly reducing costs.
CPU utilisation < 25%
Cut max worker in half. E.g: 10 to 5 workers
Downgrade instance size a half. E.g: 4xlarge -> 2xlarge
Job has much shuffle
Bump the instance size and reduce the number of workers. E.g. bump 2xlarge -> 4xlarge and reduce number of workers from 100 -> 50
However, we acknowledge that these findings may not apply uniformly to every instance. The optimisation recommendations derived from these patterns might not yield the desired outcomes in all cases.
The future of Iris
Building upon its firm foundation as a robust Spark observability tool, we envision a future for Iris wherein it not only monitors metrics but provides actionable insights, discerns usage patterns, and drives predictions.
Our plans to make Iris more accessible include developing APIs endpoint for platform teams to query performance by job names. Another addition we’re aiming for is the ability for Iris to provide resource tuning recommendations. By making platform-specific and job-specific recommendations easily accessible, we hope to assist platform teams in making informed, data-driven decisions on resource allocation and cost efficiency.
We’re also looking to expand Iris’s capabilities with the development of a listener for Presto jobs, similar to the sparkMeasure tool currently used for Spark jobs. The listener would provide valuable metrics and insights into the performance of Presto jobs, opening up new avenues for optimisation and cost management.
Another major focus will be building a feedback loop for Iris to further enhance accuracy, continually refine its models, and improve insights provided. This effort would greatly benefit from the close collaboration and inputs from platform teams and other tech leads, as their expertise aids in interpreting Iris’s metrics and predictions and validating its meaningfulness.
In conclusion, as Iris continues to develop and mature, we foresee it evolving into a crucial tool for data-driven decision-making and proactive management of Spark applications, playing a significant role in the efficient usage of cloud computing resources.
Conclusion
The role of Iris as an observability tool for Spark jobs in the world of Big Data is rapidly evolving. Iris has proven to be more than a simple data collection tool; it is a platform that integrates advanced analytics with operational observability.
Even though Iris is in its early stages, it’s already been instrumental in creating detailed visualisations of both real-time and historical data from varied platforms. Besides that, Iris has started making strides in its journey towards using machine learning models like K-means clustering to classify jobs, demonstrating its potential in helping operators fine-tune resource allocation.
Using instance-level metrics, Iris is helping improve cost distribution fairness and accuracy, making it a potent tool for resource optimisation. Furthermore, the successful case study of reducing job costs and enhancing performance through resource reallocation provides a promising outlook into Iris’s future applicability.
With ongoing development plans, such as the Presto listener and the creation of endpoints for broader accessibility, Iris is poised to become an integral tool for data-informed decision-making. As we strive to enhance Iris, we will continue to collaborate with platform teams and tech leads whose feedback is invaluable in fulfilling Iris’s potential.
Our journey with Iris is a testament to Grab’s commitment to creating a data-informed and efficient cloud computing environment. Iris, with its observed and planned capabilities, is on its way to revolutionising the way resource allocation is managed and optimised.
Join us
Grab is the leading superapp platform in Southeast Asia, providing everyday services that matter to consumers. More than just a ride-hailing and food delivery app, Grab offers a wide range of on-demand services in the region, including mobility, food, package and grocery delivery services, mobile payments, and financial services across 428 cities in eight countries.
Powered by technology and driven by heart, our mission is to drive Southeast Asia forward by creating economic empowerment for everyone. If this mission speaks to you, join our team today!
AI has become an integral part of my workflow these days, and with the assistance of GitHub Copilot, I move a lot faster when I’m building a project. Having used AI tools to increase my productivity over the past year, I’ve realized that similar to learning how to use a new framework or library, we can enhance our efficiency with AI tools by learning how to best use them.
In this blog post, I’ll share some of the daily things I do to get the most out of GitHub Copilot. I hope these tips will help you become a more efficient and productive user of the AI assistant.
Need a refresher on how to use GitHub Copilot?Since GitHub Copilot continues to evolve in the IDE, CLI, and across GitHub.com, we put together a full guide on using GitHub Copilot with prompt tips and tricks. Get the guide >
Want to learn how best to leverage it in the IDE? Keep on reading. ⤵
Beyond code completion
To make full use of the power of GitHub Copilot, it’s important to understand its capabilities. GitHub Copilot is developing rapidly, and new features are being added all the time. It’s no longer just a code completion tool in your editor—it now includes a chat interface that you can use in your IDE, a command line tool via a GitHub CLI extension, a summary tool in your pull requests, a helper tool in your terminals, and much, much more.
In a recent blog post, I’ve listed some of the ways you didn’t know you could use GitHub Copilot. This will give you a great overview of how much the AI assistant can currently do.
But beyond interacting with GitHub Copilot, how do you help it give you better answers? Well, the answer to that needs a bit more context.
Context, context, context
If you understand Large Language Models ( LLMs), you will know that they are designed to make predictions based on the context provided. This means, the more contextually rich our input or prompt is, the better the prediction or output will be.
As such, learning to provide as much context as possible is key when interacting with GitHub Copilot, especially with the code completion feature. Unlike ChatGPT where you need to provide all the data to the model in the prompt window, by installing GitHub Copilot in your editor, the assistant is able to infer context from the code you’re working on. It then uses that context to provide code suggestions.
We already know this, but what else can we do to give it additional context?
I want to share a few essential tips with you to provide GitHub Copilot with more context in your editor to get the most relevant and useful code out of it:
1. Open your relevant files
Having your files open provides GitHub Copilot with context. When you have additional files open, it will help to inform the suggestion that is returned. Remember, if a file is closed, GitHub Copilot cannot see the file’s content in your editor, which means it cannot get the context from those closed files.
GitHub Copilot looks at the current open files in your editor to analyze the context, create a prompt that gets sent to the server, and return an appropriate suggestion.
Have a few files open in your editor to give GitHub Copilot a bigger picture of your project. You can also use #editor in the chat interface to provide GitHub Copilot with additional context on your currently opened files in Visual Studio Code (VS Code) and Visual Studio.
Remember to close unneeded files when context switching or moving on to the next task.
2. Provide a top-level comment
Just as you would give a brief, high-level introduction to a coworker, a top-level comment in the file you’re working in can help GitHub Copilot understand the overall context of the pieces you will be creating—especially if you want your AI assistant to generate the boilerplate code for you to get going.
Be sure to include details about what you need and provide a good description so it has as much information as possible. This will help to guide GitHub Copilot to give better suggestions, and give it a goal on what to work on. Having examples, especially when processing data or manipulation strings, helps quite a bit.
3. Set Includes and references
It’s best to manually set the includes/imports or module references you need for your work, particularly if you’re working with a specific version of a package.
GitHub Copilot will make suggestions, but you know what dependencies you want to use. This can also help to let GitHub Copilot know what frameworks, libraries, and their versions you’d like it to use when crafting suggestions.
This can be helpful to jump start GitHub Copilot to a newer library version when it defaults to providing older code suggestions.
4. Meaningful names matter
The name of your variables and functions matter. If you have a function named foo or bar, GitHub Copilot will not be able to give you the best completion because it isn’t able to infer intent from the names.
Just as the function name fetchData() won’t mean much to a coworker (or you after a few months), fetchData() won’t mean much to GitHub Copilot either.
Implementing good coding practices will help you get the most value from GitHub Copilot. While GitHub Copilot helps you code and iterate faster, remember the old rule of programming still applies: garbage in, garbage out.
5. Provide specific and well- scoped function comments
Commenting your code helps you get very specific, targeted suggestions.
A function name can only be so descriptive without being overly long, so function comments can help fill in details that GitHub Copilot might need to know. One of the neat features about GitHub Copilot is that it can determine the correct comment syntax that is typically used in your programming language for function / method comments and will help create them for you based on what the code does. Adding more detail to these as the first change you do then helps GitHub Copilot determine what you would like to do in code and how to interact with that function.
Remember: Single, specific, short comments help GitHub Copilot provide better context.
6. Provide sample code
Providing sample code to GitHub Copilot will help it determine what you’re looking for. This helps to ground the model and provide it with even more context.
It also helps GitHub Copilot generate suggestions that match the language and tasks you want to achieve, and return suggestions based on your current coding standards and practices. Unit tests provide one level of sample code at the individual function/method level, but you can also provide code examples in your project showing how to do things end to end. The cool thing about using GitHub Copilot long-term is that it nudges us to do a lot of the good coding practices we should’ve been doing all along.
Learn more about providing context to GitHub Copilot by watching this Youtube video:
Inline Chat with GitHub Copilot
Inline chat
Outside of providing enough context, there are some built-in features of GitHub Copilot that you may not be taking advantage of. Inline chat, for example, gives you an opportunity to almost chat with GitHub Copilot between your lines of code. By pressing CMD + I (CTRL + I on Windows) you’ll have Copilot right there to ask questions. This is a bit more convenient for quick fixes instead of opening up GitHub Copilot Chat’s side panel.
This experience provides you with code diffs inline, which is awesome. There are also special slash commands available like creating documentation with just the slash of a button!
Tips and tricks with GitHub Copilot Chat
GitHub Copilot Chat provides an experience in your editor where you can have a conversation with the AI assistant. You can improve this experience by using built-in features to make the most out of it.
8. Remove irrelevant requests
For example, did you know that you can delete a previously asked question in the chat interface to remove it from the indexed conversation? Especially if it is no longer relevant?
Doing this will improve the flow of conversation and give GitHub Copilot only the necessary information needed to provide you with the best output.
9. Navigate through your conversation
Another tip I found is to use the up and down arrows to navigate through your conversation with GitHub Copilot Chat. I found myself scrolling through the chat interface to find that last question I asked, then discovered I can just use my keyboard arrows just like in the terminal!
10. Use the @workspace agent
If you’re using VS Code or Visual Studio, remember that agents are available to help you go even further. The @workspace agent for example, is aware of your entire workspace and can answer questions related to it. As such, it can provide even more context when trying to get a good output from GitHub Copilot.
11. Highlight relevant code
Another great tip when using GitHub Copilot Chat is to highlight relevant code in your files before asking it questions. This will help to give targeted suggestions and just provides the assistant with more context into what you need help with.
12. Organize your conversations with threads
You can have multiple ongoing conversations with GitHub Copilot Chat on different topics by isolating your conversations with threads. We’ve provided a convenient way for you to start new conversations (thread) by clicking the + sign on the chat interface.
13. Slash Commands for common tasks
Slash commands are awesome, and there are quite a few of them. We have commands to help you explain code, fix code, create a new notebook, write tests, and many more. They are just shortcuts to common prompts that we’ve found to be particularly helpful in day-to-day development from our own internal usage.
Command
Description
Usage
/explain
Get code explanations
Open file with code or highlight code you want explained and type:
/explain what is the fetchPrediction method?
/fix
Receive a proposed fix for the problems in the selected code
Highlight problematic code and type:
/fix propose a fix for the problems in fetchAirports route
/tests
Generate unit tests for selected code
Open file with code or highlight code you want tests for and type:
/tests
/help
Get help on using Copilot Chat
Type:
/help what can you do?
/clear
Clear current conversation
Type:
/clear
/doc
Add a documentation comment
Highlight code and type:
/doc
You can also press CMD+I in your editor and type /doc/ inline
/generate
Generate code to answer your question
Type:
/generate code that validates a phone number
/optimize
Analyze and improve running time of the selected code
Highlight code and type:
/optimize fetchPrediction method
/clear
Clear current chat
Type:
/clear
/new
Scaffold code for a new workspace
Type:
/new create a new django app
/simplify
Simplify the selected code
Highlight code and type:
/simplify
/feedback
Provide feedback to the team
Type:
/feedback
See the following image for commands available in VS Code:
14. Attach relevant files for reference
In Visual Studio and VS Code, you can attach relevant files for GitHub Copilot Chat to reference by using #file. This scopes GitHub Copilot to a particular context in your code base and provides you with a much better outcome.
To reference a file, type # in the comment box, choose #file and you will see a popup where you can choose your file. You can also type #file_name.py in the comment box. See below for an example:
15. Start with GitHub Copilot Chat for faster debugging
These days whenever I need to debug some code, I turn to GitHub Copilot Chat first. Most recently, I was implementing a decision tree and performed a k-fold cross-validation. I kept getting the incorrect accuracy scores and couldn’t figure out why. I turned to GitHub Copilot Chat for some assistance and it turns out I wasn’t using my training data set (X_train, y_train), even though I thought I was:
I’m catching up on my AI/ML studies today. I had to implement a DecisionTree and use the cross_val_score method to evaluate the model’s accuracy score.
I couldn’t figure out why the incorrect values for the accuracy scores were being returned, so I turned to Chat for some help pic.twitter.com/xn2ctMjAnr
— Kedasha is learning about AI + ML ✨ (@itsthatladydev) March 23, 2024
I figured this out a lot faster than I would’ve with external resources. I want to encourage you to start with GitHub Copilot Chat in your editor to get debugging help faster instead of going to external resources first. Follow my example above by explaining the problem, pasting the problematic code, and asking for help. You can also highlight the problematic code in your editor and use the /fix command in the chat interface.
Be on the lookout for sparkles!
In VS Code, you can quickly get help from GitHub Copilot by looking out for “magic sparkles.” For example, in the commit comment section, clicking the magic sparkles will help you generate a commit message with the help of AI. You can also find magic sparkles inline in your editor as you’re working for a quick way to access GitHub Copilot inline chat.
Pressing them will use AI to help you fill out the data and more magic sparkles are being added where we find other places for GitHub Copilot to help in your day-to-day coding experience.
Know where your AI assistant shines
To get the best and most out of the tool, remember that context and prompt crafting is essential to keep in mind. Understanding where the tool shines best is also important. Some of the things GitHub Copilot is very good at include boilerplate code and scaffolding, writing unit tests, writing documentation, pattern matching, explaining uncommon or confusing syntax, cron jobs, and regex, and helping you remember things you’ve forgotten and debugging.
But never forget that you are in control, and GitHub Copilot is here as just that, your copilot. It is a tool that can help you write code faster, and it’s up to you to decide how to best use it.
It is not here to do your work for you or to write everything for you. It will guide you and nudge you in the right direction just as a coworker would if you asked them questions or for guidance on a particular issue.
As AI continues to shape the development landscape, developers are navigating a new frontier—not one that will make their careers obsolete, but one that will require their skills and instincts more than ever.
Sure, AI is revolutionizing software development, but that revolution ultimately starts and stops with developers. That’s because these tools need to have a pilot in control. While they can improve the time to code and ship, they can’t serve as a replacement for human oversight and coding abilities.
We recently conducted research into the evolving relationship between developers and AI tools and found that AI has the potential to alleviate the cognitive burden of complex tasks for developers. Instead of being used solely as a second pair of hands, AI tools can also be used more like a second brain, helping developers be more well-rounded and efficient.
In essence, AI can reduce mental strain so that developers can focus on anything from learning a new language to creating high-quality solutions for complex problems. So, if you’re sitting here wondering if you should learn how to code or how AI fits into your current coding career, we’re here to tell you what you need to know about your work in the age of AI.
A brief history of AI-powered techniques and tools
While the media buzz around generative AI is relatively new, AI coding tools have been around —in some form or another—much longer than you might expect. To get you up to speed, here’s a brief timeline of the AI-powered tools and techniques that have paved the way for the sophisticated coding tools we have today:
1950s:Autocoder was one of the earliest attempts at automatic coding. Developed in the 1950s by IBM, Autocoder translated symbolic language into machine code, streamlining programming tasks for early computers.
1958:LISP, one of the oldest high-level programming languages created by John McCarthy, introduced symbolic processing and recursive functions, laying the groundwork for AI programming. Its flexibility and expressive power made it a popular choice for AI research and development.
(defun factorial (n)
  (if (<= n 1)
      1
      (* n (factorial (- n 1)))))
This function calculates the factorial of a non-negative integer ‘n’ in LISP. If ‘n’ is 0 or 1, the factorial is 1. Otherwise, it recursively multiplies ‘n’ by the factorial of n-1 until ‘n’ reaches 1.
1970:SHRDLU, developed by Terry Winograd at MIT, was an early natural language understanding program that could interpret and respond to commands in a restricted subset of English, and demonstrated the potential for AI to understand and generate human language.
SHRDLU, operating in a block world, aimed to understand and execute natural language instructions for manipulating virtual objects made of various shaped blocks. [Source: Cryptlabs]
1980s: In the 1980s, code generators, such as The Last One, emerged as tools that could automatically generate code based on user specifications or predefined templates. While not strictly AI-powered in the modern sense, they laid the foundation for later advancements in code generation and automation.
“Personal Computer” magazine cover from 1982 that explored the program, The Last One. [Source: David Tebbutts]
1990s:Neural network–based predictive models were increasingly applied to code-related tasks, such as predicting program behavior, detecting software defects, and analyzing code quality. These models leveraged the pattern recognition capabilities of neural networks to learn from code examples and make predictions.
2000s:Refactoring tools with AI capabilities began to emerge in the 2000s, offering automated assistance for restructuring and improving code without changing its external behavior. These tools used AI techniques to analyze code patterns, identify opportunities for refactoring, and suggest appropriate refactorings to developers.
These early AI-powered coding tools helped shape the evolution of software development and set the stage for today’s AI-driven coding assistance and automation tools, which continue to evolve seemingly every day.
Evolving beyond the IDE
Initially, AI tools were primarily confined to the integrated development environment (IDE), aiding developers in writing and refining code. But now, we’re starting to see AI touch every part of the software development lifecycle (SDLC), which we’ve found can increase productivity, streamline collaboration, and accelerate innovation for engineering teams.
In a 2023 survey of 500 U.S.-based developers, 70% reported experiencing significant advantages in their work, while over 80% said these tools will foster greater collaboration within their teams. Additionally, our research revealed that developers, on average, complete tasks up to 55% faster when using AI coding tools.
Here’s a quick look at where modern AI-powered coding tools are and some of the technical benefits they provide today:
Code completion and suggestions. Tools like GitHub Copilot use large language models (LLMs) to analyze code context and generate suggestions to make coding more efficient. Developers can now experience a notable boost in productivity as AI can suggest entire lines of code based on the context and patterns learned from developers’ code repositories, rather than just the code in the editor. Copilot also leverages the vast amount of open-source code available on GitHub to enhance its understanding of various programming languages, frameworks, and libraries, to provide developers with valuable code suggestions.
Generative AI in your repositories. Developers can use tools like GitHub Copilot Chat to ask questions and gain a deeper understanding of their code base in real time. With AI gathering context of legacy code and processes within your repositories, GitHub Copilot Enterprise can help maintain consistency and best practices across an organization’s codebase when suggesting solutions.
Natural language processing (NLP). AI has recently made great strides in understanding and generating code from natural language prompts. Think of tools like ChatGPT where developers can describe their intent in plain language, and the AI produces valuable outputs, such as executable code or explanations for that code functionality.
Enhanced debugging with AI. These tools can analyze code for potential errors, offering possible fixes by leveraging historical data and patterns to identify and address bugs more effectively.
To implement AI tools, developers need technical skills and soft skills
There are two different subsets of skills that can help developers as they begin to incorporate AI tools into their development workflows: technical skills and soft skills. Having both technical chops and people skills is super important for developers when they’re diving into AI projects—they need to know their technical skills to make those AI tools work to their advantage, but they also need to be able to work well with others, solve problems creatively, and understand the big picture to make sure the solutions they come up with actually hit the mark for the folks using them.
Let’s take a look at those technical skills first.
Getting technical
Prompt engineering
Prompt engineering involves crafting well-designed prompts or instructions that guide the behavior of AI models to produce desired outputs or responses. It can be pretty frustrating when AI-powered coding assistants don’t generate a valuable output, but that can often be quickly remedied by adjusting how you communicate with the AI. Here are some things to keep in mind when crafting natural language prompts:
Be clear and specific. Craft direct and contextually relevant prompts to guide AI models more effectively.
Experiment and iterate. Try out various prompt variations and iterate based on the outputs you receive.
Validate, validate, validate. Similar to how you would inspect code written by a colleague, it’s crucial to consistently evaluate, analyze, and verify code generated by AI algorithms.
Code reviews
AI is helpful, but it isn’t perfect. While LLMs are trained on large amounts of data, they don’t inherently understand programming concepts the way humans do. As a result, the code they generate may contain syntax errors, logic flaws, or other issues. That’s why developers need to rely on their coding competence and organizational knowledge to make sure that they aren’t pushing faulty code into production.
For a successful code review, you can start out by asking: does this code change accomplish what it is supposed to do? From there, you can take a look at this in-depth checklist of more things to keep in mind when reviewing AI-generated code suggestions.
Testing and security
With AI’s capabilities, developers can now generate and automate tests with ease, making their testing responsibilities less manual and more strategic. To ensure that the AI-generated tests cover critical functionality, edge cases, and potential vulnerabilities effectively, developers will need a strong foundational knowledge of programming skills, testing principles, and security best practices. This way, they’ll be able to interpret and analyze the generated tests effectively, identify potential limitations or biases in the generated tests, and augment with manual tests as necessary.
Here’s a few steps you can take to assess the quality and reliability of AI-generated tests:
Verify test assertions. Check if the assertions made by the AI-generated tests are verifiable and if they align with the expected behavior of the software.
Assess test completeness. Evaluate if the AI-generated tests cover all relevant scenarios and edge cases and identify any gaps or areas where additional testing may be required to achieve full coverage.
Identify limitations and biases. Consider factors such as data bias, algorithmic biases, and limitations of the AI model used for test generation.
Evaluate results. Investigate any test failures or anomalies to determine their root causes and implications for the software.
For those beginning their coding journey, check out the GitHub Learning Pathways to gain deeper insights into testing strategies and security best practices with GitHub Actions and GitHub Advanced Security.
You can also bolster your security skills with this new, open source Secure Code Game 🎮.
And now, the soft skills
As developers leverage AI to build what’s next, having soft skills—like the ability to communicate and collaborate well with colleagues—is becoming more important than ever.
Let’s take a more in-depth look at some soft skills that developers can focus on as they continue to adopt AI tools:
Communication. Communication skills are paramount to collaborating with team members and stakeholders to define project requirements, share insights, and address challenges. They’re also important as developers navigate prompt engineering. The best AI prompts are clear, direct, and well thought out—and communicating with fellow humans in the workplace isn’t much different.
Did you know that prompt engineering best practices just might help you build your communication skills with colleagues? Check out this thought piece from Harvard Business Review for more insights.
Problem solving. Developers may encounter complex challenges or unexpected issues when working with AI tools, and the ability to think creatively and adapt to changing circumstances is crucial for finding innovative solutions.
Adaptability. The rapid advancement of AI technology requires developers to be adaptable and willing to embrace new tools, methodologies, and frameworks. Plus, cultivating soft skills that promote a growth mindset allows individuals to consistently learn and stay updated as AI tools continue to evolve.
Ethical thinking. Ethical considerations are important in AI development, particularly regarding issues such as bias, fairness, transparency, and privacy. Integrity and ethical reasoning are essential for making responsible decisions that prioritize the well-being of users and society at large.
Empathy. Developers are often creating solutions and products for end users, and to create valuable user experiences, developers need to be able to really understand the user’s needs and preferences. While AI can help developers create these solutions faster, through things like code generation or suggestions, developers still need to be able to QA the code and ensure that these solutions still prioritize the well-being of diverse user groups.
Sharpening these soft skills can ultimately augment a developer’s technical expertise, as well as enable them to work more effectively with both their colleagues and AI tools.
Take this with you
As AI continues to evolve, it’s not just changing the landscape of software development; it’s also poised to revolutionize how developers learn and write code. AI isn’t replacing developers—it’s complementing their work, all while providing them with the opportunity to focus more on coding and building their skill sets, both technical and interpersonal.
If you’re interested in improving your skills along your AI-powered coding journey, check out these repositories to start building your own AI based projects. Or you can test out GitHub Copilot, which can help you learn new programming languages, provide coding suggestions, and ask important coding questions right in your terminal.
At GitHub, we use merge queue to merge hundreds of pull requests every day. Developing this feature and rolling it out internally did not happen overnight, but the journey was worth it—both because of how it has transformed the way we deploy changes to production at scale, but also how it has helped improve the velocity of customers too. Let’s take a look at how this feature was developed and how you can use it, too.
In 2020, engineers from across GitHub came together with a goal: improve the process for deploying and merging pull requests across the GitHub service, and specifically within our largest monorepo. This process was becoming overly complex to manage, required special GitHub-only logic in the codebase, and required developers to learn external tools, which meant the engineers developing for GitHub weren’t actually using GitHub in the same way as our customers.
To understand how we got to this point in 2020, it’s important to look even further back.
By 2016, nearly 1,000 pull requests were merging into our large monorepo every month. GitHub was growing both in the number of services deployed and in the number of changes shipping to those services. And because we deploy changes prior to merging them, we needed a more efficient way to group and deploy multiple pull requests at the same time. Our solution at this time was trains. A train was a special pull request that grouped together multiple pull requests (passengers) that would be tested, deployed, and eventually merged at the same time. A user (called a conductor) was responsible for handling most aspects of the process, such as starting a deployment of the train and handling conflicts that arose. Pipelines were added to help manage the rollout path. Both these systems (trains and pipelines) were only used on our largest monorepo and were implemented in our internal deployment system.
Trains helped improve velocity at first, but over time started to negatively impact developer satisfaction and increase the time to land a pull request. Our internal Developer Experience (DX) team regularly polls our developers to learn about pain points to help inform where to invest in improvements. These surveys consistently rated deployment as the most painful part of the developer’s daily experience, highlighting the complexity and friction involved with building and shepherding trains in particular. This qualitative data was backed by our quantitative metrics. These showed a steady increase in the time it took from pull request to shipped code.
Trains could also grow large, containing the changes of 15 pull requests. Large trains frequently “derailed” due to a deployment issue, conflicts, or the need for an engineer to remove their change. On painful occasions, developers could wait 8+ hours after joining a train for it to ship, only for it to be removed due to a conflict between two pull requests in the train.
Trains were also not used on every repository, meaning the developer experience varied significantly between different services. This led to confusion when engineers moved between services or contributed to services they didn’t own, which is fairly frequent due to our inner source model.
In short, our process was significantly impacting the productivity of our engineering teams—both in our large monorepo and service repositories.
Building a better solution for us and eventually for customers
By 2020, it was clear that our internal tools and processes for deploying and merging across our repositories were limiting our ability to land pull requests as often as we needed. Beyond just improving velocity, it became clear that our new solution needed to:
Improve the developer experience of shipping. Engineers wanted to express two simple intents: “I want to ship this change” and “I want to shift to other work;” the system should handle the rest.
Avoid having problematic pull requests impact everyone. Those causing conflicts or build failures should not impact all other pull requests waiting to merge. The throughput of the overall system should be favored over fairness to an individual pull request.
Be consistent and as automated as possible across our services and repositories. Manual toil by engineers should be removed wherever possible.
The merge queue project began as part of an overall effort within GitHub to improve availability and remove friction that was preventing developers from shipping at the frequency and level of quality that was needed. Initially, it was only focused on providing a solution for us, but was built with the expectation that it would eventually be made available to customers.
By mid-2021, a few small, internal repositories started testing merge queue, but moving our large monorepo would not happen until the next year for a few reasons.
For one, we could not stop deploying for days or weeks in order to swap systems. At every stage of the project we had to have a working system to ship changes. At a maximum, we could block deployments for an hour or so to run a test or transition. GitHub is remote-first and we have engineers throughout the world, so there are quieter times but never a free pass to take the system offline.
Changing the way thousands of developers deploy and merge changes also requires lots of communication to ensure teams are able to maintain velocity throughout the transition. Training 1,000 engineers on a new system overnight is difficult, to say the least.
By rolling out changes to the process in phases (and sometimes testing and rolling back changes early in the morning before most developers started working) we were able to slowly transition our large monorepo and all of our repositories responsible for production services onto merge queue by 2023.
How we use merge queue today
Merge queue has become the single entry point for shipping code changes at GitHub. It was designed and tested at scale, shipping 30,000+ pull requests with their associated 4.5 million CI runs, for GitHub.com before merge queue was made generally available.
For GitHub and our “deploy the merge process,” merge queue dynamically forms groups of pull requests that are candidates for deployment, kicks off builds and tests via GitHub Actions, and ensures our main branch is never updated to a failing commit by enforcing branch protection rules. Pull requests in the queue that conflict with one another are automatically detected and removed, with the queue automatically re-forming groups as needed.
Because merge queue is integrated into the pull request workflow (and does not require knowledge of special ChatOps commands, or use of labels or special syntax in comments to manage state), our developer experience is also greatly improved. Developers can add their pull request to the queue and, if they spot an issue with their change, leave the queue with a single click.
We can now ship larger groups without the pitfalls and frictions of trains. Trains (our old system) previously limited our ability to deploy more than 15 changes at once, but now we can now safely deploy 30 or more if needed.
Every month, over 500 engineers merge 2,500 pull requests into our large monorepo with merge queue, more than double the volume from a few years ago. The average wait time to ship a change has also been reduced by 33%. And it’s not just numbers that have improved. On one of our periodic developer satisfaction surveys, an engineer called merge queue “one of the best quality-of-life improvements to shipping changes that I’ve seen a GitHub!” It’s not a stretch to say that merge queue has transformed the way GitHub deploys changes to production at scale.
How to get started
Merge queue is available to public repositories on GitHub.com owned by organizations and to all repositories on GitHub Enterprise (Cloud or Server).
To learn more about merge queue and how it can help velocity and developer satisfaction on your busiest repositories, see our blog post, GitHub merge queue is generally available.
Companies and their structures are always evolving. Regardless of the reason, with people and information exchanging places, it’s easy for maintainership/ownership information about a repository to become outdated or unclear. Maintainers play a crucial role in guiding and stewarding a project, and knowing who they are is essential for efficient collaboration and decision-making. This information can be stored in the CODEOWNERS file but how can we ensure that it’s up to date? Let’s delve into why this matters and how the GitHub OSPO’s tool, cleanowners, can help maintainers achieve accurate ownership information for their projects.
The importance of accurate maintainer information
In any software project, having clear ownership guidelines is crucial for effective collaboration. Maintainers are responsible for reviewing contributions, merging changes, and guiding the project’s direction. Without clear ownership information, contributors may be unsure of who to reach out to for guidance or review. Imagine that you’ve discovered a high-risk security vulnerability and nobody is responding to your pull request to fix it, let alone coordinating that everyone across the company gets the patches needed for fixing it. This ambiguity can lead to delays and confusion, unfortunately teaching teams that it’s better to maintain control than to collaborate. These are not the outcomes we are hoping for as developers, so it’s important for us to consider how we can ensure active maintainership especially of our production components.
CODEOWNERS files
Solving this problem starts with documenting maintainers. A CODEOWNERS file, residing in the root of a repository, allows maintainers to specify individuals or teams who are responsible for reviewing and maintaining specific areas of the codebase. By defining ownership at the file or directory level, CODEOWNERS provides clarity on who is responsible for reviewing changes within each part of the project.
CODEOWNERS not only streamlines the contribution process but also fosters transparency and accountability within the organization. Contributors know exactly who to contact for feedback, escalation, or approval, while maintainers can effectively distribute responsibilities and ensure that every part of the codebase has proper coverage.
Ensuring clean and accurate CODEOWNERS files with cleanowners
While CODEOWNERS is a powerful tool for managing ownership information, maintaining it manually can be tedious and easily-overlooked. To address this challenge, the GitHub OSPO developed cleanowners: a GitHub Action that automates the process of keeping CODEOWNERS files clean and up to date. If it detects that something needs to change, it will open a pull request so this problem gets addressed sooner rather than later.
This workflow, triggered by scheduled runs, ensures that the CODEOWNERS file is cleaned automatically. By leveraging cleanowners, maintainers can rest assured that ownership information is accurate, or it will be brought to the attention of the team via an automatic pull request requesting an update to the file. Here is an example where @zkoppert and @no-longer-in-this-org used to both be maintainers, but @no-longer-in-this-org has left the company and no longer maintains this repository.
Dive in
With tools like cleanowners, the task of managing CODEOWNERS files becomes actively managed instead of ignored, allowing maintainers to focus on what matters most: building and nurturing thriving software projects. By embracing clear and accurate ownership documentation practices, software projects can continue to flourish, guided by clear ownership and collaboration principles.
Check out the repository for more information on how to configure and set up the action.
Grab is Southeast Asia’s leading superapp, providing a suite of services that brings essential needs to users throughout the region. Its offerings include ride-hailing, food delivery, parcel delivery, mobile payments, and more. With safety, efficiency, and user-centered design at heart, Grab remains dedicated to solving everyday issues and improving the lives of millions.
As the app continues to expand with more features, Grab identified the need for a consistent, high-quality experience for new users who may have limited storage space or restricted internet bandwidth. Read to find out more about Project Bonsai and how it reduced app download size and app disk size.
Introduction
In 2020, Google conducted research that highlighted the negative impact of app sizes on conversion rates, revealing a 1% decrease for every 6MB expansion of the app APK size. This finding prompted Grab to ensure new and existing users had a consistently excellent Grab superapp experience, given the prevalence of low-end devices and disparate internet infrastructure in Southeast Asian regions. As a result, Grab initiated Project Bonsai in Q3 2021, with the goal of reducing and optimising the app size while enhancing user experience, reducing installation barriers, and boosting user acquisition.
Understanding the problem
The Grab superapp, with over 4 million lines of code and integration with hundreds of third-party libraries, had a significant app size. Given the prevalence of low-end devices and disparate internet infrastructure in our target region, it is crucial for us to proactively and constantly ensure we are delivering excellence in app-based user experience.
Objectives of the Bonsai project
The Bonsai project focused on these two key metrics:
App Download Size: This represents the total size of the compressed APK file that users need to download from Google Play when performing a fresh installation.
App Disk Size: This encompasses the total storage space occupied by the app on user devices, including both the binary and data generated by the app.
In this article, we will share the strategy and solutions that resulted in a successful 26% reduction in App Download Size, while also reducing the App Disk Size.
Status quo
Prior to the Bonsai project, the Grab app project had implemented various measures to achieve optimal app size. Here are some notable highlights:
Leveraging App Bundle: Since 2019, Grab has been using the app bundle approach to optimise app delivery. This approach generates smaller APKs tailored to specific device configurations, ensuring users receive optimised APKs. This helps reduce the overall app size and improve installation efficiency.
Monitoring: With a team of over 100 Android engineers and multiple collaborative teams, the Grab app undergoes a weekly release process involving hundreds of commits for each release. Closely monitoring app size changes with every commit is essential for our team. The team established debug build (APK file size) monitoring for every commit merged to the master branch. Regular weekly reviews are conducted to stay updated on the app size and identify commits that might lead to changes in app size. However, occasional mismatches may occur due to discrepancies between the debug and release builds.
Monitoring the changes in APK size
R8 Integration: R8/Proguard, known as the code shrinker, obfuscator, and optimiser, has been enabled since the beginning. This powerful tool helps reduce the app’s bytecode and resources, leading to further size optimisation and improved app performance.
Resource Optimisation: The team diligently pursued resource optimisation strategies, including:
Images: Engineers were encouraged to use vector images whenever possible, as they usually have smaller file sizes than raster images. In exceptional cases where raster images were necessary, Grab adopted the webp format instead of png, utilising better image compression to minimise app size.
Language ResourceConfig: Grab enabled resourceConfig to support only the languages actively used by the Grab app, reducing unnecessary resource overhead and enhancing app efficiency.
Third-Party Libraries Review: The team established a review process for third-party libraries, assessing their size impact on the app. This practice ensured that only essential libraries were included, preventing unnecessary bloating of the app size.
Despite the application of these measures and solutions aimed at managing the app size, there was still the potential of significant expansion in magnitude.
Strategy
The Bonsai project revolves around strategic pillars, namely Measurement, Reduction, and Containment.
Project Bonsai’s three strategic pillars for continuous app size reduction
In the Measurement phase, the focus is on providing accurate information on the app’s binary composition and how individual features, modules, libraries impact the overall app size. This allows teams to make informed decisions and gain insights into their components’ influence on the app’s size.
The insights from the Measure phase provided us with a list of actionable items for our backlog. In the Reduction phase, we employ strategic action to tackle this backlog to constantly achieve optimal app size.
Optimising the app size is not a one-time endeavour, especially as more features are added over time, potentially increasing the project’s size. While there may be limited solutions to manage app size, it’s important to find a balance between size and functionality. Else, the effort and trade-offs required may become overwhelming. Therefore, in the Containment phase, we intend to introduce effective long-term strategies and solutions designed to manage the app’s size.
In the remainder of this blog post, we explore the strategic pillars and actions taken to contain the download size.
Measure
The Grab Passenger App Core team actively engages in optimisation projects and recognised the importance of measurement as the foundation for improvement. For example, enhancing the app startup time, pipeline time, build time, and more.
In every optimisation endeavour, we adhere to a crucial principle: “MEASURE” – the first and most critical step for any improvement project. As the famous quote goes, “If you can’t measure it, you can’t improve it.” This emphasises the significance of accurate and comprehensive measurement as the foundation for driving successful optimisation efforts.
In the third quarter of 2021, our team initiated an investigation into existing tools provided by both Google and the broader community. The intention was to employ tools such as APK Analyzer or Android Studio to conduct a thorough analysis of the app binary. However, it soon became evident that these tools were not well-suited to accommodate the extensive scope of our project.
In order to accommodate our discovery, we developed a custom analytics tool called App Sizer. This tool is specifically designed to analyse app binaries from bundle files. Our primary goal was to construct a solution that adheres effectively to our unique needs.
The tool was seamlessly integrated into Grab’s CI system and sends data to a Grafana instance. As a result, the tool collates and transmits daily analytics data from the release candidate branch. It offers the following key functionalities and monitors important aspects such as:
Device-specific App Download Size: Precise information about the app download size for specific devices, focusing on optimising the App Download Size.
Trends for app download size by device type
Comprehensive Size Breakdown: A breakdown of the app’s size, including the proportion attributed to the codebase Kotlin/Java, Kotlin/Java-based libraries, native libraries, resources, and other relevant factors.
Comprehensive breakdown of app download size by component
Size Contribution by Teams: Insights into the size contributed by each individual team within the project’s scope.
Breakdown of Grab’s codebase by TF
Module-wise Size Contribution: Insights into the size impacted by each module, categorised by team.
Breakdown of the codebase by TF modules
Size Contribution by Third-Party Libraries: Information about the size attributed to each third-party library incorporated within the app.
App download size contribution by external libraries and SDK breakdown
List of Large Files: A categorised list of large files (file size exceeding X value), organised by each respective team.
Large file categories broken down by TF
It’s important to note that all the size values presented within these dashboards specifically pertain to the download size, representing the contribution of each item to the overall app download size.
As part of our commitment to the developer community, we plan to open-source this tool in the near future, allowing others to benefit from its capabilities as well.
Reduce
To optimise the app based on the analysis data obtained from the measuring step, we focused on applying common solutions from Google and the suggestions from the community. There were no fancy solutions that we invented. Our concentration centered on optimising the dex file size, refining resources, and eliminating duplication and redundancy.
dex file optimisation (Java/Kotlin)
In our initial findings, it became evident that Java/Kotlin code was the major contributor of app size. Recognising this, we made it our top priority for optimisation.
R classes
During our investigation, we discovered that a proportion of the overall app size was attributable to R classes. Further research unveiled two primary reasons behind this phenomenon:
Transitive R classes: R classes contained ID references not only to their own resources but also to resources from their transitive dependencies. This meant that if Module A depended on Module B, and Module B in turn, depended on Module C (Module A -> Module B -> Module C), then Module A’s R class included IDs references to resources from Modules B and C, even if Module A didn’t directly utilise these resources. This explained why R classes in a modularised project could accumulate millions of lines of code.
A spread of Modules and Third-Party Libraries: Our Grab project comprised over 1,500 modules and integrates hundreds of third-party libraries, leading to the generation of significantly large R classes within the project. Furthermore, this discovery also explained instances where our app size monitor exhibited spikes during certain commits despite no significant additions of resources, libraries, or code within those commits. These fluctuations were linked to changes in the dependency graph, further emphasising the impact of Transitive R classes.
It is worth noting that the team had long been cognisant of the challenges posed by Transitive R classes, especially in terms of optimising build times. Consequently, we had already undertaken various initiatives to address this specific challenge related to build times.
However, it wasn’t long before we started wondering why R8 wasn’t removing unused fields from the R classes, which would have resulted in a size reduction for these classes. It turned out that back in mid-2021, we were using Android Gradle Plugin 4.0 along with the default R8 rules. One of these rules was preserving all fields in the R classes:
-keepclassmembers class **.R$* {

   public static <fields>;

}
This rule was the root cause of why unused fields in the R classes were persisting. Google removed this rule in AGP 4.1, and the solution was straightforward: updating AGP to version 4.1.1 (or newer) helped us resolve the issue.
However, due to the project’s unusual size, there was a risk of inadvertently removing non-used R class fields if there were any instances of code accessing R classes through reflection within the codebase or third-party libraries. Since our automation testing did not yet support R8, conducting a full test of the entire project was possible, but would have demanded significant effort from the team. To avoid this substantial effort, we developed a script to search the entire codebase and identify instances where reflections were used, allowing us to assess their usage. For third-party libraries, we decompiled the libraries and applied the same script to the decompiled code.
Fix & Optimise R8 Rules
Subsequently, we conducted a revision of the R8 configuration rules. This involved assessing the compiled R8 configuration file and paying specific attention to any ‘keep’ rules that contained package wildcards. It is crucial to decipher the purpose behind each rule and its reason for existence. Any rules identified as redundant were recommended for removal. Post the thorough scrutiny of the R8 rules, we initiated request tickets urging the respective teams to work on the elimination and optimisation of these rules.
Enable more aggressive optimisations
In 2019, Google began recommending the utilisation of the proguard-android-optimise.txt configuration with code optimisation enabled. However, our project’s origins predate the introduction of Google’s R8, a time when Proguard was the primary tool for code obfuscation and size reduction. Prior to the release of Android Gradle Plugin 3.4.0, there were no explicit recommendations for enabling code optimisations during the minification process. As a result, our project has persisted in using the proguard-android.txt configuration without activating the code optimisation feature.
Our team has considered adopting a more aggressive approach towards optimisation. This approach spans from exploring the optimisation mode to incorporating the R8 full mode. This includes substantial effort required for testing and addressing issues arising from the introduction of these new modes. We encountered a particular challenge wherein the R8 optimisation exhibits instability, an issue that has been reported to Google. A definitive solution remains a work-in-progress.
At present, we have decided to postpone the implementation of a more aggressive R8 mode. However, this remains a high-priority item on our agenda, and we intend to address it in the near future.
Resources optimisation
In addition to optimising the dex file, we also address resource optimisation.
Handling large resources
During the Measure phase, we use the List Of Large Files dashboard to identify large files categorised by teams. For each team, we create request tickets with straightforward guidance. These guidelines encourage the following actions:
Explore the possibility of removing unnecessary resources.
Consider offloading the resource to the Internet (server) when feasible. Within Grab, we have the Asset Delivery Kit, which facilitates hosting and downloading resources on the client side.
Optimise files by converting them to alternative formats or reducing their size. For instance, for images, we recommend utilising vector images and the Webp format, among other optimisations.
Convert PNG to Webp
The Grab app project has a long history, and while the team has recently established guidelines and implemented CI processes to promote the use of vector and Webp images, there are still existing images that have not been optimised. The team has undertaken an initiative to address these images and has converted all PNG images to Webp format wherever a reduction in file size is achievable.
Fonts
Fonts are another group of files that have a notable impact on the project’s size. We collaborate with the teams to:
Remove fonts that are rarely used in the project.
Eliminate duplicate fonts.
While the project still contains numerous fonts, we have a project to unify all features and transition to using a single font. Our recommendation is to explore the use of one primary font style, with the flexibility to incorporate different typeface variations in your programming to achieve various typefaces using the same font.
Remove stale features and replace large library
Based on the data, it was discovered that a specific library, which was contributing approximately 8% to the overall app size, had an adverse impact. This library has since been removed from the project. Moreover, through analysing the Size Contribution by Third-Party Libraries dashboard, we identified duplicates in functions and have made efforts to eliminate these redundancies.
Moreover, in Grab, we are using the feature toggle to enable or disable a feature. The feature flags are controlled remotely. It’s very useful for running an experiment or turning off if a feature causes us any problems. So, many features in the project are controlled under a feature flag. In certain cases, even when some features are deactivated, the corresponding code remains included in the binary. We identify these cases and collaborate with teams to remove the redundant code.
After six months of working on the above initiatives, the Bonsai team managed to reduce the Grab app download size by 26%. This is particularly noteworthy, considering that prior to the commencement of the Bonsai Project, the average app size exhibited a monthly increase of approximately 1%.
Containment
After dedicating over a semester to the Reduce phase, we started the transition to the Containment phase. The first step for this phase involved setting up an App Growth Rate dashboard that presents the growth rate of app download size per release. Our goal is to keep this rate as low as possible.
The team has been discovering a few solutions, such as introducing the common UI design components to prevent duplication, and experimenting with Dynamic Delivery Feature. This phase of exploration is still ongoing and we are optimistic that it will help maintain a manageable app download size, or perhaps even contribute to further optimization.
Considering alternative initiatives, the team is contemplating recognising app size as a confined resource of our application. We believe it should be the responsibility of every team to maintain an optimal app size. Based on the measurements we have, which provide an insight into each team’s impact on the total app download size, it could be advantageous to allocate an ‘app size budget’ to each team. This would entail each team taking responsibility for managing and maintaining the size influenced by their work.
Conclusion
Grab’s Project Bonsai demonstrated the company’s commitment to optimising the app experience for users in Southeast Asia. By prioritising code optimisation, resource management, modularisation, and asset bundling, we achieved substantial optimisations in app size while enhancing user experience. These efforts not only addressed the challenges we outlined, but also contributed to increased user acquisition and improved user retention rates.
Join us
Grab is the leading superapp platform in Southeast Asia, providing everyday services that matter to consumers. More than just a ride-hailing and food delivery app, Grab offers a wide range of on-demand services in the region, including mobility, food, package and grocery delivery services, mobile payments, and financial services across 428 cities in eight countries.
Powered by technology and driven by heart, our mission is to drive Southeast Asia forward by creating economic empowerment for everyone. If this mission speaks to you, join our team today!
In the domain of data processing, data analysts run their ad hoc queries on the data lake. The lake serves as an interface between our analytics and production environment, preventing downstream queries from impacting upstream data ingestion pipelines. To ensure efficient data processing in the data lake, choosing appropriate storage formats is crucial.
The vanilla data lake solution is built on top of cloud object storage with Hive metastore, where data files are written in Parquet format. Although this setup is optimised for scalable analytics query patterns, it struggles to handle frequent updates to the data due to two reasons:
The Hive table format requires us to rewrite the Parquet files with the latest data. For instance, to update one record in a Hive unpartitioned table, we would need to read all the data, update the record, and write back the entire data set.
Writing Parquet files is expensive due to the overhead of organising the data to a compressed columnar format, which is more complex than a row format.
The issue is further exacerbated by the scheduled downstream transformations. These necessary steps, which clean and process the data for use, increase the latency because the total delay now includes the combined scheduled intervals of these processing jobs.
Fortunately, the introduction of the Hudi format, which supports fast writes by allowing Avro and Parquet files to co-exist on a Merge On Read (MOR) table, opens up the possibility of having a data lake with minimal data latency. The concept of a commit timeline further allows data to be served with Atomicity, Consistency, Isolation, and Durability (ACID) guarantees.
We employ different sets of configurations for the different characteristics of our input sources:
High or low throughput. A high-throughput source refers to one that has a high level of activity. One example of this can be our stream of booking events generated from each customer transaction. On the other hand, a low-throughput source would be one that has a relative low level of activity. An example of this can be transaction events generated from reconciliation happening on a nightly basis.
Kafka (unbounded) or Relational Database Sources (bounded). Our sinks have sources that can be broadly categorised into unbounded and bounded sources. Unbounded sources are usually related to transaction events materialised as Kafka topics, representing user-generated events as they interact with the Grab superapp. Bounded sources usually refer to Relational Database (RDS) sources, whose size is bound to storage provisioned.
The following sections will delve into the differences between each source and our corresponding configurations optimised for them.
High throughput source
For our data sources with high throughput, we have chosen to write the files in MOR format since the writing of files in Avro format allows for fast writes to meet our latency requirements.
Figure 1 Architecture for MOR tables
As seen in Figure 1, we use Flink to perform the stream processing and write out log files in Avro format in our setup. We then set up a separate Spark writer which periodically converts the Avro files into Parquet format in the Hudi compaction process.
We have further simplified the coordination between the Flink and Spark writers by enabling asynchronous services on the Flink writer so it can generate the compaction plans for Spark writers to act on. During the Spark job runs, it checks for available compaction plans and acts on them, placing the burden of orchestrating the writes solely on the Flink writer. This approach could help minimise potential concurrency problems that might otherwise arise, as there would be a single actor
orchestrating the associated Hudi table services.
Low throughput source
Figure 2 Architecture for COW tables
For low throughput sources, we gravitate towards the choice of Copy On Write (COW) tables given the simplicity of its design, since it only involves one component, which is the Flink writer. The downside is that it has higher data latency because this setup only generates Parquet format data snapshots at each checkpoint interval, which is typically about 10-15 minutes.
Connecting to our Kafka (unbounded) data source
Grab uses Protobuf as our central data format in Kafka, ensuring schema evolution compatibility. However, the derivation of the schema of these topics still requires some transformation to make it compatible with Hudi’s accepted schema. Some of these transformations include ensuring that Avro record fields do not contain just a single array field, and handling logical decimal schemas to transform them to fixed byte schema for Spark compatibility.
Given the unbounded nature of the source, we decided to partition it by Kafka event time up to the hour level. This ensured that our Hudi operations would be faster. Parquet file writes would be faster since they would only affect files within the same partition, and each Parquet file within the same event time partition would have a bounded size given the monotonically increasing nature of Kafka event time.
By partitioning tables by Kafka event time, we can further optimise compaction planning operations, since the amount of file lookups required is now reduced with the use of BoundedPartitionAwareCompactionStrategy. Only log files in recent partitions would be selected for compaction and the job manager need not list every partition to figure out which log files to select for compaction during the planning phase anymore.
Connecting to our RDS (bounded) data source
For our RDS, we decided to use the Flink Change Data Capture (CDC) connectors by Veverica to obtain the binlog streams. The RDS would then treat the Flink writer as a replication server and start streaming its binlog data to it for each MySQL change. The Flink CDC connector presents the data as a Kafka Connect (KC) Source record, since it uses the Debezium connector under the hood. It is then a straightforward task to deserialise these records and transform them into Hudi records, since
the Avro schema and associated data changes are already captured within the KC source record.
The obtained binlog timestamp is also emitted as a metric during consumption for us to monitor the observed data latency at the point of ingestion.
Optimising for these sources involves two phases:
First, assigning more resources for the cold start incremental snapshot process where Flink takes a snapshot of the current data state in the RDS and loads the Hudi table with that snapshot. This phase is usually resource-heavy as there are a lot of file writes and data ingested during this process.
Once the snapshotting is completed, Flink would then start to process the binlog stream and the observed throughput would drop to a level similar to the DB write throughput. The resources required by the Flink writer at this stage would be much lower than in the snapshot phase.
Indexing for Hudi tables
Indexing is important for upserting Hudi tables when the writing engine performs updates, allowing it to efficiently locate the file groups of the data to be updated.
As of version 0.14, the Flink engine only supports Bucket Index or Flink State Index. Bucket Index performs indexing of the file record by hashing the record key and matching it to a specific bucket of files indicated by the naming convention of the written data files. Flink State Index on the other hand stores the index map of record keys to files in memory.
Given that our tables include unbounded Kafka sources, there is a possibility for our state indexes to grow indefinitely. Furthermore, the requirement of state preservation for Flink State Index across version deployments and configuration updates adds complexity to the overall solution.
Thus, we opted for the simple Bucket Index for its simplicity and the fact that our Hudi table size per partition does not change drastically across the week. However, this comes with a limitation whereby the number of buckets cannot be updated easily and imposes a parallelism limit at which our Flink pipelines can scale. Thus, as traffic grows organically, we would find ourselves in a situation whereby our configuration grows obsolete and cannot handle the increased load.
To resolve this going forward, using consistent hashing for the Bucket Index would be something to explore to optimise our Parquet file sizes and allow the number of buckets to grow seamlessly as traffic grows.
Impact
Fresh business metrics
Post creation of our Hudi Data Ingestion solution, we have enabled various users such as our data analysts to perform ad hoc queries much more easily on data that has lower latency. Furthermore, Hudi tables can be seamlessly joined with Hive tables in Trino for additional context. This enabled the construction of operational dashboards reflecting fresh business metrics to our various operators, empowering them with the necessary information to quickly respond to any abnormalities (such as high-demand events like F1 or seasonal holidays).
Quicker fraud detection
Another significant user of our solution is our fraud detection analysts. This enabled them to rapidly access fresh transaction events and analyse them for fraudulent patterns, particularly during the emergence of a new attack pattern that hadn’t been detected by their rules engine. Our solution also allowed them to perform multiple ad hoc queries that involve lookbacks of various days’ worth of data without impacting our production RDS and Kafka clusters by using the data lake as the data interface, reducing the data latency to the minute level and, in turn, empowering them to respond more quickly to attacks.
What’s next?
As the landscape of data storage solutions evolves rapidly, we are eager to test and integrate new features like Record Level Indexing and the creation of Pre Join tables. This evolution extends beyond the Hudi community to other table formats such as IceBerg and DeltaLake. We remain ready to adapt ourselves to these changes and incorporate the advantages of each format into our data lake within Grab.
Grab is the leading superapp platform in Southeast Asia, providing everyday services that matter to consumers. More than just a ride-hailing and food delivery app, Grab offers a wide range of on-demand services in the region, including mobility, food, package and grocery delivery services, mobile payments, and financial services across 428 cities in eight countries.
Powered by technology and driven by heart, our mission is to drive Southeast Asia forward by creating economic empowerment for everyone. If this mission speaks to you, join our team today!
Generative AI coding tools are changing software production for enterprises. Not just for their code generation abilities—from vulnerability detection and facilitating comprehension of unfamiliar codebases, to streamlining documentation and pull request descriptions, they’re fundamentally reshaping how developers approach application infrastructure, deployment, and their own work experience.
We’re now witnessing a significant turning point. As AI models get better, refusing adoption would be like “asking an office worker to use a typewriter instead of a computer,” says Albert Ziegler, principal researcher and member of the GitHub Next research and development team.
In this post, we’ll dive into the inner workings of AI code generation, exploring how it functions, its capabilities and benefits, and how developers can use it to enhance their development experience while propelling your enterprise forward in today’s competitive landscape.
How to use AI to generate code
AI code generation refers to full or partial lines of code that are generated by machines instead of human developers. This emerging technology leverages advanced machine learning models, particularly large language models (LLMs), to understand and replicate the syntax, patterns, and paradigms found in human-generated code.
The AI models powering these tools, like ChatGPT and GitHub Copilot, are trained on natural language text and source code from publicly available sources that include a diverse range of code examples. This training enables them to understand the nuances of various programming languages, coding styles, and common practices. As a result, the AI can generate code suggestions that are syntactically correct and contextually relevant based on input from developers.
Favored by 55% of developers, our AI-powered pair programmer, GitHub Copilot, provides contextualized coding assistance based on your organization’s codebase across dozens of programming languages, and targets developers of all experience levels. With GitHub Copilot, developers can use AI to generate code in three ways:
1. Type code and AI can autocomplete the code
Autocompletions are the earliest version of AI code generation. John Berryman, a senior researcher of ML on the GitHub Copilot team, explains the user experience: “I’ll be writing code and taking a pause to think. While I’m doing that, the agent itself is also thinking, looking at surrounding code and content in neighboring tabs. Then it pops up on the screen as gray ‘ghost text’ that I can reject, partially accept, or fully accept and then, if necessary, modify.”
While every developer can reap the benefits of using AI coding tools, experienced programmers can often feel these gains even more so. “In many cases, especially for experienced programmers in a familiar environment, this suggestion speeds us up. I would have written the same thing. It’s just faster to hit ‘tab’ (thus accepting the suggestion) than it is to write out those 20 characters by myself,” says Johan Rosenkilde, principal researcher for GitHub Next.
Whether developers are new or highly skilled, they’ll often have to work in less familiar languages, and code completion suggestions using GitHub Copilot can lend a helping hand. “Using GitHub Copilot for code completion has really helped speed up my learning experience,” says Berryman. “I will often accept the suggestion because it’s something I wouldn’t have written on my own since I don’t know the syntax.”
Using an AI coding tool has become an invaluable skill in itself. Why? Because the more developers practice coding with these tools, the faster they’ll get at using them.
2. Explicit code comments codes using natural language to receive even better AI-generated code suggestions
For experienced developers in unfamiliar environments, tools like GitHub Copilot can even help jog their memories.
Let’s say a developer imports a new type of library they haven’t used before, or that they don’t remember. Maybe they’re looking to figure out the standard library function or the order of the argument. In these cases, it can be helpful to make GitHub Copilot more explicitly aware of where the developer wants to go by writing a comment.
“It’s quite likely that the developer might not remember the formula, but they can recognize the formula, and GitHub Copilot can remember it by being prompted,” says Rosenkilde. This is where natural language commentary comes into play: it can be a shortcut for explaining intent when the developer is struggling with the first few characters of code that they need.
If developers give specific names to their functions and variables, and write documentation, they can get better suggestions, too. That’s because GitHub Copilot can read the variable names and use them as an indicator for what that function should do.
Suddenly that changes how developers write code for the better, because code with good variable and function names are more maintainable. And oftentimes the main job of a programmer is to maintain code, not write it from scratch.
“When you push that code, someone is going to review it, and they will likely have a better time reviewing that code if it’s well named, if there’s even a hint of documentation in it, and so on,” says Rosenkilde. In this sense, the symbiotic relationship between the developer and the AI coding tool is not just beneficial for the developer, but for the entire team.
3. Chat directly with AI
With AI chatbots, code generation can be more interactive. GitHub Copilot Chat, for example, allows developers to interact with code by asking it to explain code, improve syntax, provide ideas, generate tests, and modify existing code—making it a versatile ally in managing coding tasks.
Rosenkilde uses the different functionalities of GitHub Copilot:
“When I want to do something and I can’t remember how to do it, I type the first few letters of it, and then I wait to see if Copilot can guess what I’m doing,” he says. “If that doesn’t work, maybe I delete those characters and I write a one liner in commentary and see whether Copilot can guess the next line. If that doesn’t work, then I go to Copilot Chat and explain in more detail what I want done.”
Typically, Copilot Chat returns with something much more verbose and complete than what you get from GitHub Copilot code completion. “Namely, it describes back to you what it is you want done and how it can be accomplished. It gives you code examples, and you can respond and say, oh, I see where you’re going. But actually I meant it like this instead,” says Rosenkilde.
But using AI chatbots doesn’t mean developers should be hands off. Mistakes in reasoning could lead the AI down a path of further mistakes if left unchecked. Berryman recommends that users should interact with the chat assistant in much the same way that you would when pair programming with a human. “Go back and forth with it. Tell the assistant about the task you are working on, ask it for ideas, have it help you write code, and critique and redirect the assistant’s work in order to keep it on the right track.”
The importance of code reviews
GitHub Copilot is designed to empower developers to execute their ideas. As long as there is some context for it to draw on, it will likely generate the type of code the developer wants. But this doesn’t replace code reviews between developers.
Code reviews play an important role in maintaining code quality and reliability in software projects, regardless of whether AI coding tools are involved. In fact, the earlier developers can spot bugs in the code development process, the cheaper it is by orders of magnitude.
Ordinary verification would be: does the code parse? Do the tests work? With AI code generation, Ziegler explains that developers should, “Scrutinize it in enough detail so that you can be sure the generated code is correct and bug-free. Because if you use tools like that in the wrong way and just accept everything, then the bugs that you introduce are going to cost you more time than you save.”
Rosenkilde adds, “A review with another human being is not the same as that, right? It’s a conversation between two developers about whether this change fits into the kind of software they’re building in this organization. GitHub Copilot doesn’t replace that.”
The advantages of using AI to generate code
When developer teams use AI coding tools across the software development cycle, they experience a host of benefits, including:
Faster development, more productivity
AI code generation can significantly speed up the development process by automating repetitive and time-consuming tasks. This means that developers can focus on high-level architecture and problem-solving. In fact, 88% of developers reported feeling more productive when using GitHub Copilot.
Rosenkilde reflects on his own experience with GitHub’s AI pair programmer: “95% of the time, Copilot brings me joy and makes my day a little bit easier. And this doesn’t change the code I would have written. It doesn’t change the way I would have written it. It doesn’t change the design of my code. All it does is it makes me faster at writing that same code.” And Rosenkilde isn’t alone: 60% of developers feel more fulfilled with their jobs when using GitHub Copilot.
Mental load alleviated
The benefits of faster development aren’t just about speed: they’re also about alleviating the mental effort that comes with completing tedious tasks. For example, when it comes to debugging, developers have to reverse engineer what went wrong. Detecting a bug can involve digging through an endless list of potential hiding places where it might be lurking, making it repetitive and tedious work.
Rosenkilde explains, “Sometimes when you’re debugging, you just have to resort to creating print statements that you can’t get around. Thankfully, Copilot is brilliant at print statements.”
In software development, context switching is when developers move between different tasks, projects, or environments, which can disrupt their workflow and decrease productivity. They also often deal with the stress of juggling multiple tasks, remembering syntax details, and managing complex code structures.
With GitHub Copilot developers can bypass several levels of context switching, staying in their IDE instead of searching on Google or jumping into external documentation.
“When I’m writing natural language commentary,” says Rosenkilde, “GitHub Copilot code completion can help me. Or if I use Copilot Chat, it’s a conversation in the context that I’m in, and I don’t have to explain quite as much.”
Generating code with AI helps developers offload the responsibility of recalling every detail, allowing them to focus on higher-level thinking, problem-solving, and strategic planning.
Berryman adds, “With GitHub Copilot Chat, I don’t have to restate the problem because the code never leaves my trusted environment. And I get an answer immediately. If there is a misunderstanding or follow-up questions, they are easy to communicate with.”
What to look for in enterprise-ready AI code generation tools
Before you implement any AI into your workflow, you should always review and test tools thoroughly to make sure they’re a good fit for your organization. Here are a few considerations to keep in mind.
Compliance
Regulatory compliance. Does the tool comply with relevant regulations in your industry?
Compliance certifications. Are there attestations that demonstrate the tool’s compliance with regulations?
Security
Encryption. Is the data transmission and storage encrypted to protect sensitive information?
Access controls. Are you able to implement strong authentication measures and access controls to prevent unauthorized access?
Compliance with security standards. Is the tool compliant with industry standards?
Security audits. Does the tool undergo regular security audits and updates to address vulnerabilities?
Privacy
Data handling. Are there clear policies for handling user data and does it adhere to privacy regulations like GDPR, CCPA, etc.?
Data anonymization. Does the tool support anonymization techniques to protect user privacy?
Permissioning
Role-based access control. Are you able to manage permissions based on user roles and responsibilities?
Granular permissions. Can you control access to different features and functionalities within the tool?
Opt-in/Opt-out mechanisms. Can users control the use of their data and opt out if needed?
Pricing
Understand the pricing model. is it based on usage, number of users, features, or other metrics?
Look for transparency. Is the pricing structure clear with no hidden costs?
Scalability. Does the pricing scale with your usage and business growth?
Additionally, consider factors such as customer support, ease of integration with existing systems, performance, and user experience when evaluating AI coding tools. Lastly, it’s important to thoroughly assess how well the tool aligns with your organization’s specific requirements and priorities in each of these areas.
Visit the GitHub Copilot Trust Center to learn more around security, privacy, and other topics.
Can AI code generation be detected?
The short answer here is: maybe.
Let’s first give some context to the question. It’s never really the case that a whole code base is generated with AI, because large chunks of AI-generated code are very likely to be wrong. The standard code review process is a good way to avoid this, since large swaths of completely auto-generated code would stand out to a human developer as simply not working.
For smaller amounts of AI-generated code, there is no way at the moment to detect traces of AI in code with true confidence. There are offerings that purport to classify whether content has AI-generated text, but there are limited equivalents for code, since you’d need a dedicated model to do it. Ziegler explains, “Computer generated code is good enough that it doesn’t leave any particular traces and normally has no clear tells.”
At GitHub, the Copilot team makes use of a duplicate detection filter that detects exact duplicates in code. So, if you’re writing code and it’s an exact copy of something that exists elsewhere, then it’ll flag it.
Is AI code generation secure?
AI code generation is not any more insecure than human generated code. A combination of testing, manual code reviews, scanning, monitoring, and feedback loops can produce the same quality of code as your human-generated code.
When it comes to code generated by GitHub Copilot, developers can use tools like code scanning, which actively reviews your code for potential security issues in real-time and seamlessly integrates the findings into the developer workflow.
Ultimately, AI code generation will have vulnerabilities—but so does code written by human developers. As Ziegler explains, “It’s unclear whether computer generated code does particularly worse. So, the answer is not if you have GitHub Copilot, use a vulnerability checker. The answer is always use a vulnerability checker.”
Watch this video for more tips and words of advice around secure coding best practices with AI.
Empower your enterprise with AI code generation
While the benefits to using AI code generation tools can be significant, it’s important to note that human oversight remains crucial to ensure that the generated code aligns with project goals, coding standards, and business needs.
Tech leaders should embrace the use of AI code generation—not only to streamline development, but also to empower developer teams to collaborate, drive meaningful business outcomes, and deliver exceptional value to customers.
Ready to get started with the world’s most widely adopted AI developer tool? Learn more or get started now.
The Grab superapp offers a comprehensive array of services from ride-hailing and food delivery to financial services. This creates multifaceted user journeys, traversing homepages, product pages, checkouts, and interactions with diverse content, including advertisements and promo codes.
Background: Why ads and attribution matter in our superapp
Ads are crucial for Grab in driving user engagement and supporting our ecosystem by seamlessly connecting users with our services. In the ever-evolving world of advertising, the ability to gauge the impact of marketing investments takes on pivotal significance. Advertisers dedicate substantial resources to promote their businesses, necessitating a clear understanding of the return on AdSpend (ROAS) for each campaign. In this context, attribution plays a central role, serving as the guiding compass for advertisers and marketers, elucidating the effectiveness of touchpoints within campaigns.
For instance, a merchant-partner seeks to enhance its reach by advertising on the Grab food delivery homepage. With the assistance of our attribution system, the merchant-partner can now precisely gauge the impact of their homepage ads on Grab. This involves tracking user engagement and monitoring the resulting orders that stem from these interactions. This level of granularity not only highlights the value of attribution but also demonstrates its capability in providing detailed insights into the effectiveness of advertising campaigns and enabling merchant-partners to optimise their campaigns with more precision.
In this blog, we delve into the technical intricacies, software architecture, challenges, and solutions involved in crafting a state-of-the-art engineering solution for the attribution platform.
Genesis: Pre-project landscape
When our journey began in 2020, Grab’s marketing efforts had limited attribution capabilities and data analytics was predominantly reliant on ad hoc queries conducted by business and data analysts. Before the introduction of a standardised approach, we had to manage discrepant results and a time-consuming manual process of data preparation, cleansing, and storage across teams. When issues arose in the analytical pipeline, resolution efforts took relatively longer and were reoccurring. We needed a comprehensive engineering solution that would address the identified gaps, and significantly enhance metrics related to ROI, attribution accuracy, and data-handling efficiency.
Inception: The pure ads attribution engine (Kappa architecture)
We chose Kappa architecture due to its imperative role in achieving near real-time attribution, especially in support of our new pricing model, cost per order (CPO). With this solution, we aimed to drastically reduce data latency from 2-3 days to just a few minutes. Traditional ETL (Extract, Transform, and Load) based batch processing methods were evaluated but quickly found to be inadequate for our purposes, mainly due to their speed.
In the advertising industry, rapid decision-making is critical. Traditional batch processing solutions would introduce significant latency, hampering our ability to make real-time, data-driven decisions. With its architecture’s inherent capability for real-time stream processing, Kappa emerged as the logical choice. Additionally, Kappa offers the agility required to empower our ad-serving team for real-time decision support, and better ad ranking and selection, enabling dynamic and effective targeting decisions without delay.
The first step on this journey was to create a pure and near real-time stream processing Ads Attribution Engine. This engine was based on the Kappa architecture to provide advertisers with quick insights into their ROAS offering real-time attribution, enabling advertisers to optimise their campaigns efficiently.
High-level workflow of the Ads Attribution Engine
In this solution, we used the following tools in our tech stack:
Kafka for event streams
DDB for events storage
Amazon S3 as the data lake
An in-house stream processing framework similar to Keystone
Redis for caching events
ScyllaDB for storing ad metadata
Amazon relational database service (RDS) for analytics
Architecture of the near real-time stream processing Ads Attribution Engine
Evolution: Merging marketing levers – Ads and promos
We began to envision a world where we could merge various marketing levers into a unified Attribution Engine, starting with ads and promos. This evolved vision also aimed to prevent order double counting (when a user interacts with both ads and promos in the same checkout), which would provide a more holistic attribution solution.
With the unified Attribution Engine, we would also enable more sophisticated personalisation through machine learning models and drive higher conversions.
The unified Attribution Engine workflow, which included Promo touch points
The unified attribution engine used mostly the same tech stack, except for analytics where Druid was used instead of RDS.
Architecture of the unified Attribution Engine
Introspection: Identifying shortcomings and the path to improvement
While the unified attribution engine was a step in the right direction, it wasn’t without its challenges. There were challenges related to real-time data processing costs, scalability for longer attribution windows, latency and lag issues, out-of-order events leading to misattribution, and the complexity of implementing multi-touch attribution models. To truly empower advertisers and enhance the attribution process, we knew we needed to evolve further.
Rebirth: The birth of a full-fledged attribution platform (Lambda architecture)
This journey eventually led us to build a full-fledged attribution platform using Lambda architecture, which blended both batch and real-time stream processing methods. With this change, our platform could rapidly and accurately process data and attribute the impact of ads and promos on user behaviour.
Why Lambda architecture?
This choice was a strategic one – real-time processing is vital for tracking events as they occur, but it offers only a current snapshot of user behaviour. This means we would not be able to analyse historical data, which is a crucial aspect of accurate attribution and exploring multiple attribution models. Historical data allows us to identify trends, patterns, and correlations not evident in real-time data alone.
High level workflow for the full-fledged attribution platform with Lambda architecture
In this system’s tech stack, the key components are:
Coban, an in-house stream processing framework used for real-time data processing
Spark-based ETL jobs for batch processing
Amazon S3 as the data warehouse
An offline layer that is capable of providing historical context, handling large data volumes, performing complex analytics, and so on.
Key benefits of the offline layer
Provides historical context: The offline layer enriches the attribution process by providing a historical perspective on user interactions, essential for precise attribution analysis spanning extended time periods.
Handles enormous data volumes: This layer efficiently manages and processes extensive data generated by advertising campaigns, ensuring that attribution seamlessly accommodates large-scale data sets.
Performs complex analytics: Enables more intricate computations and data analysis than real-time processing alone, the offline layer is instrumental in fine-tuning attribution models and enhancing their accuracy.
Ensures reliability in the face of challenges: By providing fault tolerance and resilience against system failures, the offline layer ensures the continuous and dependable operation of the attribution system, even during unexpected events.
Optimises data storage and serving: Relying on Amazon S3, the storage layer for raw data optimises storage by building interactive reporting APIs.
Architecture of our comprehensive offline attribution platform
Challenges with Lambda and mitigation
Lambda architecture allows us to have the accuracy and robustness of batch processing along with real-time stream processing. However, we noticed some drawbacks that may lead to complexity due to maintaining both batch and stream processing:
Operating two parallel systems for batch and stream processing can lead to increased complexity in production environments.
Lambda architecture requires two sets of business logic – one for the batch layer and another for the stream layer.
Synchronisation across both layers can make system alterations more challenging.
This dual implementation could also allude to inconsistencies and introduce potential bugs into the system.
To mitigate these complications, we’re establishing an optimisation strategy for our current system. By distinctly separating the responsibilities of our real-time pipelines from those of our offline jobs, we intend to harness the full potential of each approach, while simultaneously curbing the added complexity.
Hence, redefining the way we utilise Lambda architecture, striking an efficient balance between real-time responsiveness and sturdy accuracy with the below proposal.
Vanguard: Enhancements in the future
In the coming months, we will be implementing the optimisation strategy and improving our attribution platform solution. This strategy can be broken down into the following sections.
Real-time pipeline handling time-sensitive data: Real-time pipelines can process and deliver time-sensitive metrics like CPO-related data in near real-time, allowing for budget capping and immediate adjustments to marketing spend. This can provide us with actionable insights that can help with areas like real-time bidding, real-time marketing, or dynamic pricing. By limiting the volume of data through the real-time path, we can ensure it’s more manageable and focused on immediate actionable data.
Batch jobs handling all other reporting data: Batch processing is best suited for computations that are not time-bound and where completeness is more important. By dedicating more time to the processing phase, batch processing can handle larger volumes and more complex computations, providing more comprehensive and accurate reporting.
This approach will simplify our Lambda architecture, as the batch and real-time pipelines will have clear separation of duties. It may also reduce the chance of discrepancies between the real-time and batch-processing datasets and lower the operational load of our real-time system.
Conclusion: A holistic attribution picture
Through our journey of building a comprehensive attribution platform, we can now deliver a holistic and dependable view of user behaviour and empower merchant-partners to use insights from advertisements and promotions. This journey has been a long one, but we were able to improve our attribution solution in several ways:
Attribution latency: Successfully reduced attribution latency from 2-3 days to just a few minutes, ensuring that advertisers can access real-time insights and feedback.
Data accuracy: Through improved data collection and processing, we achieved data discrepancies of less than 1%, enhancing the accuracy and reliability of attribution data.
Conversion rate: Advertisers witnessed a significant increase in conversion rates, a direct result of our real-time attribution capabilities.
Cost efficiency: Embracing the Lambda architecture led to a ~25% reduction in real-time data processing costs, allowing for more efficient campaign optimisations.
Operational resilience: Building an offline layer provided fault tolerance and resilience against system failures, ensuring that our attribution system continued to operate seamlessly, even during unexpected events.
Join us
Grab is the leading superapp platform in Southeast Asia, providing everyday services that matter to consumers. More than just a ride-hailing and food delivery app, Grab offers a wide range of on-demand services in the region, including mobility, food, package and grocery delivery services, mobile payments, and financial services across 428 cities in eight countries.
Powered by technology and driven by heart, our mission is to drive Southeast Asia forward by creating economic empowerment for everyone. If this mission speaks to you, join our team today!
In January, we experienced three incidents that resulted in degraded performance across GitHub services.
January 09 12:20 UTC (lasting 140 minutes)
On January 9 between 12:20 and 14:40 UTC, services in one of our three sites experienced elevated latency for connections. This led to a sustained period of timed-out requests across a number of services, including but not limited to our Git backend. An average of 5% and max of 10% of requests failed with a 5xx response or timed out during this period.
This was caused by an upgrade of hosts, which led to temporarily reduced capacity as the upgrade rolled through the fleet. While these hosts had plenty of capacity to handle the increased load, we found that the configured connection limit was lower than it should have been. We have increased that limit to prevent this from recurring. We have also identified improvements to our monitoring of connection limits and behavior and changes to reduce the risk of host upgrades leading to reduced capacity.
January 21 02:01 UTC (lasting 7 hours 3 minutes)
On January 21 at 2:01 UTC, we experienced an incident that affected customers using GitHub Codespaces. Customers encountered issues creating and resuming Codespaces in multiple regions due to operational issues with compute and storage resources.
Around 25% of customers were impacted, primarily in East US and West Europe. We re-routed traffic for Codespace creations to less impacted regions, but existing Codespaces in these regions may have been unable to resume during the incident.
By 7:30 UTC, we had recovered connectivity to all regions except West Europe, which had an extended recovery time due to increased load in that particular region. The incident was resolved on January 21 at 9:34 UTC once Codespace creations and resumes were working normally in all regions.
We are working to improve our alerting and resiliency to reduce the duration and impact of region-specific outages.
January 31 12:30 UTC (lasting 147 minutes)
On January 31, we deployed an infrastructure change to our load balancers in preparation towards our longer term goal of IPv6 enablement at GitHub.com. This change was deployed to a subset of our global edge sites. The change had the unintended consequence of causing IPv4 addresses to start being passed as an IPv4-mapped IPv6-compatible address (for example, 10.1.2.3 became ::ffff:10.1.2.3) to our IP Allow List functionality. While our IP Allow List functionality was developed with IPv6 in mind, it wasn’t developed to handle these mapped addresses, and hence, started blocking requests as it deemed these to be not in the defined list of allowed addresses. Request error rates peaked at 0.23% of all requests.
In addition to changes deployed to remediate the issues, we have taken steps to improve testing and monitoring to better catch these issues in the future.
Please follow our status page for real-time updates on status changes and post-incident recaps. To learn more about what we’re working on, check out the GitHub Engineering Blog.
In November 2023, we announced the launch of code scanning autofix, leveraging AI to suggest fixes for security vulnerabilities in users’ codebases. This post describes how autofix works under the hood, as well as the evaluation framework we use for testing and iteration.
What is code scanning autofix?
GitHub code scanning analyzes the code in a repository to find security vulnerabilities and other errors. Scans can be triggered on a schedule or upon specified events, such as pushing to a branch or opening a pull request. When a problem is identified, an alert is presented to the user. Code scanning can be used with first- or third-party alerting tools, including open source and private tools. GitHub provides a first party alerting tool powered by CodeQL, our semantic code analysis engine, which allows querying of a codebase as though it were data. Our in-house security experts have developed a rich set of queries to detect security vulnerabilities across a host of popular languages and frameworks. Building on top of this detection capability, code scanning autofix takes security a step further, by suggesting AI-generated fixes for alerts. In its first iteration, autofix is enabled for CodeQL alerts detected in a pull request, beginning with JavaScript and TypeScript alerts. It explains the problem and its fix strategy in natural language, displays the suggested fix directly in the pull request page, and allows the developer to commit, dismiss, or edit the suggestion.
The basic idea behind autofix is simple: when a code analysis tool such as CodeQL detects a problem, we send the affected code and a description of the problem to a large language model (LLM), asking it to suggest code edits that will fix the problem without changing the functionality of the code. The following sections delve into some of the details and subtleties of constructing the LLM prompt, processing the model’s response, evaluating the quality of the feature, and serving it to our users.
The autofix prompt
At the core of our technology lies a request to an LLM, expressed through an LLM prompt. CodeQL static analysis detects a vulnerability, generating an alert that references the problematic code location as well as any other relevant locations. For example, for a SQL-injection vulnerability, the alert flags the location where tainted data is used to build a database query, and also includes one or more flow paths showing how untrusted data may reach this location without sanitization. We extract information from the alert to construct an LLM prompt consisting of:
General information about this type of vulnerability, typically including a general example of the vulnerability and how to fix it, extracted from the CodeQL query help.
The source-code location and content of the alert message.
Relevant code snippets from the locations all along the flow path and any code locations referenced in the alert message.
Specification of the response we expect.
We then ask the model to show us how to edit the code to fix the vulnerability.
We describe a strict format for the model output, to allow for automated processing. The model outputs Markdown consisting of the following sections:
Detailed natural language instructions for fixing the vulnerability.
A full specification of the needed code edits, following the format defined in the prompt.
A list of dependencies that should be added to the project, if applicable. This is needed, for example, if the fix makes use of a third-party sanitization library on which the project does not already depend.
We surface the natural language explanation to users together with the code scanning alert, followed by a diff patch constructed from the code edits and added dependencies. Users can review the suggested fix, edit and adjust it if necessary, and apply it as a commit in their pull request.
Pre- and post-processing
If our goal were to produce a nice demo, this simple setup would suffice. Supporting real-world complexity and overcoming LLM limitations, however, requires a combination of careful prompt crafting and post-processing heuristics. A full description of our approach is beyond the scope of this post, but we outline some of the more impactful aspects below.
Selecting code to show the model
CodeQL alerts include location information for the alert and sometimes steps along the data flow path from the source to the sink. Sometimes additional source-code locations are referenced in the alert message. Any of these locations may require edits to fix the vulnerability. Further parts of the codebase, such as the test suite, may also need edits, but we focus on the most likely candidates due to prompt length constraints.
For each of these code locations, we use a set of heuristics to select a surrounding region that provides the needed context while minimizing lines of code, eliding less relevant parts as needed to achieve the target length. The region is designed to include the imports and definitions at the top of the file, as these often need to be augmented in the fix suggestion. When multiple locations from the CodeQL alert reside in the same file, we structure a combined code snippet that gives the needed context for all of them.
The result is a set of one or more code snippets, potentially from multiple source-code files, showing the model the parts of the project where edits are most likely to be needed, with line numbers added so as to allow reference to specific lines both in the model prompt and in the model response. To prevent fabrications, we explicitly constrain the model to make edits only to the code included in the prompt.
Adding dependencies
Some fixes require adding a new project dependency, such as a data sanitation library. To do so, we need to find the configuration file(s) that list project dependencies, determine whether the needed packages are already included, and if not make the needed additions. We could use an LLM for all these steps, but this would require showing the LLM the list of files in the codebase as well as the contents of the relevant ones. This would increase both the number of model calls and the number of prompt tokens. Instead, we simply ask the model to list external dependencies used in its fix. We implement language-specific heuristics to locate the relevant configuration file, parse it to determine whether the needed dependencies already exist, and if not add the needed edits to the diff patch we produce.
Specifying a format for code edits
We need a compact format for the model to specify code edits. The most obvious choice would be asking the model to output a standard diff patch directly. Unfortunately, experimentation shows that this approach exacerbates the model’s known difficulties with arithmetic, often yielding incorrect line number computations without enough code context to make heuristic corrections. We experimented with several alternatives, including defining a fixed set of line edit commands the model can use. The approach that yielded the best results in practice involves allowing the model to provide “before” and “after” code blocks, demonstrating the snippets that require changes (including some surrounding context lines) and the edits to be made.
Overcoming model errors
We employ a variety of post-processing heuristics to detect and correct small errors in the model output. For example, “before” code blocks might not exactly match the original source-code, and line numbers may be slightly off. We implement a fuzzy search to match the original code, overcoming and correcting errors in indentation, semicolons, code comments, and the like. We use a parser to check for syntax errors in the edited code. We also implement semantic checks such as name-resolution checks and type checks. If we detect errors we are unable to fix heuristically, we flag the suggested edit as (partially) incorrect. In cases where the model suggests new dependencies to add to the project, we verify that these packages exist in the ecosystem’s package registry and check for known security vulnerabilities or malicious packages.
Evaluation and iteration
To make iterative improvements to our prompts and heuristics while at the same time minimizing LLM compute costs, we need to evaluate fix suggestions at scale. In taking autofix from demo quality to production quality, we relied on an extensive automated test harness to enable fast evaluation and iteration.
The first component of the test harness is a data collection pipeline that processes open source repositories with code scanning alerts, collecting alerts that have test coverage for the alert location. For JavaScript / TypeScript, the first supported languages, we collected over 1,400 alerts with test coverage from 63 CodeQL queries.
The second component of the test harness is a GitHub Actions workflow that runs autofix on each alert in the evaluation set. After committing the generated fix in a fork, the workflow runs both CodeQL and the repository’s test suite to evaluate the validity of the fix. In particular, a fix is considered successful only if:
It removes the CodeQL alert.
It introduces no new CodeQL alerts.
It produces no syntax errors.
It does not change the outcome of any of the repository tests.
As we iterated on the prompt, the code edit format, and various post-processing heuristics, we made use of this test harness to ensure that our changes were improving our success rate. We coupled the automated evaluations with periodic manual triage, to focus our efforts on the most prevalent problems, as well as to validate the accuracy of the automated framework. This rigorous approach to data-driven development allowed us to triple our success rate while at the same time reducing LLM compute requirements by a factor of six.
Architecture, infrastructure, and user experience
Generating useful fixes is a first step, but surfacing them to our users requires further front- and back-end modifications. Designing for simplicity, we’ve built autofix on top of existing functionality wherever possible. The user experience enhances the code scanning pull request experience. Along with a code scanning alert, users can now see a suggested fix, which may include suggested changes in multiple files, optionally outside the scope of the pull request diff. A natural language explanation of the fix is also displayed. Users can commit the suggested fixes directly to the pull request, or edit the suggestions in their local IDE or in a GitHub Codespace.
The backend, too, is built on top of existing code scanning infrastructure, making it seamless for our users. Customers do not need to make any changes to their code scanning workflows to see fix suggestions for supported CodeQL queries.
The user opens a pull request or pushes a commit. Code scanning runs as usual, as part of an actions workflow or workflow in a third-party CI system, uploading the results in the SARIF format to the code scanning API. The code scanning backend service checks whether the results are for a supported language. If so, it runs the fix generator as a CLI tool. The fix generator leverages the SARIF alert data, augmented with relevant pieces of source-code from the repository, to craft a prompt for the LLM. It calls the LLM via an authenticated API call to an internally-deployed API running LLMs on Azure. The LLM response is run through a filtering system which helps prevent certain classes of harmful responses. The fix generator then post-processes the LLM response to produce a fix suggestion. The code scanning backend stores the resulting suggestion, making it available for rendering alongside the alert in pull request views. Suggestions are cached for reuse where possible, reducing LLM compute requirements.
As with all GitHub products, we followed standard and internal security procedures, and put our architectural design through a rigorous security and privacy review process to safeguard our users. We also took precautions against AI-specific risks such as prompt injection attacks. While software security can never be fully guaranteed, we conducted red team testing to stress-test our model response filters and other safety mechanisms, assessing risks related to security, harmful content, and model bias.
Telemetry and monitoring
Before launching autofix, we wanted to ensure that we could monitor performance and measure its impact in the wild. We don’t collect the prompt or the model responses because these may contain private user code. Instead, we collect anonymized, aggregated telemetry on user interactions with suggested fixes, such as the percentage of alerts for which a fix suggestion was generated, the percentage of suggestions that were committed as-is to the branch, the percentage of suggestions that were applied through the GitHub CLI or Codespace, the percentage of suggestions that were dismissed, and the fix rate for alerts with suggestions versus alerts without. As we onboard more users onto the beta program, we’ll look at this telemetry to understand the usefulness of our suggestions.
Additionally, we’re monitoring the service for errors, such as overloading of the Azure model API or triggering of the filters that block harmful content. Before expanding autofix to unlimited public beta and eventually general availability, we want to ensure a consistent, stable user experience.
What’s next?
As we roll out the code scanning autofix beta to an increasing number of users, we’re collecting feedback, fixing papercuts, and monitoring metrics to ensure that our suggestions are in fact useful for security vulnerabilities in the wild. In parallel, we’re expanding autofix to more languages and use cases, and improving the user experience. If you want to join the public beta, sign up here. Keep an eye out for more updates soon!
The npm engineering team recently transitioned to using GitHub Codespaces for local development for npm registry services. This shift to Codespaces has substantially reduced the friction of our inner development loop and boosted developer productivity. In this post, we would like to share our experiences and learnings from this transition, hoping this information may be useful to you.
What are npm registry services
npm registry services, the Node.js microservices that power the npm registry, are distributed across 30+ different repositories. Each microservice has its own repository and is containerized using Docker. With Codespaces, we develop npm registry services using Docker on Codespaces with Visual Studio Code.
Codespaces reduces the friction of inner dev loop
Prior to Codespaces, a significant hurdle in npm local development was the difficulty in testing code across multiple services. We lacked a straightforward way to run multiple registry services locally, instead relying on our staging environment for testing. For example, to verify a code change in one service that affected a user workflow involving five other services, we could only run that service locally and connect to the remaining five in the staging environment. Due to security reasons, access to our staging environment is only possible via a VPN, adding another layer of complexity to the code testing process.
Codespaces addressed this issue by simplifying the process of running multiple registry services locally. When working in a codespace we no longer need a VPN connection for the inner dev loop. This change spares the team from potential issues related to VPN connectivity, and significantly simplifies the process of getting started.
As developers, we often rely on breakpoints for debugging. Now, with all registry services running within a single workspace, we can debug code and hit breakpoints across multiple services in Visual Studio Code as if they were one service. This is a significant improvement over previous developer experience, where hitting breakpoints in the services within the staging environment was not possible.
Codespaces boosts developer productivity
Codespaces has made it easier for outside contributors to participate. For example, if a GitHub engineer outside of the npm team wishes to contribute, they can get started within minutes with Codespaces, as the development environment is pre-configured and ready to go. Previously, setting up the development environment and granting permissions to access the staging resources would take days and often resulted in partners from other teams like design simply not contributing.
Port forwarding gives us access to TCP ports running within a codespace. Automatic port forwarding in Codespaces allows us to access services from a browser on our local machine for testing and debugging.
The in browser Codespaces experience, powered by Visual Studio Code for the Web, offers the flexibility to work from any computer. This is particularly helpful when you are away from your primary work computer, but need to test a quick change. The Web-based Codespaces experience provides a zero-install experience running entirely in your browser.
Remember those times when you were bogged down with a local environment issue that was not only time-consuming to troubleshoot but also difficult to reproduce on other machines? With Codespaces, you can quickly spin up a new Codespaces instance within minutes for a fresh start. The best part? There’s no need to fix the issue; you can simply discard the old codespace.
Things we learned from our use of Codespaces
Codespaces has tons of features to save you time and automate processes. Here are a few tips we learned from our use of Codespaces.
The prebuild feature of Codespaces is an excellent way to speed up the creation of a new codespace by creating a snapshot of your devcontainer and caching all the cloned repositories that can be used at startup time for the codespace. Codespaces prebuilds enable you to select branches and leverage GitHub Actions for automatic updates of these prebuilds.
You can store account-specific development secrets, such as access tokens, in Codespaces on a per-repository basis, ensuring secure usage within Codespaces. Those secrets are available as environment variables in your environment.
Another tip is specific to the Visual Studio Code Dev Container. Consider utilizing the Dev Container’s lifecycle events (such as postCreateCommand in devcontainer.json) to automate the Codespaces setup as much as possible. Ultimately, it’s a balance between time saved through automation and time invested in building and maintaining it. However, automation typically results in greater time savings because everyone who uses the configuration benefits.
Another trick is to use GitHub dotfiles to personalize your Codespaces. Dotfiles are files and folders on Unix-like systems starting with . that control the configuration of applications and shells on your system. You can use GitHub dotfiles to set up your personalized settings in Codespaces.
Conclusion
The adoption of GitHub Codespaces has substantially improved the developer experience of working on npm registry services. It has not only reduced the development environment setup time from hours to minutes but also facilitated better debugging experiences. Furthermore, it provides time-saving features like prebuilds. We hope this blog post offers valuable insights into our use of Codespaces. For more information, please refer to Codespaces documentation.
How do we ensure over 100 million users across the world have uninterrupted access to GitHub’s products and services on a platform that is always available, secure, and accessible? From our beginnings as a platform for open source to now also supporting 90% of the Fortune 100, that is the ongoing challenge we face and hold ourselves accountable for delivering across our engineering organization.
Establishing engineering governance
To meet the needs of our increased number of enterprise customers and our continuing innovation across the GitHub platform, we needed to address tech debt, improve reliability, and enhance observability of our engineering systems. This led to the birth of GitHub’s engineering governance program called the Fundamentals program. Our goal was to work cross-functionally to define, measure, and sustain engineering excellence with a vision to ensure our products and services are built right for all users.
What is the Fundamentals program?
In order for such a large-scale program to be successful, we needed to tackle not only the processes but also influence GitHub’s engineering culture. The Fundamentals program helps the company continue to build trust and lead the industry in engineering excellence, by ensuring that there is clear prioritization of the work needed in order for us to guarantee the success of our platform and the products that you love.
We do this via the lens of three program pillars, which help our organization understand the focus areas that we emphasize today:
Accessibility (A11Y): Truly be the home for all developers
Security: Serve as the most trustworthy platform for developers
Availability: Always be available and on for developers
In order for this to be successful, we’ve relied on both grass-roots support from individual teams and strong and consistent sponsorship from our engineering leadership. In addition, it requires meaningful investment in the tools and processes to make it easy for engineers to measure progress against their goals. No one in this industry loves manual processes and here at GitHub we understand anything that is done more than once must be automated to the best of our ability.
How do we measure progress?
We use Fundamental Scorecards to measure progress against our Availability, Security, and Accessibility goals across the engineering organization. The scorecards are designed to let us know that a particular service or feature in GitHub has reached some expected level of performance against our standards. Scorecards align to the fundamentals pillars. For example, the secret scanning scorecard aligns to the Security pillar, Durable Ownership aligns to Availability, etc. These are iteratively evolved by enhancing or adding requirements to ensure our services are meeting our customer’s changing needs. We expect that some scorecards will eventually become concrete technical controls such that any deviation is treated as an incident and other automated safety and security measures may be taken, such as freezing deployments for a particular service until the issue is resolved.
Each service has a set of attributes that are captured and strictly maintained in a YAML file, such as a service tier (tier 0 to 3 based on criticality to business), quality of service (QoS values include critical, best effort, maintenance and so on based on the service tier), and service type that lives right in the service’s repo. In addition, this file also has the ownership information of the service, such as the sponsor, team name, and contact information. The Fundamental scorecards read the service’s YAML file and start monitoring the applicable services based on their attributes. If the service does not meet the requirements of the applicable Fundamental scorecard, an action item is generated with an SLA for effective resolution. A corresponding issue is automatically generated in the service’s repository to seamlessly tie into the developer’s workflow and meet them where they are to make it easy to find and resolve the unmet fundamental action items.
Through the successful implementation of the Fundamentals program, we have effectively managed several scorecards that align with our Availability, Security, and Accessibility goals, including:
Durable ownership: maintains ownership of software assets and ensures communication channels are defined. Adherence to this fundamental supports GitHub’s Availability and Security.
Code scanning: tracks security vulnerabilities in GitHub software and uses CodeQL to detect vulnerabilities during development. Adherence to this fundamental supports GitHub’s Security.
Secret scanning: tracks secrets in GitHub’s repositories to mitigate risks. Adherence to this fundamental supports GitHub’s Security.
Incident readiness: ensures services are configured to alert owners, determine incident cause, and guide on-call engineers. Adherence to this fundamental supports GitHub’s Availability.
Accessibility: ensures products and services follow our accessibility standards. Adherence to this fundamental enables developers with disabilities to build on GitHub.
Example secret scanning scorecard
A culture of accountability
As much emphasis as we put on Fundamentals, it’s not the only thing we do: we ship products, too!
We call it the Fundamentals program because we also make sure that:
We include Fundamentals in our strategic plans. This means our organization prioritizes this work and allocates resources to accomplish the fundamental goals we each quarter. We track the goals on a weekly basis and address the roadblocks.
We surface and manage risks across all services to the leaders so they can actively address them before they materialize into actual problems.
We provide support to teams as they work to mitigate fundamental action items.
It’s clearly understood that all services, regardless of team, have a consistent set of requirements from Fundamentals.
Planning, managing, and executing fundamentals is a team affair, with a program management umbrella.
Designated Fundamentals champions and delegates help maintain scorecard compliance, and our regular check-ins with engineering leaders help us identify high-risk services and commit to actions that will bring them back into compliance. This includes:
Executive sponsor. The executive sponsor is a senior leader who supports the program by providing resources, guidance, and strategic direction.
Pillar sponsor. The pillar sponsor is an engineering leader who oversees the overarching focus of a given pillar across the organization as in Availability, Security, and Accessibility.
Directly responsible individual (DRI). The DRI is an individual responsible for driving the program by collaborating across the organization to make the right decisions, determine the focus, and set the tempo of the program.
Scorecard champion. The scorecard champion is an individual responsible for the maintenance of the scorecard. They add, update, and deprecate the scorecard requirements to keep the scorecard relevant.
Service sponsors. The sponsor oversees the teams that maintain services and is accountable for the health of the service(s).
Fundamentals delegate. The delegate is responsible for coordinating Fundamentals work with the service owners within their org, supporting the Sponsor to ensure the work is prioritized, and resources committed so that it gets completed.
Results-driven execution
Making the data readily available is a critical part of the puzzle. We created a Fundamentals dashboard that shows all the services with unmet scorecards sorted by service tier and type and filtered by service owners and teams. This makes it easier for our engineering leaders and delegates to monitor and take action towards Fundamental scorecards’ adherence within their orgs.
As a result:
Our services comply with durable ownership requirements. For example, the service must have an executive sponsor, a team, and a communication channel on Slack as part of the requirements.
We resolved active secret scanning alerts in repositories affiliated with the services in the GitHub organization. Some of the repositories were 15 years old and as a part of this effort we ensured that these repos are durably owned.
Business critical services are held to greater incident readiness standards that are constantly evolving to support our customers.
Service tiers are audited and accurately updated so that critical services are held to the highest standards.
Example layout and contents of Fundamentals dashboard
Tier 1 Services Out of Compliance [Count: 2]
Service Name
Service Tier
Unmet Scorecard
Exec Sponsor
Team
service_a
1
incident-readiness
john_doe
github/team_a
service_x
1
code-scanning
jane_doe
github/team_x
Continuous monitoring and iterative enhancement for long-term success
By setting standards for engineering excellence and providing pathways to meet through standards through culture and process, GitHub’s Fundamentals program has delivered business critical improvements within the engineering organization and, as a by-product, to the GitHub platform. This success was possible by setting the right organizational priorities and committing to them. We keep all levels of the organization engaged and involved. Most importantly, we celebrate the wins publicly, however small they may seem. Building the culture of collaboration, support, and true partnership has been key to sustaining the ongoing momentum of an organization-wide engineering governance program, and the scorecards that monitor the availability, security, and accessibility of our platform so you can consistently rely on us to achieve your goals.
In this digital age, companies collect multitudes of data that enable the tracking of business metrics and performance. Over the years, data analytics tools for data storage and processing have evolved from the days of Excel sheets and macros to more advanced Map Reduce model tools like Spark, Hadoop, and Hive. This evolution has allowed companies, including Grab, to perform modern analytics on the data ingested into the Data Lake, empowering them to make better data-driven business decisions. This form of data will be referenced within this document as “Offline Data”.
With innovations in stream processing technology like Spark and Flink, there is now more interest in unlocking value from streaming data. This form of continuously-generated data in high volume will be referenced within this document as “Online Data”. In the context of Grab, the streaming data is usually materialised as Kafka topics (“Kafka Stream”) as the result of stream processing in its framework. This data is largely unexplored until they are eventually sunk into the Data Lake as Offline Data, part of the data journey (see Figure 1 below). This induces some data latency before the data can be used by data analysts to inform decisions.
Figure 1. Simplified data journey for Offline Data vs. Online Data, from data generation to data analysis.
As seen in Figure 1 above, the Time to Value (“TTV”) of Online Data is shorter as compared to that of Offline Data in a simplified data journey from data generation to data analysis where complexities of data cleaning and transformation have been removed. This is because the role of the data analyst or data scientist (“Data End User”) has been enabled forward to the Kafka stage for Online Data instead of the Data Lake stage for Offline Data. We recognise that allowing earlier data exploration on Online Data allows Data End Users to build context around the data inputs they are using in an earlier stage. This can help them process Offline Data more meaningfully in subsequent stages. We are interested in opening up the possibility for Data End Users to at least explore the Online Data before they architect a full solution to clean and/or process the data directly or more efficiently post-ingestion into the Data Lake. After their data exploration, the users would have more information to decide whether to spin up a stream processing pipeline for Online Data, or to continue processing Offline Data with their current solution, but with a more refined understanding and logic strategy against their source data inputs. However, of course, in this blog, we acknowledge that not all analysis on Online Data could be done in this manner.
Problem statement
Online Data is underutilised within Grab mainly because of, among other reasons, difficulty in performing data exploration on data that is not yet properly stored in the Data Lake.
For the purpose of this blog post, we will focus only on the problem of exploration of Online Data because this problem is the precursor to allowing us to fully democratise such data.
The problem of data exploration manifests itself when Data End Users need to find the proper data inputs to base and develop their data models. These users would then often need to parse through a multitude of documentation and connect with multiple upstream data producers, to know the range of data signals that are currently available and understand what each data signal is trying to measure.
Given the ephemeral nature of Online Data, this implies that the lack of correct tool adoption to seamlessly perform quick tests with application logic on Online Data disincentivises the Data End Users to work on these Online Data. Testing such logic on Offline Data is generally much easier since iteration testing on the exact same dataset is possible.
This difficulty in performing data exploration including ad hoc queries on Online Data has therefore made development of stream processing applications hard for Data End Users, creating headwinds in Grab’s aim to evolve from making data-driven business decisions to also making data-driven operation decisions. Doing both would allow Grab to react much quicker to abrupt changes in its business landscape.
Adoption of Zeppelin notebook environment
To address the difficulty in performing data exploration on Online Data, we have adopted Apache Zeppelin, a web-based notebook that enables data-drive, interactive data analytics with the support of multiple interpreters to work with various data processing backends e.g. Spark, Flink. The full solution of the adopted Zeppelin notebook environment is enabled seamlessly within our internal data-streaming platform, through its control plane. If you are interested, you may check out our previous blog post titled An elegant platform for more details on the abovementioned streaming platform and its control plane.
Figure 2. Zeppelin login page via web-based notebook environment.
As seen from Figure 2 above, after successful creation of the Zeppelin cluster, users can log in with their generated credentials delivered to them via the integrated instant messenger, and start using the notebook environment.
Figure 3. Zeppelin programme flow in the notebook environment.
Figure 3 above explains the Zeppelin notebook programme flow as follows:
The users enter their queries into the notebook session and run querying statements interactively with the established web-based notebook session.
The queries are passed to the Flink interpreter within the cluster to generate the Flink job as a Jar file, to be then submitted to a Flink session cluster.
When the Flink session cluster job manager receives the job, it would spin up the corresponding Flink task managers (workers) to run the application and retrieve the results.
The query results would then be piped back to the notebook session, to be displayed back to the user on the notebook session.
Data query and visualisation
Figure 4. Example of simple select query of data on Kafka. Note: All variable names, schema, values, and other details used in this article are only created for use as examples.
Flink has a planned roadmap to create a unified streaming language for both stream processing and data analytics. In line with the roadmap, we have based our Zeppelin solution on supporting Structured Query Language (“SQL”) as the query language of choice as seen in Figure 4 above. Data End Users can now write queries in SQL, which is a language that they are comfortable with, and perform adequate data exploration.
As discussed in this section, data exploration on streaming data at the Kafka stage by adopting the right tool enables Data End Users to seamlessly have visibility to quickly understand the current schema of a Kafka topic (explained more in the next section. This kind of data exploration also enables Data End Users to understand the type of data the Kafka topic represents, such as the ability to determine if a country code data field is in alpha-2 or alpha-3 format while the data is still part of streaming data. This might seem inconsequential and immediately identifiable even in Offline Data, but by enabling data exploration at an earlier stage in the data journey for Online Data, Data End Users have the opportunity to react much more quickly. For example, a change of expected country code format from the data producer would usually lead to errors in the downstream joins or other stream processing pipelines due to incompatible parsing or filtering of the modified country codes. Instead of waiting for the data to be ingested to Offline Data, users can investigate the issue with Online Data retrieved from Kafka.
Figure 5. Simple visualisation of queried data on Zeppelin’s notebook environment. Note: All variable names, schema, values, and other details used in this article are only created for use as examples.
Besides query features, Zeppelin notebook provides simple visualisation and analytics of the off-the-shelf data as presented above in Figure 5. Furthermore, users are now able to perform interactive ad hoc queries on Online Data. These queries will eventually become much more advanced and/or effective SQL queries to be deployed as a streaming pipeline later on in the data journey. This reduces the inertia in setting up a separate development environment or learning other programming languages like Java or Scala during the development of streaming pipelines. With Zeppelin’s notebook environment, our Data End Users are more empowered to quickly derive value from Online Data.
Need for a more dynamic table schema derivation process
For the Data End Users performing data exploration on Online Data, we see a need for these users to derive the Data Definition Language (“DDL”) associated with a Kafka stream at an earlier stage of the data journey. Within Grab, even though Kafka streams are transmitted in Protobuf format and are thus structured, both the schema and the corresponding DDL changes are added over time as new fields. Typically, the data producer (service owners) and the data engineers responsible for the data ingestion pipeline coordinate to perform such updates. Since the Data End Users are not involved in such schema update processes nor do they directly interact with the data producers, many of them find the discovery of changes in the current Kafka stream schema an issue. Granted that this is an issue our metadata platform is actively solving using Datahub, we hope to also solve the challenge by being able to derive the DDL more dynamically within the tooling, for data exploration on Online Data to reduce friction.
Figure 6. Common functions to derive DDL of a Kafka Stream in SQL. Note: All variable names, schema, values, and other details used in this article are only created for use as examples.
As seen from Figure 6 above, we have an integrated tooling for Data End Users to derive the DDL associated with a Kafka stream using SQL language. A Kafka stream in Grab’s context is a logical concept describing a Kafka topic, associating it with its metadata like Kafka bootstrap servers and associated Java class created by Protoc. This tool maps the Protobuf schema definition of a Kafka stream to a DDL, allowing it to be expressed and used in SQL language. This reduces the manual effort involved in creating these table definitions from scratch based on the associated Protobuf schema. Users can now derive the DDL associated with a Kafka stream more easily.
Mitigating risks arising from data exploration on Online Data – data access authorisation/audit
While we rethink stream processing and are open to options that enable data exploration on Online Data as mentioned above, we realised that new security requirements related to data access authorisation and maintaining proper audit trail have emerged. Even with Personally Identifiable Information (PII) obfuscation enforcement by our streaming pipeline, it means we need to implement stricter guardrails in place along with audit trails to ensure users only have access to what they are allowed to, and this access can be removed in a break-glass scenario. If you are interested, you may check out our previous blog post titled PII masking for privacy-grade machine learning for more details about how we enforce PII masking on machine learning data streaming pipelines.
To enable data access authorisation, we utilised Strimzi, the operator of running Kafka on Kubernetes. We integrated Strimzi’s Open Policy Agent (OPA) with Kafka to define policies that authorise specific read-only user access to specific Kafka Topics. The identification of users is done via mutualTLS (mTLS) connection with our Kafka clusters, where their user details are part of the SSL certificate details used for authentication.
With these tools in place, each user’s request to explore Online Data would be properly logged, and each data access can be controlled by an OPA policy managed by a central team.
If you are interested, you may check out our previous post Zero trust with Kafka where we discussed our efforts to continue strengthening the security of our data-streaming platform.
Impact
With the proliferation of our data-streaming platform, we expect to see improvements in the way our data becomes gradually democratised. We have already been receiving use cases from the Data End Users who are interested in validating a chain of events on Online Data, i.e. retrieving information of all events associated with a particular booking, which is not currently something that can be done easily.
More importantly, the tools in place for data exploration on Online Data form the foundation required for us to embark on our next step of the stream processing journey. This foundation makes the development and validation of the stream processing logic much quicker. This occurs when ad hoc queries in a notebook environment are possible, removing the need for local developer environment setups and the need to go through the whole pipeline deployment process for eventual validation of the developed logic. We believe that this would prove to reduce our lead time in creating stream processing pipelines significantly.
What’s next?
Our next step is to rethink further how our stream processing pipelines are defined and start to provision SQL as the unified streaming language of our pipelines. This helps facilitate better discussion between upstream data producers, data engineers, and Data End Users, since SQL is the common language among these stakeholders.
We will also explore handling schema discovery in a more controlled manner by utilising a Hive catalogue to store our Kafka table definitions. This removes the need for users to retrieve and run the table DDL statement for every session, making the data exploration experience even more seamless.
Grab is the leading superapp platform in Southeast Asia, providing everyday services that matter to consumers. More than just a ride-hailing and food delivery app, Grab offers a wide range of on-demand services in the region, including mobility, food, package and grocery delivery services, mobile payments, and financial services across 428 cities in eight countries.
Powered by technology and driven by heart, our mission is to drive Southeast Asia forward by creating economic empowerment for everyone. If this mission speaks to you, join our team today!
Building confidence in new code before deploying is a crucial part of any good development loop. This is especially challenging when working in a distributed or microservice system with multiple teams operating on different services. This modular team structure gives rise to an important question: how can we provide teams with fast and reliable development cycles when testing and shipping requires them to test inside an ecosystem of other services? Optimizing the solution to this problem greatly improves engineering efficiency and can contribute to more successful outcomes for the organization as a whole.
This problem is one the Developer Experience (DX) team at GitHub grappled with again and again, ultimately delivering a solution we call “Hubber Codespace” (HCS). HCS is a tool that Hubbers (people who work at GitHub) can use to locally stand up the entire distributed GitHub ecosystem in any environment by simply querying an endpoint or adding a couple lines of configuration to their development containers.
In this post, we’ll tell you how we landed on the HCS solution to this common problem over some possible alternatives, and you’ll get a first-hand look at how GitHub’s developer-first mindset helped us deliver the best tool for Hubbers to ship code quickly and safely in our own distributed environment.
One big (un)-happy environment
To understand the problem we were trying to solve, we have to go back in time. There was a point at which GitHub was just a couple teams and a much simpler product. Back then, having a monorepo in which everyone iterated and built confidence in their changes made sense. Splitting responsibilities up across repositories would have added overhead that bogged down early Hubbers. Fast forward to today, and GitHub has grown into a big organization with hundreds of different teams. Now, the balancing act of evaluating between velocity vs. complexity can look very different.
Let’s consider these complexities a bit further. Different services can have entirely different sets of dependencies and even have dependencies on different versions of the same software (for example, one service requires Ruby 2.2 while another requires Ruby 2.4). In smaller collaborative settings, the engineers can easily reconcile these needs. But this complexity grows exponentially as more teams are introduced. Trying to provide a single environment in which these kinds of disparate services can run and interact in development becomes difficult to do. It can result in ad-hoc “hacks” in development loops like deleting a .ruby-version file depending on which service’s development loop you’re working through. These are the kinds of problems that you encounter when trying to work with a monorepo that contains the codebases for a set of disparate services.
So, we decided to design a new solution. Instead of bringing the developers to the ecosystem, what if we brought the ecosystem to the developers?
Enter HCS
This line of thinking led us to build HCS, a Docker-Compose project that does exactly that. In the post “How we build containerized services at GitHub using GitHub,” we detailed how we build containerized services that power microservices on the GitHub.com platform and many internal tools. Our task now was to take these containers and wire them up such that partner teams could spin up a full GitHub ecosystem on demand. This would allow them to test their changes in an integrated environment. Developers could see how their code behaves when introduced to GitHub’s distributed system, rather than only observing it in the isolated environment of the application being developed before deploying within the full system. In this way, developers could gain confidence that the services they were changing behaved correctly when interacting with their up and downstream dependencies.
When considering how to orchestrate all the required containers, a few solutions came to mind: Docker-Compose, an internal tool called Codespace-Compose that allows us to SSH tunnel between multiple codespaces, and Minikube. Any of these three solutions could solve the ecosystem problem and would have unique tradeoffs. Let’s look at some of those tradeoffs now.
Minikube offers a robust Kubernetes architecture, but we had concerns about the overall user experience. We ultimately decided against it as the issues we identified, such as networking complexity and long cycle times, could bog down development speed.
Codespace-Compose allows us to easily connect teams’ everyday development environments, but we reasoned that, since Codespace-Compose is an internal experiment without any SLA, we’d incur a maintenance cost on our own team by adopting this.
Docker-Compose seemed to fit our needs the best. It didn’t incur any additional maintenance burden since it’s publicly available and actively managed. It offers all the same benefits of Minikube without the long cycle time. Most importantly, using Docker in Docker in a codespace, which allows us to create docker containers on a host which is a docker container itself, is a well-paved path that has lots of prior art. Given all these considerations, we decided on orchestrating our containers using Docker-Compose.
After deciding on Docker-Compose as our orchestrator, the next steps were to figure out the interface. Docker-Compose already supplies end users with commands, but we wanted to optimize the UX around HCS. To do this, we built a user-friendly CLI in Golang with parallel versioning to HCS. This abstracted away all the complexity of using the two together. Simply download a specific release version for HCS, get the same version of the CLI binary, and you’re good to go!
CLI and release automation
Ensuring HCS is useful means ensuring a couple of things. One important goal is ease of use. Docker-Compose already offers an interface for end users, but considering some of the built in commands are long and use predictable options, we decided to wrap it in a custom Golang CLI. This abstracted many of the underlying details away, such as static file locations, formatting options, entrypoint commands, etc. to improve end-user experience. The code below shows this by juxtaposing the Docker-Compose commands with their equivalent HCS CLI command.
The following example compares the commands to start up the integrated environment provided by HCS.
This next example compares how to get a shell to run commands from inside the various containers in GitHub’s distributed ecosystem. This allows developers to modularly interact with and make ephemeral changes to the system.
# Run command from inside a container in the system using Docker-Compose

docker compose --project-name hcs exec bash

# Run from inside a container using CLI

hcs shell
This example compares how to check the status of the containers in the project so end-users can easily see the health of the entire system.
# Status using Docker-Compose

docker compose --project-name hcs ps --format json

# Status using CLI

hcs status
In addition to this easy-to-use and ergonomic CLI, we had to ensure that HCS runs an up-to-date version of the GitHub ecosystem. GitHub is made up of so many different moving pieces that testing new changes on code that’s even a couple days old would not be sufficient to build confidence. When iterating directly on the monorepo, this was a non-issue since folks just fetched the main branch. For HCS, this required us to build automation that cuts releases on a frequent cron schedule. A release of HCS is a software artifact containing the compiled Golang binary for HCS and its CLI that can be pulled using the gh CLI.
The diagram below illustrates how this process works.
End-user experience
Using HCS directly in your codespace
We’ve recently made efforts to push all development at GitHub onto GitHub Codespaces. A codespace is a custom development container, or devcontainer, based on a configuration file in a repository. A repository can have multiple codespaces associated with it as long as each has a unique configuration file. On top of the obvious benefits of having a reproducible environment on demand to develop and iterate in, devcontainers offer features. This abstraction allows developers to easily add software to their environments. HCS is also consumable this way. The code block below shows the couple lines needed to bring this entire ecosystem to a partner team’s preferred environment (that is, their codespace).
{
…
  "features": {
    …
    "ghcr.io/devcontainers/features/github-cli:1": {
      "version": "latest"
    },
    //docker-in-docker required for hcs
    "ghcr.io/devcontainers/features/docker-in-docker:2": {},
    // Include the hubber-codespace feature
    "ghcr.io/github/hubber-codespace/hcs:1": {},
    "ghcr.io/devcontainers/features/go:1": {}
    …
  }
}
Now, teams can perform integration testing against the many other services in GitHub’s ecosystem from directly in the codespace where they were doing local development.
Release binary
Even with the push towards codespaces, not every context that requires an ecosystem will be a devcontainer. In light of this, we also gave end users the option to download the release directly from the GitHub API. The commands to do so can be seen below. With a couple simple commands, Hubbers now have everything they need to bring the entire GitHub ecosystem to whatever environment they want.
But don’t just take my word for it. Check out what our partner teams have had to say about HCS improving their development loop:
“HCS has improved our dev loop for [our service] by making it simple to test [it] against [the rest of GitHub’s ecosystem]. It’s turned what used to be a number of manual steps to clone our repository into the [monorepo environment] into two simple commands in our own codespace. This has made it much easier to validate our changes without having to deploy to a staging environment.”
“Given that we are a service operating outside GitHub but with a heavy reliance on the services running within GitHub, we’ve had to go through a lot of bells and whistles to ensure we can have a smooth development experience. In my four years working on [our service], HCS has been the most seamless experience in going from a blank devbox to breakpointing live running code for our service.”
Conclusion
Solving the ecosystem problem is always a balancing act. Luckily, thanks to GitHub’s push towards containerization, and tooling such as repository automation and publishing/consuming releases through the GitHub CLI, we were adequately equipped to develop a solution with HCS. Hubbers can now leverage a development loop that allows them to deploy with confidence, having tested their changes within GitHub’s complex multi-service system.
By continuing to use the site, you agree to the use of cookies. more information
The cookie settings on this website are set to "allow cookies" to give you the best browsing experience possible. If you continue to use this website without changing your cookie settings or you click "Accept" below then you are consenting to this.
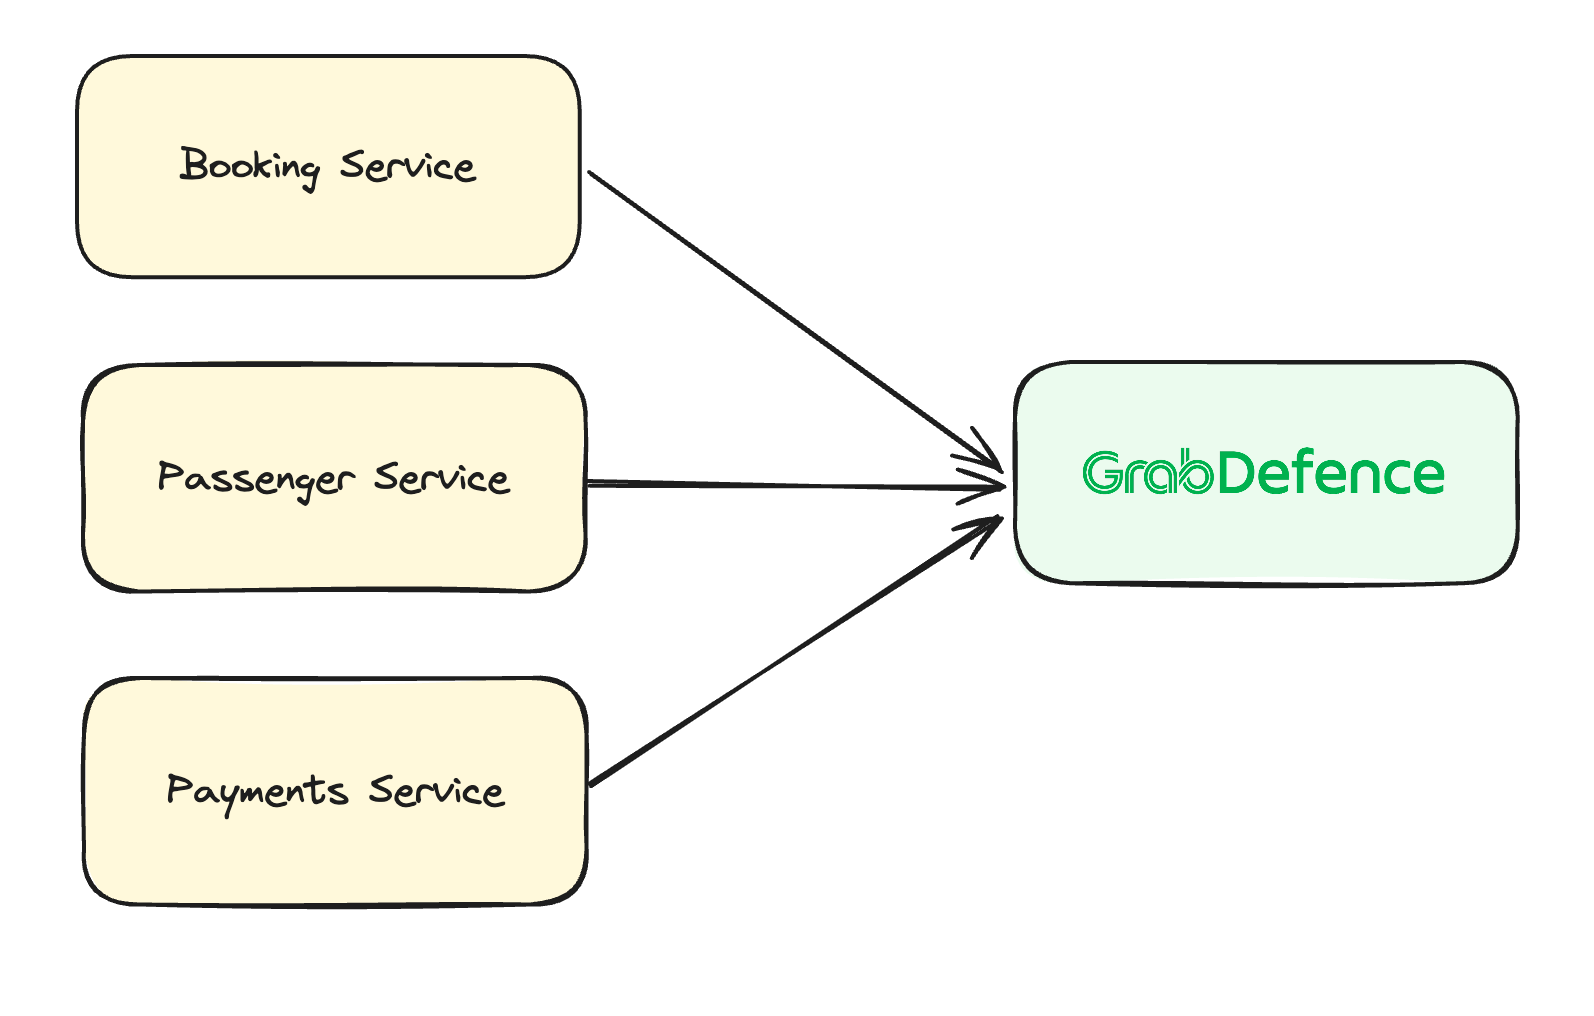
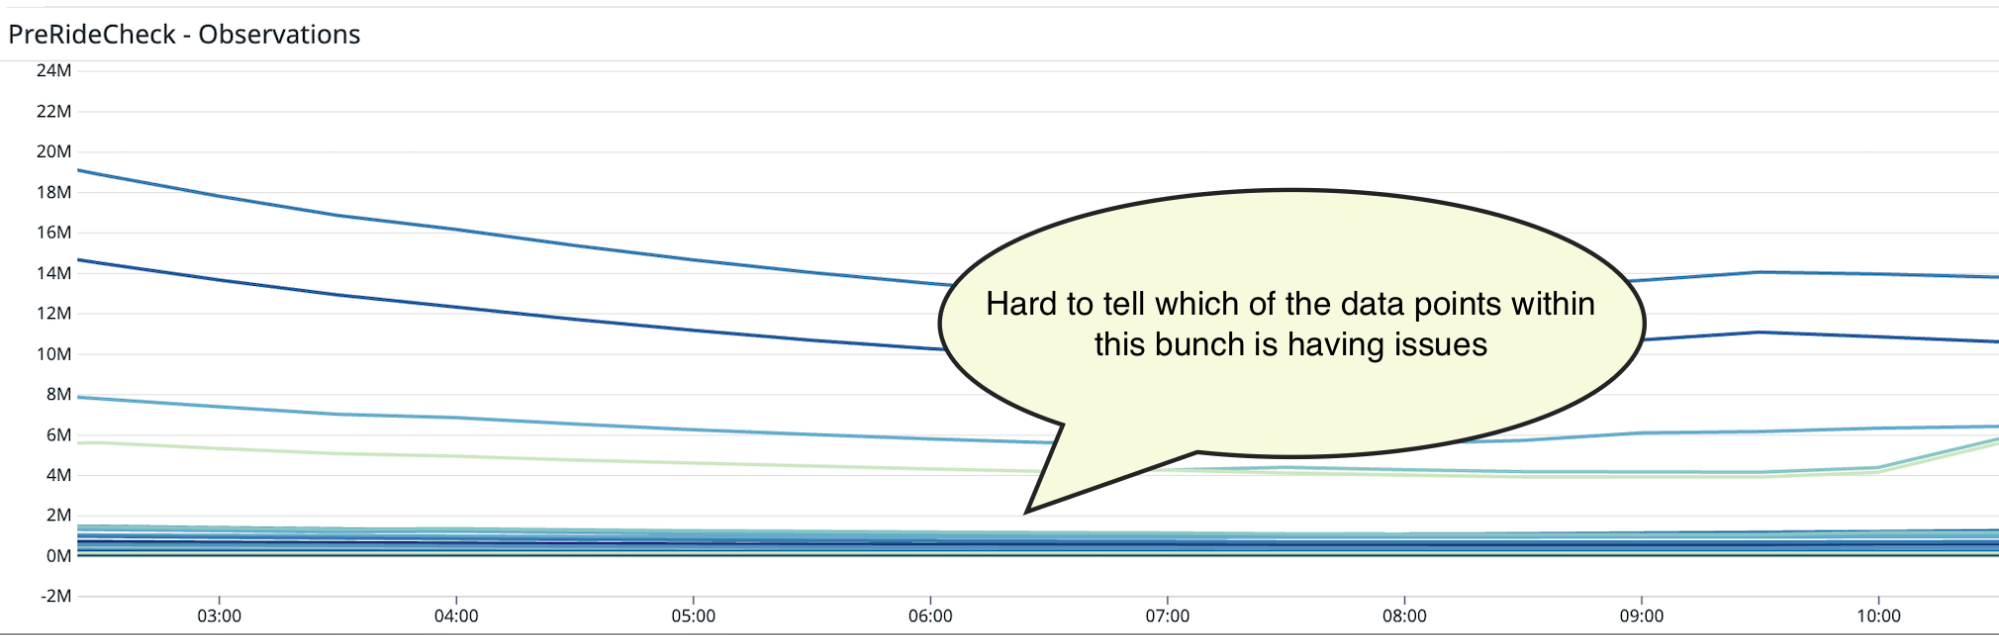
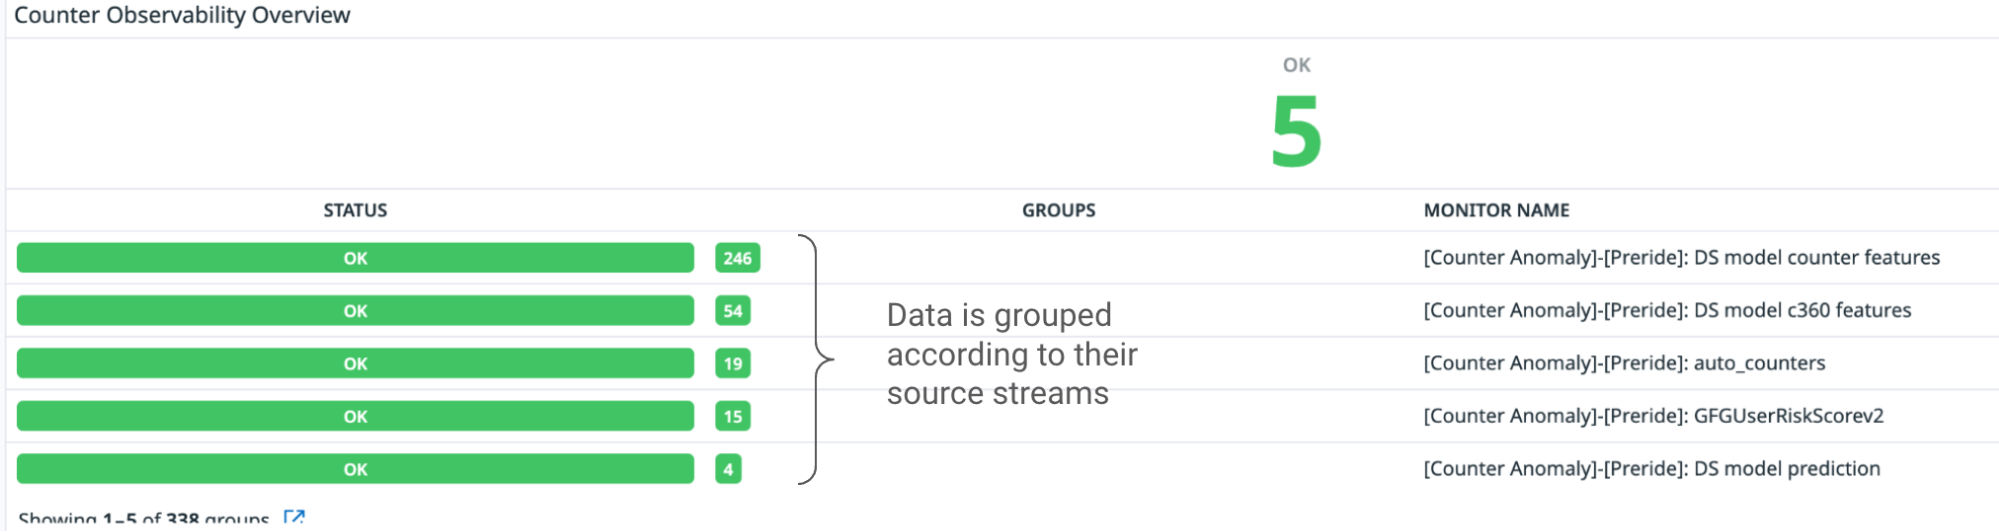
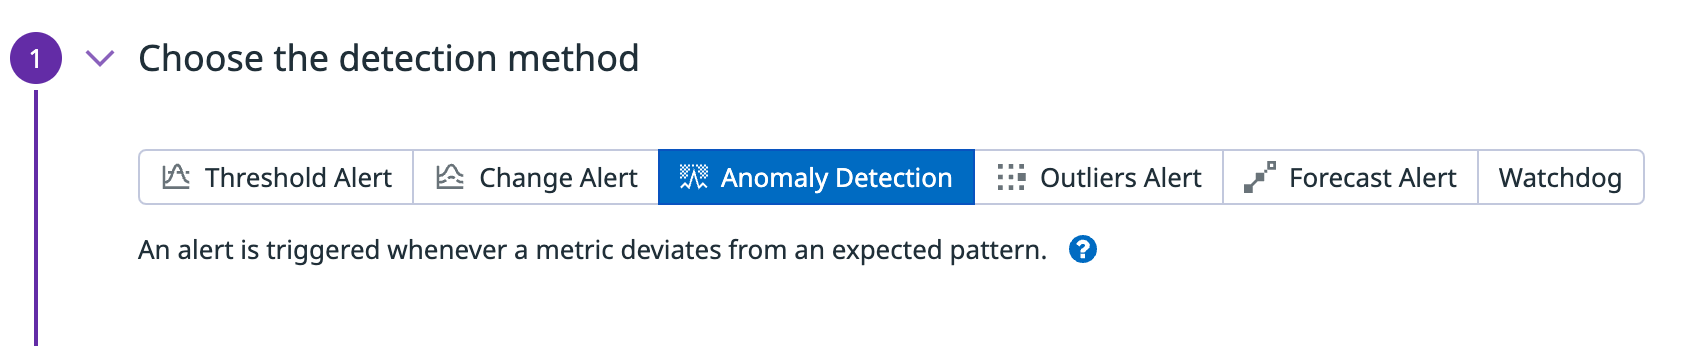
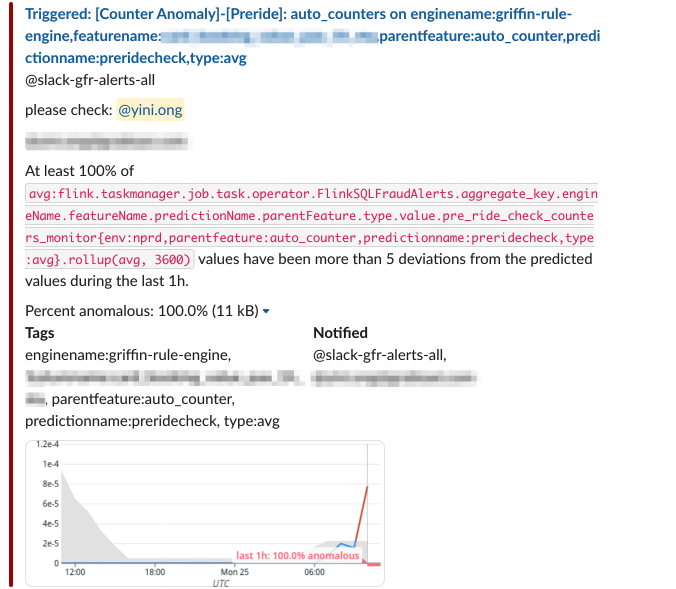


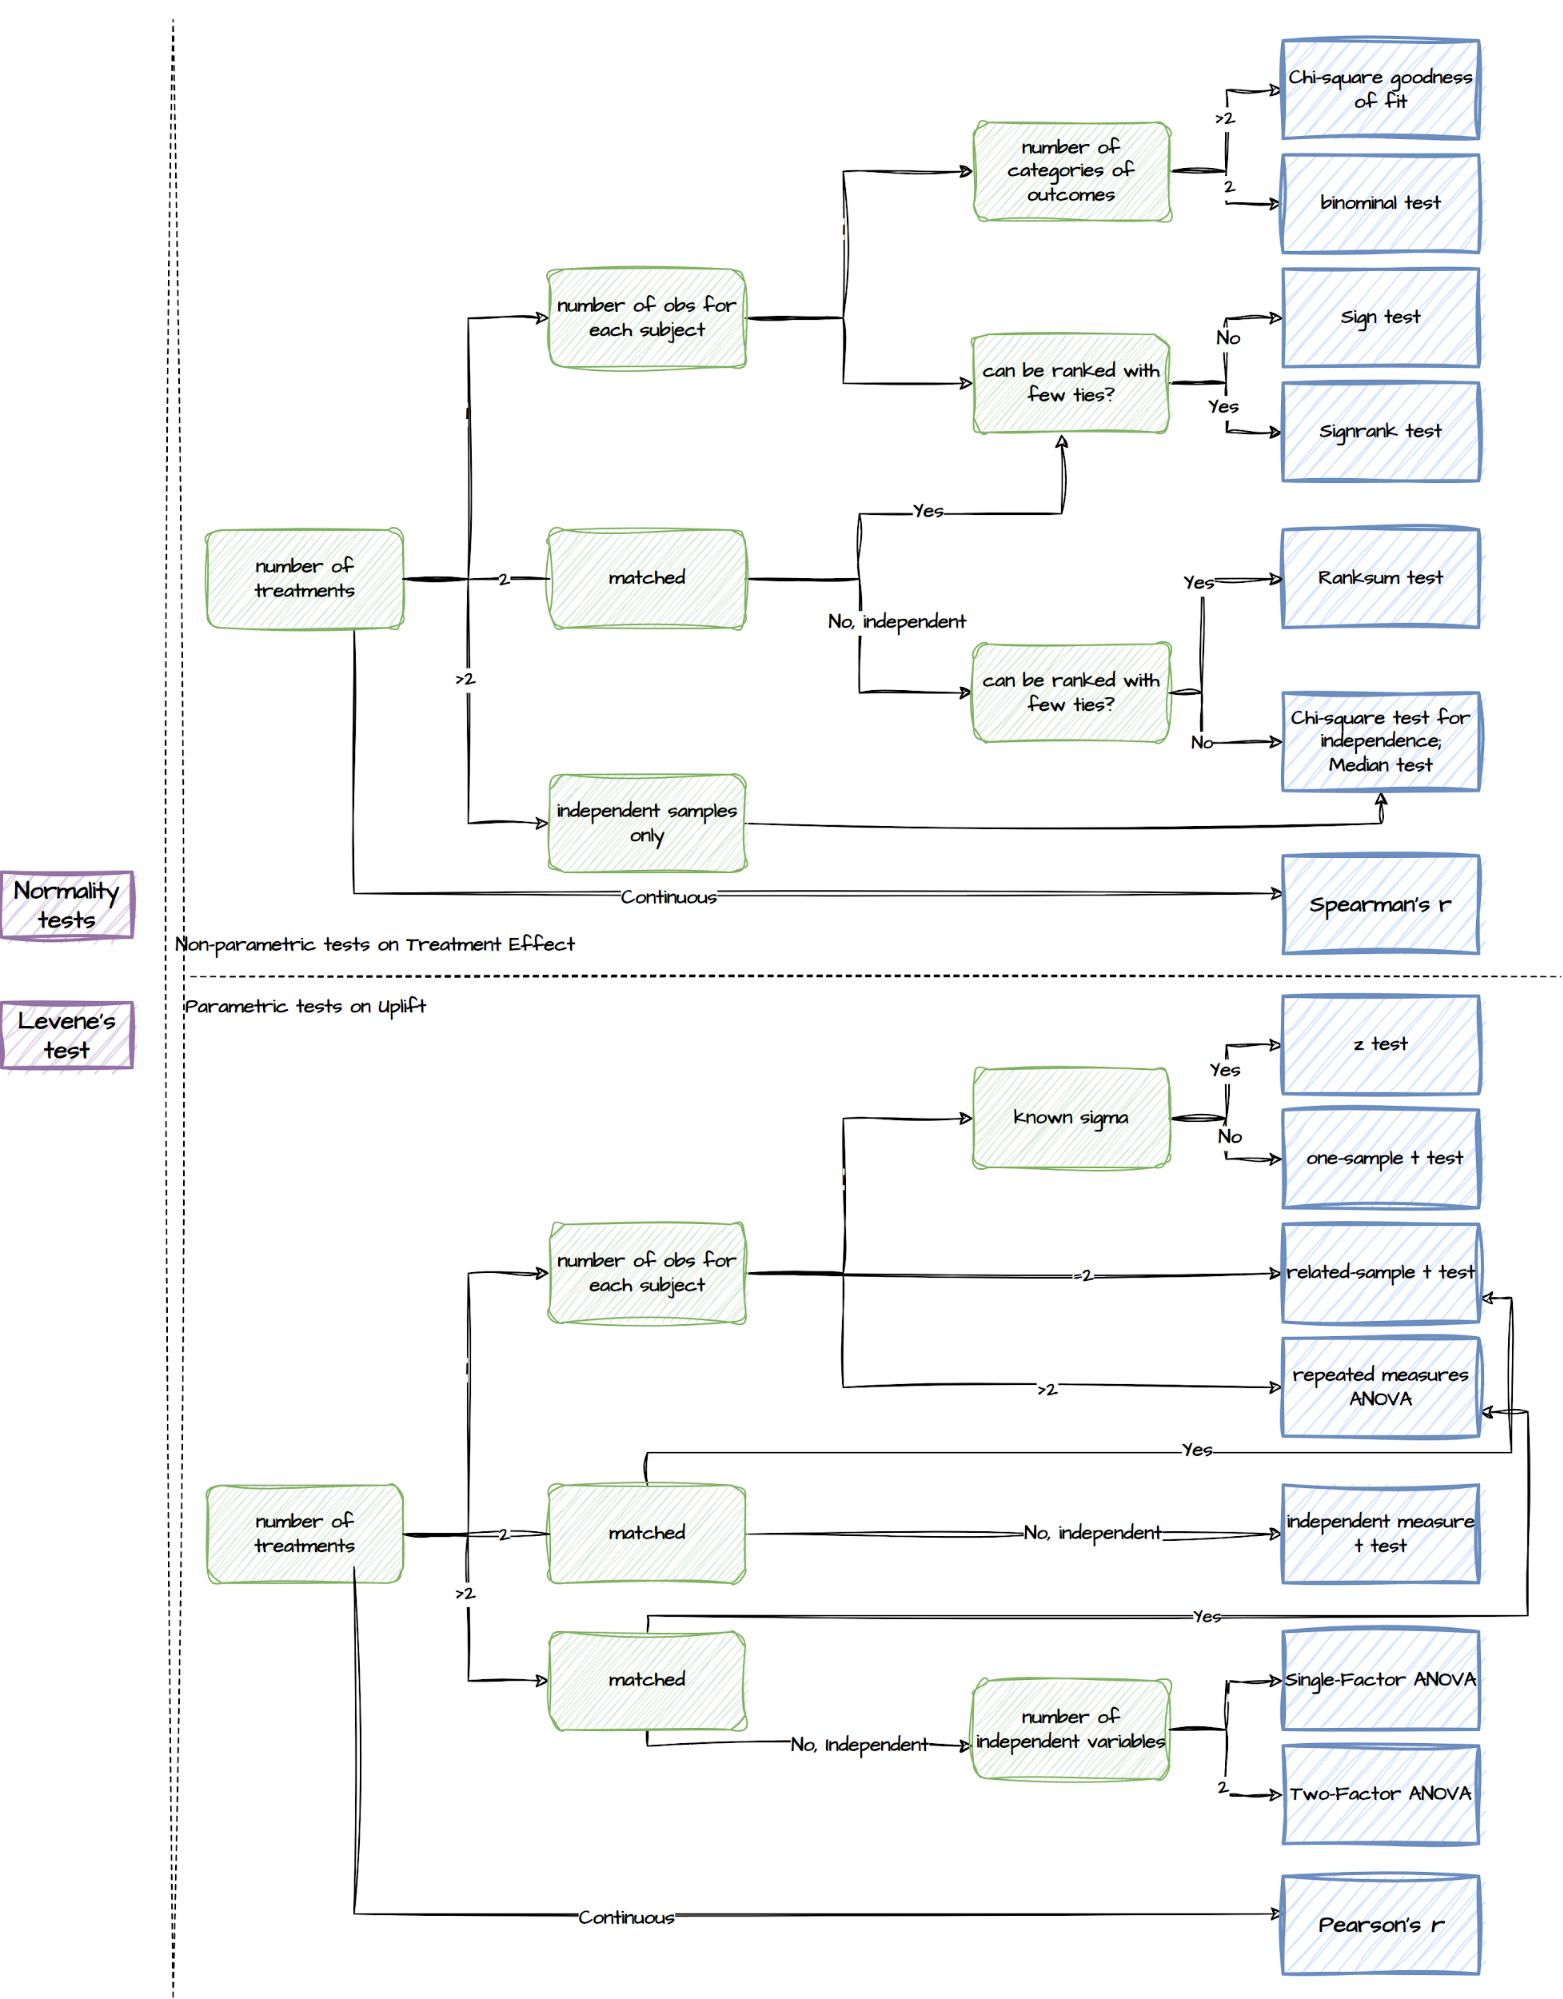
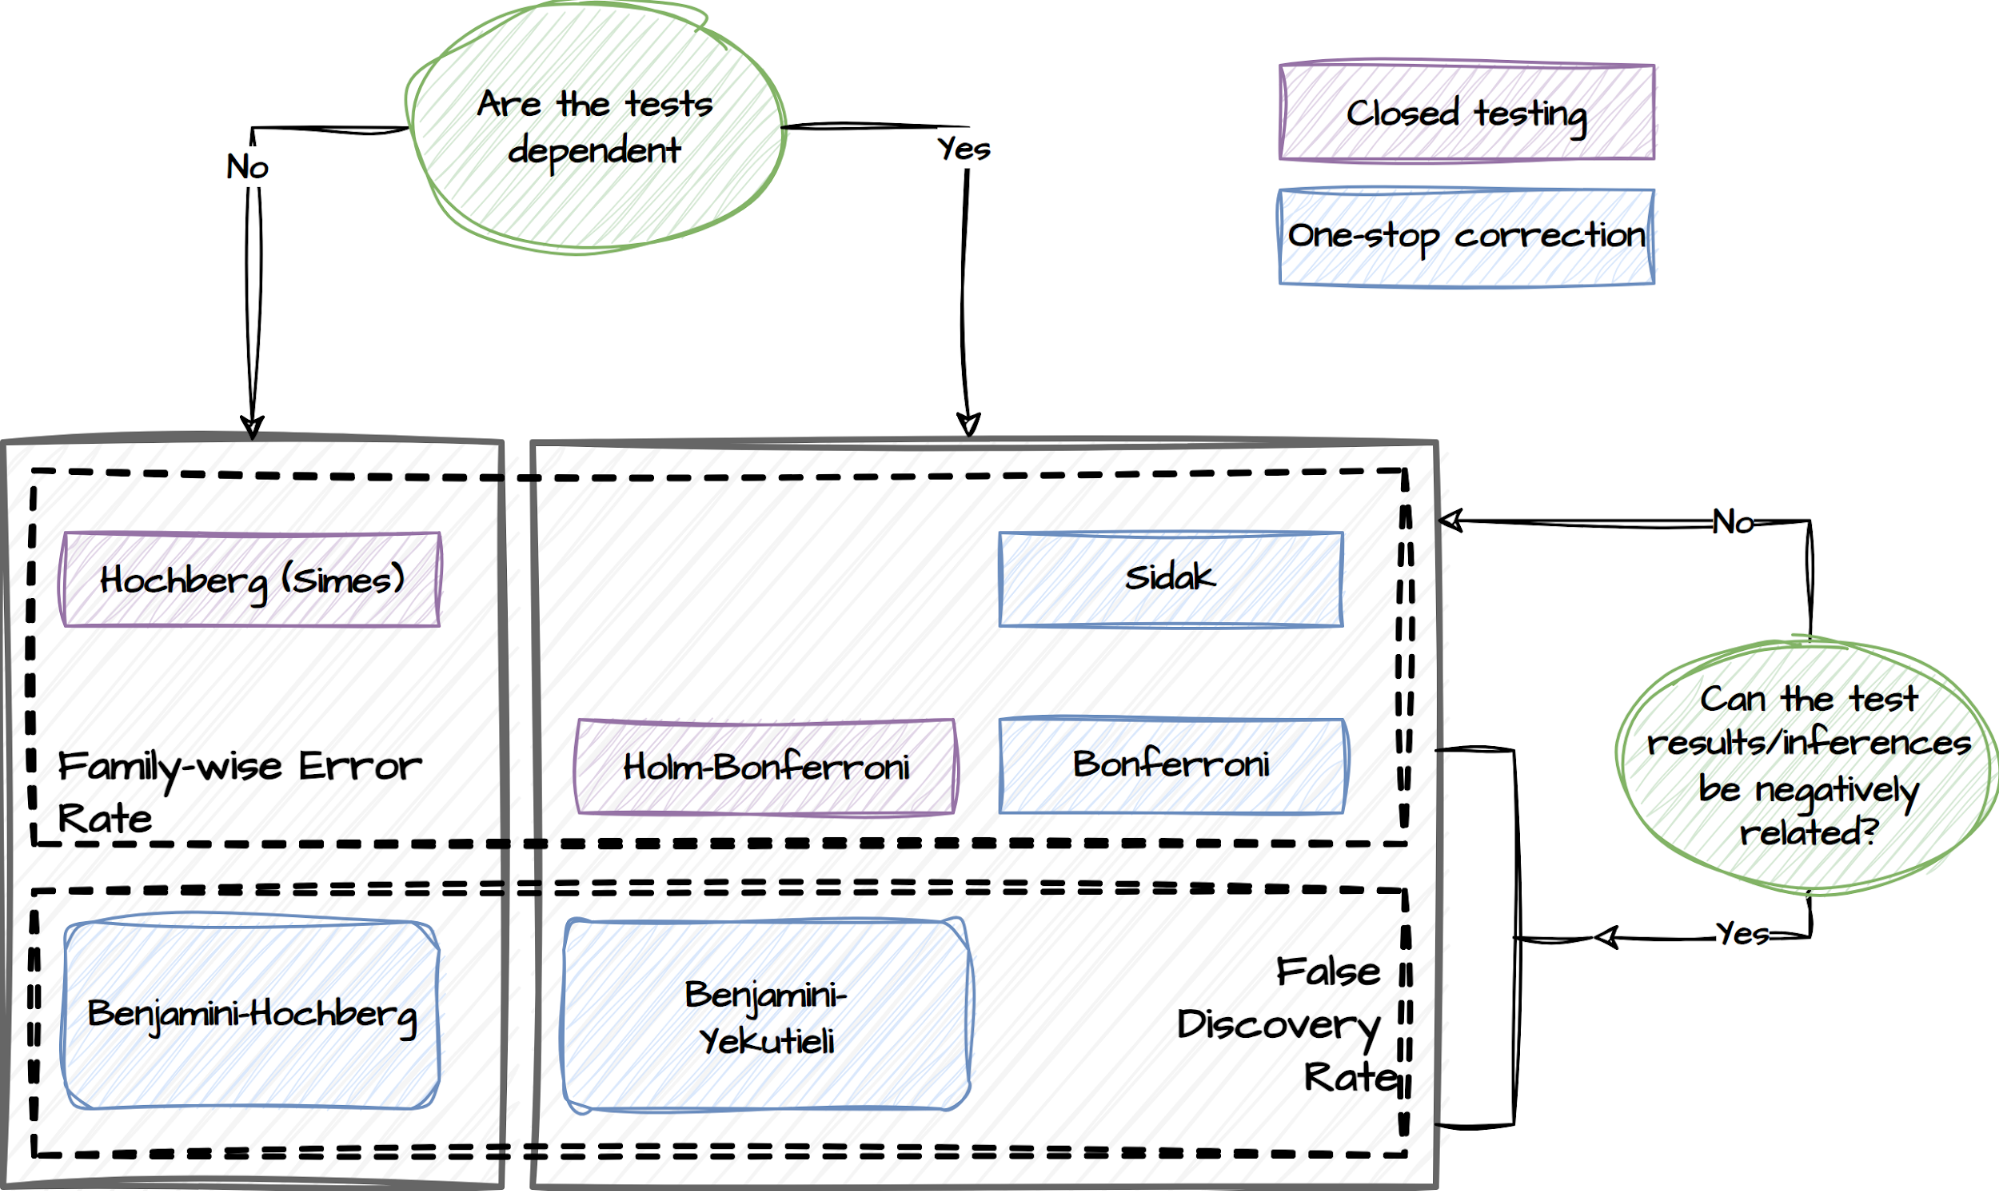
 ) of generative AI: