Tag Archives: throttling

How to monitor and query IAM resources at scale – Part 2

Post Syndicated from Michael Chan original https://aws.amazon.com/blogs/security/how-to-monitor-and-query-iam-resources-at-scale-part-2/

In this post, we continue with our recommendations for using AWS Identity and Access Management (IAM) APIs. In part 1 of this two-part series, we described how you could create IAM resources and use them soon after for authorization decisions. We also described options for monitoring and responding to IAM resource changes for entire accounts. Now, in part 2 of this post, we’ll cover the API throttling behavior of IAM and AWS Security Token Service (AWS STS) and how you can effectively plan your usage of these APIs. We’ll also cover the features of IAM that enable you to right-size the permissions granted to principals in your organization and assess external access to your resources.

Increase your usage of IAM APIs

If you’re a developer or a security engineer, you might find yourself writing more and more automation that interacts with IAM APIs. Other engineers, teams, or applications might also call the IAM APIs within the same account or cross-account. Over time, anyone calling the APIs in your account incrementally increases the number of requests per second. If so, IAM might send a “Rate exceeded” error that indicates you have exceeded a certain threshold of API calls per second. This is called API throttling.

Understand IAM API throttling

API throttling occurs when you exceed the call rate limits for an API. AWS uses API throttling to limit requests to a service. Like many AWS services, IAM limits API requests to maintain the performance of the service, and to ensure fair usage across customers. IAM and AWS STS independently implement a token bucket algorithm for throttling, in which a bucket of virtual tokens is refilled every second. Each token represents a non-throttled API call that you can make. The number of tokens that a bucket holds and the refill rate depends on the API. For each IAM API, a number of token buckets might apply.

We refer to this simply as rate-limiting criteria. Essentially, there are several rate-limiting criteria that are considered when evaluating whether a customer is generating more traffic than the service allows. The following are some examples of these criteria:

  • The account where the API is called
  • The account for read or write APIs (depending on whether the API is a read or write operation)
  • The account from which AssumeRole was called prior to the API call (for example, third-party cross-account calls)
  • The account from which AssumeRole was called prior to the API call for read APIs
  • The API and organization where the API is called

Understand STS API throttling

Although IAM has criteria pertaining to the account from which AssumeRole was called, IAM has its own API rate limits that are distinct from AWS STS. Therefore, the preceding criteria are IAM-specific and are separate from the throttling that can occur if you call STS APIs. IAM is also a global service, and the limits are not Region-aware. In contrast, while STS has a single global endpoint, every Region has its own STS endpoint with its own limits.

The STS rate-limiting criteria pertain to each account and endpoint for API calls. For example, if you call the AssumeRole API against the sts.ap-northeast-1.amazonaws.com endpoint, STS will evaluate the rate-limiting criteria associated with that account and the ap-northeast-1 endpoint. Other STS API requests that you perform under the same account and endpoint will also count towards these criteria. However, if you make a request from the same account to a different regional endpoint or the global endpoint, that request will count against different criteria.

Note: AWS recommends that you use the STS regional endpoints instead of the STS global endpoint. Regional endpoints have several benefits, including redundancy and reduced latency. To learn more about other benefits, see Managing AWS STS in an AWS Region.

How multiple criteria affect throttling

The preceding examples show the different ways that IAM and STS can independently limit requests. Limits might be applied at the account level and across read or write APIs. More than one rate-limiting criterion is typically associated with an API call, with each request counted against each rate-limiting criterion independently. This means that if the requests-per-second exceeds the applicable criteria, then API throttling occurs and returns a rate-limiting error.

How to address IAM and STS API throttling

In this section, we’ll walk you through some strategies to reduce IAM and STS API throttling.

Query for top callers

With AWS CloudTrail Lake, your organization can aggregate, store, and query events recorded by CloudTrail for auditing, security investigation, and operational troubleshooting. To monitor API throttling, you can run a simple query that identifies the top callers of IAM and STS.

For example, you can make a SQL-based query in the CloudTrail console to identify the top callers of IAM, as shown in Figure 1. This query includes the API count, API event name, and more that are made to IAM (shown under eventSource). In this example, the top result is a call to GetServiceLastAccessedDetails, which occurred 163 times. The result includes the account ID and principal ID that made those requests.
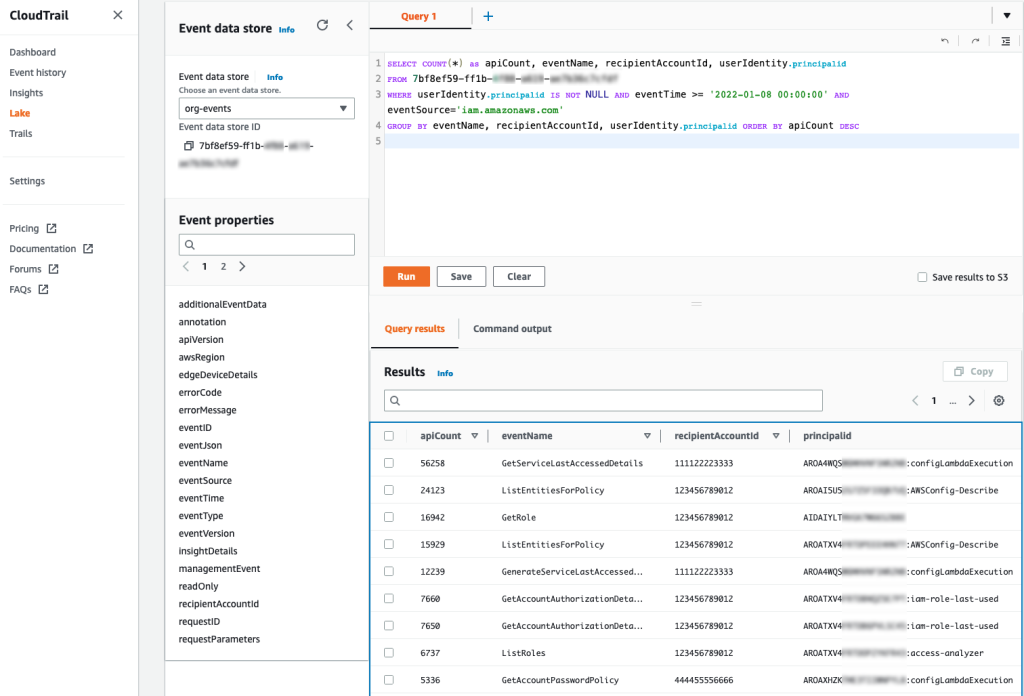
Figure 1: Example AWS CloudTrail Lake query

Figure 1: Example AWS CloudTrail Lake query

You can enable AWS CloudTrail Lake for all accounts in your organization. For more information, see Announcing AWS CloudTrail Lake – a managed audit and security Lake. For sample queries, including top IAM actions by principal, see cloud-trail-lake-query-samples in our aws-samples GitHub repository.

Know when you exceed API call rate limits

To reduce call throttling, you need to know when you exceed a rate limit. You can identify when you are being throttled by catching the RateLimitExceeded exception in your API calls. Or, you can send your application logs to Amazon CloudWatch Logs and then configure a metric filter to record each time that throttling occurs, for later analysis or notification. Ideally, you should do this across your applications, and log this information centrally so that you can investigate whether calls from a specific account (such as your central monitoring account) are affecting API availability across your other accounts by exceeding a rate-limiting criterion in those accounts.

Call your APIs with a less aggressive retry strategy

In the AWS SDKs, you can use the existing retry library and provide a custom base for the initial sleep done between API calls. For example, you can set a custom configuration for the backoff or edit the defaults directly. The default SDK_DEFAULT_THROTTLED_BASE_DELAY is 500 milliseconds (ms) in the relevant Java SDK file, but if you’re experiencing throttling consistently, we recommend a minimum 1000 ms for the throttled base delay. You can change this value or implement a custom configuration through the PredefinedBackoffStrategies.SDKDefaultBackoffStrategy() class, which is referenced in the same file. As another example, in the Javascript SDK, you can edit the base retry of the retryDelayOptions configuration in the AWS.Config class, as described in the documentation.

The difference between making these changes and using the SDK defaults is that the custom base provides a less aggressive retry. You shouldn’t retry multiple requests that are throttled during the same one-second window. If the API has other applicable rate-limiting criteria, you can potentially exceed those limits as well, preventing other calls in your account from performing requests. Lastly, be careful that you don’t implement your own retry or backoff logic on top of the SDK retry or backoff logic because this could make throttling worse — instead, you should override the SDK defaults.

Reduce the number of requests by using max items

For some APIs, you can increase the number of items returned by a single API call. Consider the example of the GetServiceLastAccessedDetails API. This API returns a lot of data, but the results are truncated by default to 100 items, ordered alphabetically by the service namespace. If the number of items returned is greater than 100, then the results are paginated, and you need to make multiple requests to retrieve the paginated results individually. But if you increase the value of the MaxItems parameter, you can decrease the number of requests that you need to make to obtain paginated results.

AWS has hundreds of services, so you should set the value of the MaxItems parameter no higher than your application can handle (the response size could be large). At the time of our testing, the results were no longer truncated when this value was 300. For this particular API, IAM might return fewer results, even when more results are available. This means that your code still needs to check whether the results are paginated and make an additional request if paginated results are available.

Consistent use of the MaxItems parameter across AWS APIs can help reduce your total number of API requests. The MaxItems parameter is also available through the GetOrganizationsAccessReport operation, which defaults to 100 items but offers a maximum of 1000 items, with the same caveat that fewer results might be returned, so check for paginated results.

Smooth your high burst traffic

In the table from part 1 of this post, we stated that you should evaluate IAM resources every 24 hours. However, if you use a simple script to perform this check, you could initiate a throttling event. Consider the following fictional example:

As a member of ExampleCorp’s Security team, you are working on a task to evaluate the company’s IAM resources through some custom evaluation scripts. The scripts run in a central security account. ExampleCorp has 1000 accounts. You write automation that assumes a role in every account to run the GetAccountAuthorizationDetails API call. Everything works fine during development on a few accounts, but you later build a dashboard to graph the data. To get the results faster for the dashboard, you update your code to run concurrently every hour. But after this change, you notice that many requests result in the throttling error “Rate exceeded.” Other security teams see “Rate exceeded” errors in their application logs, too.

Can you guess what happened? When you tried to make the requests faster, you used concurrency to make the requests run in parallel. By initiating this large number of requests simultaneously, you exceeded the rate-limiting criteria for the security account from which the sts:AssumeRole action was called prior to the GetAccountAuthorizationDetails API call.

To address scenarios like this, we recommend that you set your own client-side limitations when you need to make a large number of API requests. You can spread these calls out so that they happen sequentially and avoid large spikes. For example, if you run checks every 24 hours, make sure that the calls don’t happen at exactly midnight. Figure 2 shows two different ways to distribute API volume over time:

Figure 2: Call volume that periodically spikes compared to evenly-distributed call volume

Figure 2: Call volume that periodically spikes compared to evenly-distributed call volume

The graph on the left represents a large, recurring API call volume, with calls occurring at roughly the same time each day—such as 1000 requests at midnight every 24 hours. However, if you intend to make these 1000 requests consistently every 24 hours, you can spread them out over the 24-hour period. This means that you could make about 41 requests every hour, so that 41 accounts are queried at 00:00 UTC, another 41 the next hour, and so on. By using this strategy, you can make these requests blend into your other traffic, as shown in the graph on the right, rather than create large spikes. In summary, your automation scheduler should avoid large spikes and distribute API requests evenly over the 24-hour period. Using queues such as those provided by Amazon Simple Queue Service (Amazon SQS) can also help, and when errors are identified, you can put them in a dead letter queue to try again later.

Some IAM APIs have rate-limiting criteria for API requests made from the account from which the AssumeRole was called prior to the call. We recommend that you serially iterate over the accounts in your organization to avoid throttling. To continue with our example, you should iterate the 41 accounts one-by-one each hour, rather than running 41 calls at once, to reduce spikes in your request rates.

Recommendations specific to STS

You can adjust how you use AWS STS to reduce your number of API calls. When you write code that calls the AssumeRole API, you can reuse the returned credentials for future requests because the credentials might still be valid. Imagine that you have an event-driven application running in a central account that assumes a role in a target account and does an API call for each event that occurs in that account. You should consider reusing the credentials returned by the AssumeRole call for each subsequent call in the target account, especially if calls in the central accounts are being throttled. You can do this for AssumeRole calls because there is no service-side limit to the number of credentials that you can create and use. Whether it’s one credential or many, you need to use and store these carefully. You can also adjust the role session duration, which determines how long the role’s credentials are valid. This value can be up to 12 hours, depending on the maximum session duration configured on the role. If you reuse short-term credentials or adjust the session duration, make sure that you evaluate these changes from a security perspective as you optimize your use of STS to reduce API call volume.

Use case #3: Pare down permissions for least-privileged access

Let’s assume that you want to evaluate your organization’s IAM resources with some custom evaluation scripts. AWS has native functionality that can reduce your need for a custom solution. Let’s take a look at some of these that can help you accomplish these goals.

Identify unintended external sharing

To identify whether resources in your accounts, such as IAM roles and S3 buckets, have been shared with external entities, you can use IAM Access Analyzer instead of writing your own checks. With IAM Access Analyzer, you can identify whether resources are accessible outside your account or even your entire organization. Not only can you identify these resources on-demand, but IAM Access Analyzer proactively re-analyzes resources when their policies change, and reports new findings. This can help you feel confident that you will be notified of new external sharing of supported resources, so that you can act quickly to investigate. For more details, see the IAM Access Analyzer user guide.

Right-size permissions

You can also use IAM Access Analyzer to help right-size the permissions policies for key roles in your accounts. IAM Access Analyzer has a policy generation feature that allows you to generate a policy by analyzing your CloudTrail logs to identify actions used from over 140 services. You can compare this generated policy with the existing policy to see if permissions are unused, and if so, remove them.

You can perform policy generation through the API or the IAM console. For example, you can use the console to navigate to the role that you want to analyze, and then choose Generate policy to start analyzing the actions used over a specified period. Actions that are missing from the generated policy are permissions that can be potentially removed from the existing policy, after you confirm your changes with those who administer the IAM role. To learn more about generating policies based on CloudTrail activity, see IAM Access Analyzer makes it easier to implement least privilege permissions by generating IAM policies based on access activity.

Conclusion

In this two-part series, you learned more about how to use IAM so that you can test and query IAM more efficiently. In this post, you learned about the rate-limiting criteria for IAM and STS, to help you address API throttling when increasing your usage of these services. You also learned how IAM Access Analyzer helps you identify unintended resource sharing while also generating policies that serve as a baseline for principals in your account. In part 1, you learned how to quickly create IAM resources and use them when refining permissions. You also learned how to get information about IAM resources and respond to IAM changes through the various services integrated with IAM. Lastly, when calling IAM directly, you learned about bulk APIs, which help you efficiently retrieve the state of your principals and policies. We hope these posts give you valuable insights about IAM to help you better monitor, review, and secure access to your AWS cloud environment!

If you have feedback about this post, submit comments in the Comments section below. If you have questions about this post, start a new thread on the Security, Identity, & Compliance re:Post or contact AWS Support.

Want more AWS Security news? Follow us on Twitter.

Michael Chan

Michael Chan

Michael is a Senior Solutions Architect for AWS Identity who has advised financial services and global customers of AWS. He enjoys understanding customer problems with identity and access management and helping them solve their security issues at scale.

Author photo

Joshua Du Lac

Josh is a Senior Manager of Security Solutions Architects at AWS. Based out of Texas, he has advised dozens of enterprise, global, and financial services customers to accelerate their journey to the cloud while improving their security along the way. Outside of work, Josh enjoys searching for the best tacos in Texas and practicing his handstands.

How to monitor and query IAM resources at scale – Part 1

Post Syndicated from Michael Chan original https://aws.amazon.com/blogs/security/how-to-monitor-and-query-iam-resources-at-scale-part-1/

In this two-part blog post, we’ll provide recommendations for using AWS Identity and Access Management (IAM) APIs, and we’ll share useful details on how IAM works so that you can use it more effectively. For example, you might be creating new IAM resources such as roles and policies through automation and notice a delay for resource propagations. Or you might be building a custom cloud security monitoring solution that uses IAM APIs to evaluate the security and compliance of your AWS accounts, and you want to know how to do that without exceeding limits. Although these are just a few example use cases, the insights described in this post are intended to help you avoid anti-patterns when building scalable cloud services that use IAM APIs.

In this post, we describe how to create IAM resources and use them soon after for authorization decisions. We also describe options for monitoring and responding to IAM resource changes for entire accounts. In part 2, we’ll cover the API throttling behavior of IAM and AWS Security Token Service (AWS STS) and how you can effectively plan your usage of these APIs. Let’s dive in!

Use case 1: Create IAM resources and attempt to use them immediately

If you’re a cloud developer, you create and use IAM resources when you develop applications on AWS. For your application to interact with AWS services, you need to grant IAM permissions to your application. Your application—whether it runs on AWS Lambda, Amazon Elastic Compute Cloud (Amazon EC2), or another service—will need an associated IAM role and policy that provide the necessary permissions.

Imagine that you want to create least privilege policies for your application. You begin by deploying new or updated IAM resources, such as roles and policies, along with your application updates, and you automate this process to speed up testing and development.

During development, you begin removing unnecessary policy permissions, with your automation testing the updated permissions. However, you notice that some of your updates do not immediately take effect. The following sections address why this occurs and provide insights to help you architect for other scenarios.

Understand the IAM control plane and data plane

Let’s first learn more about the control plane and data plane in IAM. The control plane involves operations to create, read, update, and delete IAM resources, and it’s how you get the current state of IAM. When you invoke IAM APIs, you interact with the control plane. This includes any API that falls under the iam:* namespace. The data plane, in contrast, consists of the authorization system that is used at scale to grant access to the broader set of AWS services and resources. This includes the AWS STS APIs, which have their own sts:* namespace.

When you call the IAM control plane APIs to create, update, or delete resources, you can expect a read-after-write consistent response. This means that you can retrieve (read) the resource and its latest updates immediately after it’s written. In contrast, the IAM data plane, where authorizations occur, is eventually consistent. This means that there will be a delay for IAM resource changes, such as updates to roles and policies, to propagate and reflect in the authorizations that follow. The delay can be several seconds or longer. Because of this, you need to allow for propagation time when you test changes to IAM resources. To learn more about the control plane and data plane of IAM, see Resilience in AWS Identity and Access Management.

Note: Because calls to AWS APIs rely on IAM to check permissions, the availability and scalability of the data plane are paramount. In 2011, the “can the caller do this?” function handled a couple of thousand requests per second. Today, as new services continue to launch and the number of AWS customers increases, AWS Identity handles over half a billion API calls per second worldwide, and the number is growing. Eventually consistent design enables the IAM data plane to maintain the high availability and low latency needed to evaluate permissions on AWS.

This is why when architecting your application, we recommend that you don’t depend on control plane actions such as resource updates for critical parts of your application’s workflow. Instead, you should architect to take advantage of the data plane, which includes STS and the authorization system of IAM. In the next section, we describe how you can do this.

Test permissions with STS scope-down policies

IAM role sessions have a feature called a session policy, which takes effect immediately when a role is assumed. This is an optional policy that you can provide to scope down the role’s existing identity policies, with the permissions being the intersection of the role’s identity-based policies and the session policy. By using session policies, you get specific, scoped-down credentials from a single pre-existing role without having to create new roles or identity policies for each particular session’s use case. You can use session policies for your application or when you test which least privilege policies are best for your application.

Let’s walk through an example of when to use session policies for permissions testing. Imagine that you need permissions that require very specific, fine-grained conditions to attain your ideal least privilege policy. You might iterate on the policy several times, making updates and testing the changes over and over again. If you update a policy attached to a role, you need to wait for these changes to propagate to the IAM data plane. But if you instead specify a scope-down policy when assuming the pre-existing role prior to testing, you can immediately test and observe the effects of your permissions changes. Immediate testing is possible because your role and its original policy have already propagated to the data plane, enabling you to iterate over various scoped-down session policies that operate against the IAM data plane.

Use STS session policies to assume a role with the AWS CLI

There are two ways to provide a session policy during the AssumeRole process: you can provide an inline policy document or the Amazon Resource Names (ARNs) of managed session policies. The following example shows how to do this through the AWS Command Line Interface (AWS CLI), by passing in a policy document along with the AssumeRole call. If you use this example policy, make sure to replace <123456789012> and <DOC-EXAMPLE-BUCKET> with your own information.

$ aws sts assume-role \
 --role-arn arn:aws:iam::<123456789012>:role/s3-full-access
 --role-session-name getobject-only-exco
 --policy '{ "Version": "2012-10-17", "Statement": [ { "Action": [ "s3:GetObject" ], "Effect": "Allow", "Resource": "arn:aws:s3::: <DOC-EXAMPLE-BUCKET>/*" } ] }'

In this example, we provide a previously created role ARN named s3-full-access, which provides full access to Amazon Simple Storage Service (Amazon S3). We can further restrict the role’s permissions by supplying a policy with the optional --policy option. The inline policy document only allows the GetObject request against the S3 bucket named <DOC-EXAMPLE-BUCKET>. The effective permissions for the returned session are the intersection of the role’s identity-based policies and our provided session policy. Therefore, the role session’s permissions are limited to only performing the GetObject request against the <DOC-EXAMPLE-BUCKET>.

Note: The combined size of the passed inline policy document and all passed managed policy ARN characters cannot exceed 2,048 characters. You can reduce the size of the JSON policy document by removing unnecessary whitespace and shortening or removing tags associated with your session.

To learn more about session permissions, see Create fine-grained session permissions using IAM managed policies. In part two of this post, we will describe how you can use role sessions when you need to provide credentials at a high rate.

Use case 2: Monitor and respond to IAM resources for entire accounts

You might need to periodically audit the state of your IAM resources, such as roles and policies, including whether these IAM resources have changed, in a single account or across your entire organization. For example, you might want to check whether roles have overly broad access to actions and resources. Or you might want to monitor IAM resource creation and updates to respond to security-relevant permission changes. In this section, you will learn how to choose the right tool for auditing and monitoring IAM resources across accounts. You will learn about the AWS services that support this use case, the benefits of polling compared to event-based architectures, and powerful APIs that aggregate common information.

Respond to configuration changes with an event-driven approach

Sometimes you might need to perform actions relatively quickly based on IAM changes. For example, you might need to check if a trust policy for a newly created or updated role allows cross-account access. In cases like this, you can use AWS Config rules, AWS CloudTrail, or Amazon EventBridge to detect state changes and perform actions based on these state changes. You can use AWS Config rules to evaluate whether a resource complies with the conditions that you specify. If it doesn’t comply, you can provide a workflow to remediate the non-compliance. With CloudTrail, you can monitor your account’s API calls, and log API calls for your accounts with AWS Organizations integration. EventBridge works closely with CloudTrail and helps you create rules that match incoming events and send them to targets, such as Lambda, where your code can perform analysis or automated remediation. You can even filter out events from your accounts and send them to a central account’s event bus for processing. For an example of how to use EventBridge with IAM Access Analyzer to remediate cross-account access in a role’s trust policy, see Automate resolution for IAM Access Analyzer cross-account access findings on IAM roles. Which feature you choose depends on whether you need to monitor one account or all accounts in your organization, as well as which solution you are more comfortable building with.

One caveat to an event-driven approach is that if many events occur over a short period and your application responds to each event with an IAM API call of its own, you could eventually be throttled by IAM. To address this, you can queue up your responding API calls, distribute them over a longer period, or aggregate them to reduce API call volume. For example, if some of your calls are write APIs (such as UpdateAssumeRolePolicy or CreatePolicyVersion) or read APIs (such as GetRole or GetRolePolicy), you can call them serially with a delay between calls. If you need the latest status on a large number of principals and policies, you can call IAM bulk APIs such as GetAccountAuthorizationDetails, which will return data to you for principals and policies and their relationships in your organization. This approach helps you avoid throttling and querying the IAM control plane with unnecessary and redundant API calls. You will learn more about throttling and how to address it in part two of this post.

Retrieve point-in-time resource information with AWS Config

AWS Config helps you assess, audit, and evaluate the configuration of your AWS resources. It also offers multi-account, multi-Region data aggregation and is integrated with AWS Organizations. With AWS Config, you can create rules that detect and respond to changes. AWS Config also keeps an inventory of AWS resource configurations that you can query through its API, so that you don’t need to make direct API calls to each resource’s service. AWS Config also offers the ability to return the status of resources from multiple accounts and AWS Regions. As shown in Figure 1, you can use the AWS Config console to run a simple SQL-like statement for details on the IAM roles in your entire organization.

Figure 1: Run a query on IAM roles in AWS Config

Figure 1: Run a query on IAM roles in AWS Config

The preceding results also show associated resources, such as the inline and attached policies for the IAM roles. Alternatively, you can obtain these results from the SDK or CLI. The following query that uses the CLI is equivalent to the preceding query that uses the console. If you use this query, make sure to replace DOC-EXAMPLE-CONFIG-AGGREGATOR> with your AWS Config aggregator.

aws configservice select-aggregate-resource-config
--configuration-aggregator-name <DOC-EXAMPLE-CONFIG-AGGREGATOR>
--expression "SELECT accountId, resourceId, resourceName, resourceType, tags, configuration.attachedManagedPolicies, configuration.rolePolicyList WHERE resourceType = 'AWS::IAM::Role'"

Here is the response (note that we’ve adjusted the formatting to make it more readable):

{
  "accountId": "123456789012",
  "resourceId": "AROAI3X5HCEQIIEXAMPLE",
  "configuration": { 
    "attachedManagedPolicies": [
      {     
        "policyArn": "arn:aws:iam::aws:policy/service-role/AWSLambdaBasicExecutionRole",
        "policyName": "AWSLambdaBasicExecutionRole"
      },    
      {     
        "policyArn": "arn:aws:iam::123456789012:policy/mchan-test-cloudtrail-post-to-SNS",
        "policyName": "mchan-test-cloudtrail-post-to-SNS"
      }     
      ],    
    "rolePolicyList": []
  },
  "resourceName": "lambda-cloudtrail-notifications",
  "tags": [],
  "resourceType": "AWS::IAM::Role"
}

The preceding command returns the details of roles in your organization’s accounts, including the full policy document for the associated inline policy. It also returns the customer-managed policy names and their ARNs, for which you can view the policy documents and versions by using the BatchGetResourceConfig API. Note that AWS Config doesn’t provide the AWS-managed policy documents. However, these are common across accounts, and we will show you how to query that data later in this section.

To query the status of roles in your organization, you need to have AWS Config enabled in each account. You also need an aggregator to monitor your accounts with your organization’s management account or a delegated administrator account. For more details on how to set up AWS Config, see the AWS Config developer guide. After you set up AWS Config, you can periodically call the AWS Config APIs to get a snapshot of the current or prior state of your resources. Furthermore, you can periodically pull the snapshot records and evaluate this information in other tools outside of AWS Config. So before you directly use the IAM APIs to get IAM information, consider using AWS Config—this is what it’s for!

Retrieve IAM resource information directly from IAM

As previously noted, AWS Config can give you a bulk view of your AWS and IAM resources. Additionally, CloudTrail and EventBridge can detect AWS and IAM resource changes and help you act on them. If you need data from IAM beyond what these services offer, you can query the IAM APIs directly to get the latest information on your resources.

A few key APIs can help you audit IAM resources more efficiently, especially in bulk. The first is GetAccountAuthorizationDetails, which enables you to retrieve the principals in your account, their associated inline policy documents (if any), attached managed policies, and their relationships to each other. This API reduces the need to individually call ListRolePolicies and ListAttachedRolePolicies for each role in an account. GetAccountAuthorizationDetails also returns the role trust policy document for roles in the results. Finally, GetAccountAuthorizationDetails allows you to filter the result set. For example, if you don’t need information relating to groups or AWS managed policies, you can exclude these from the API response. You can do this by using the filter parameter to only include the details that you need at the time.

Another useful API is GenerateServiceLastAccessedDetails. This API gives you details about when an IAM resource (user, group, role, or policy) was last used in an attempt to access AWS services. You can use this API to identify roles that are unused and remove them if you don’t need them. IAM Access Analyzer, which you will learn about later in this post, also uses the same information.

The following table summarizes the key APIs that you can use, rather than building your own code that loops for this information individually.

Type of information API How to use the API Frequency of use
User list and user detail GetAccountAuthorizationDetails Pass User to the filter parameter When needed, per account
User’s inline policy User’s inline policy GetAccountAuthorizationDetails Pass User to the filter parameter When needed, per account
User’s attached managed policies GetAccountAuthorizationDetails Pass User to the filter parameter When needed, per account
Role list and role detail GetAccountAuthorizationDetails Pass Role to the filter parameter When needed, per account
Role trust policy GetAccountAuthorizationDetails Pass Role to the filter parameter When needed, per account
Role’s inline policy GetAccountAuthorizationDetails Pass Role to the filter parameter When needed, per account
Role’s attached managed policies GetAccountAuthorizationDetails Pass Role to the filter parameter When needed, per account
Role last used GetAccountAuthorizationDetails Pass Role to the filter parameter When needed, per account
Group list and group detail GetAccountAuthorizationDetails Pass Group to the filter parameter When needed, per account
Group’s inline policy GetAccountAuthorizationDetails Pass Group to the filter parameter When needed, per account
Group’s attached managed policies GetAccountAuthorizationDetails Pass Group to the filter parameter When needed, per account
AWS customer managed policies GetAccountAuthorizationDetails Pass LocalManagedPolicy to the filter parameter When needed, per account
AWS managed policies GetAccountAuthorizationDetails Pass LocalManagedPolicy to the filter parameter 24 hours recommended, globally (once for all accounts within an AWS partition)
Policy versions GetAccountAuthorizationDetails Pass either LocalManagedPolicy or WSManagedPolicy to the filter parameter 24 hours recommended, per account
Services access attempts by an IAM resource GetServiceLastAccessedDetails Submit a job through the GenerateServiceLastAccessedDetails API, which returns a JobId; then retrieve the results after the job completes. Spread total number of requests evenly across 24 hours
Actions access attempts by an IAM resource GetServiceLastAccessedDetails Submit a job through the GenerateServiceLastAccessedDetails API which returns a JobId; then retrieve the results after the job completes. Pass ACTION_LEVEL as the required Granularity parameter. Spread total number of requests evenly across 24 hours

Note: In the table, we suggest that you perform some of these API requests once every 24 hours as a starting point. You might prefer to perform your own analysis at a longer time interval, such as every 48 hours, but we don’t recommend requesting it more often than every 24 hours because these resources (and therefore the details in the responses) don’t change often. These APIs are suitable for periodic, point-in-time collection of information. If you need faster detection of information from GetAccountAuthorizationDetails, consider whether AWS Config rules or EventBridge will fit your needs. For GetServiceLastAccessedDetails, recent activity usually appears within four hours, so more frequent requests are unlikely to provide much value.

Use of these APIs can help you avoid writing code that loops through results to make individual read API calls for each principal, policy, and policy version in an account, which could result in tens of thousands of API requests and call throttling. Instead of iterating over each resource, you should use solutions that return bulk data, such as GetAccountAuthorizationDetails, AWS Config, or an AWS Partner Network solution. However, if you’re experiencing throttling, you will learn some practical considerations on how to handle that later in this post.

Inspect IAM resources across multiple accounts and organizations

Your use case might require that you inspect IAM resources across multiple accounts in your organization. Or perhaps you are an independent software vendor and need to build a software-as-a-service tool to evaluate IAM resources across many organizations. The following considerations can help you address use cases like these.

AWS Organizations integration

Previously, you learned of the benefits of the “service last accessed data” that the GenerateServiceLastAccessedDetails and GetServiceLastAccessedDetails APIs provide. But what if you want to pull this data for multiple accounts in your organization? IAM has bulk APIs that support querying this data across your entire organization, so you don’t need to assume a role in each account to generate the request. To generate a report for entities (organization root, organizational unit, or account) or policies in your organization, use the GenerateOrganizationsAccessReport operation, which returns a JobId that is passed as a parameter to the GetOrganizationsAccessReport operation to check if the report has been generated. When the job status is marked complete, you can retrieve the report.

AWS managed policies

Many customers use AWS managed policies because they align to common job functions. AWS creates and administers these policies, which have their own ARNs, such as arn:aws:iam::aws:policy/AWSCodeCommitPowerUser. AWS managed policies are available for every account, and they are the same for every account. AWS updates them when new services and API operations are introduced. Updated policies are recorded and visible as a new version, so you only need to query for the current AWS managed policies once per evaluation cycle, rather than once per account. Therefore, if you’re evaluating hundreds or thousands of accounts, you shouldn’t include the AWS managed policies and their policy versions in your query. Doing so would result in thousands of redundant API requests and could cause throttling. Instead, you can query the AWS managed policies once and then reuse the results across your analysis and evaluation by caching the results for a period of time (for example, every 24 hours) in your application before requesting them again to check for updates. Because AWS managed policies are available through the GetAccountAuthorizationDetails API, you don’t need to query for the AWS managed policies or their versions as a separate action.

Multi-account limits

The preceding table lists the frequency of API requests as “per account” in many places. If you’re calling IAM APIs by assuming a role in other accounts from a central account, some IAM APIs have rate-limiting criteria that apply to API requests performed from the assuming account (the central account). To query data from multiple accounts, we recommend that you serially iterate over the accounts one-by-one to avoid throttling. You’ll learn more about this strategy, as well as throttling, in part 2 of this blog post.

Conclusion

In this post, you learned about different aspects of IAM and best practices to test and query IAM efficiently. With STS session policies, you can test different policies to help achieve least privilege access. With AWS Config, EventBridge, CloudTrail, and CloudTrail Lake, you can audit your IAM resources and respond to changes while reducing the number of IAM API calls that you make. If you need to call IAM directly, you can use IAM bulk APIs for more efficient retrieval of your resource state. You can learn more about IAM and best practices in part 2 of blog post: How to monitor and query IAM resources at scale – Part 2.

If you have feedback about this post, submit comments in the Comments section below. If you have questions about this post, start a new thread on the Security, Identity, & Compliance re:Post or contact AWS Support.

Want more AWS Security news? Follow us on Twitter.
Michael Chan

Michael Chan

Michael is a Senior Solutions Architect for AWS Identity who has advised financial services and global customers of AWS. He enjoys understanding customer problems with identity and access management and helping them solve their security issues at scale.

Author photo

Joshua Du Lac

Josh is a Senior Manager of Security Solutions Architects at AWS. Based out of Texas, he has advised dozens of enterprise, global, and financial services customers to accelerate their journey to the cloud while improving their security along the way. Outside of work, Josh enjoys searching for the best tacos in Texas and practicing his handstands.

Combining preprocessing with storing only trend data for high-frequency monitoring

Post Syndicated from Arturs Lontons original https://blog.zabbix.com/combining-preprocessing-with-storing-only-trend-data-for-high-frequency-monitoring/16568/

There are many design choices to consider when we build our monitoring environment for high-frequency monitoring. How to minimize performance impact? What are the data retention policies with storage space in mind? What are the available out-of-the-box features to solve these potential problems?
In this blog post, we will discuss when you should use preprocessing and when it is better to use the “Do not keep history” option for your metrics, and what are the pros and cons for both of these approaches.

Throttling and other preprocessing steps

We’ve discussed throttling previously as the go-to approach for high-frequency monitoring. Indeed, with throttling, you can discard repeated values and do so with a heartbeat. This is extremely useful with metrics that come as discreet values – services states, network port statuses, and so on.
Example of throttling with and without heartbeat
In addition, since starting from Zabbix 4.2 all preprocessing is also performed by Zabbix proxies. This means we can discard the repeated values before they reach the Zabbix server. This can help us both with the performance (fewer metrics to insert in the Zabbix server DB) and reduce the DB size (Fewer metrics stored in the DB. This also helps with improving overall Zabbix performance)
There are a few caveats with this approach – since metrics get discarded before they reach the Zabbix server, the triggers will not react on these metrics (This is where having a heartbeat is useful) and, since trends are calculated by Zabbix server based on the received history data, there could be a lack of trend information for these metrics. Keep in mind that this applies not only to throttling preprocessing rules – any preprocessing can be done on the proxy and any preprocessing rules can be used to transform your data.

Understanding “Do not keep history” option

The behavior of “Do not keep history” which we can define when configuring an item is a bit different though. If we collect an item by a Proxy and configure the item with “Do not keep history”, the history won’t always get discarded! There are a couple of reasons for this.
  • First off, let’s not forget that some of our values can populate host inventory! If the particular item is configured to populate an inventory field – it will be forwarded to the Zabbix server, but it will not get stored in the history tables.
  • If the item does not populate an inventory field – the text data such as character, log and text will indeed get discarded before reaching the Zabbix server, but Numeric values – both float and integer, will get forwarded to the server. The reason for that is deriving trend information from the numeric values. Mind that the numeric data will still not get stored in the history tables, only trends will be available for these items.

Note: This behavior has been properly implemented starting from Zabbix 5.2. See ZBX-17548

Setting the “Do not keep history” option for an item

Using trend functions with high-frequency monitoring

With the specifics of “Do not keep history” in mind, we should now recall that starting from Zabbix 5.2 we have trend functions available at our disposal!
History functions such as trendavg, trendcount, trendmax, trendmin, trendsum allow us to perform different kinds of trend calculations – from counting the number of trend values to retrieving min/max/avg trend values for a time period.
This means, that if we require only the metric trend for specific time periods (hours, days, weeks, etc) we can use these trend functions together with “Do not keep history” option, thus discarding unnecessary data and improving our Zabbix server performance!
There are two approaches two using trend functions:
  • If you wish to collect and display the trend data, you need to create the item which will collect the metrics (say, a net.if.in Agent item for collecting incoming network traffic) and then create a separate calculated item that uses the trend function to calculate the avg/min/max value for the trend over a time period. The original item can then have “Do not keep history” option selected for it.

trendavg item for calculating hourly trends from the net.if.in[ifHCInOctets.5] item


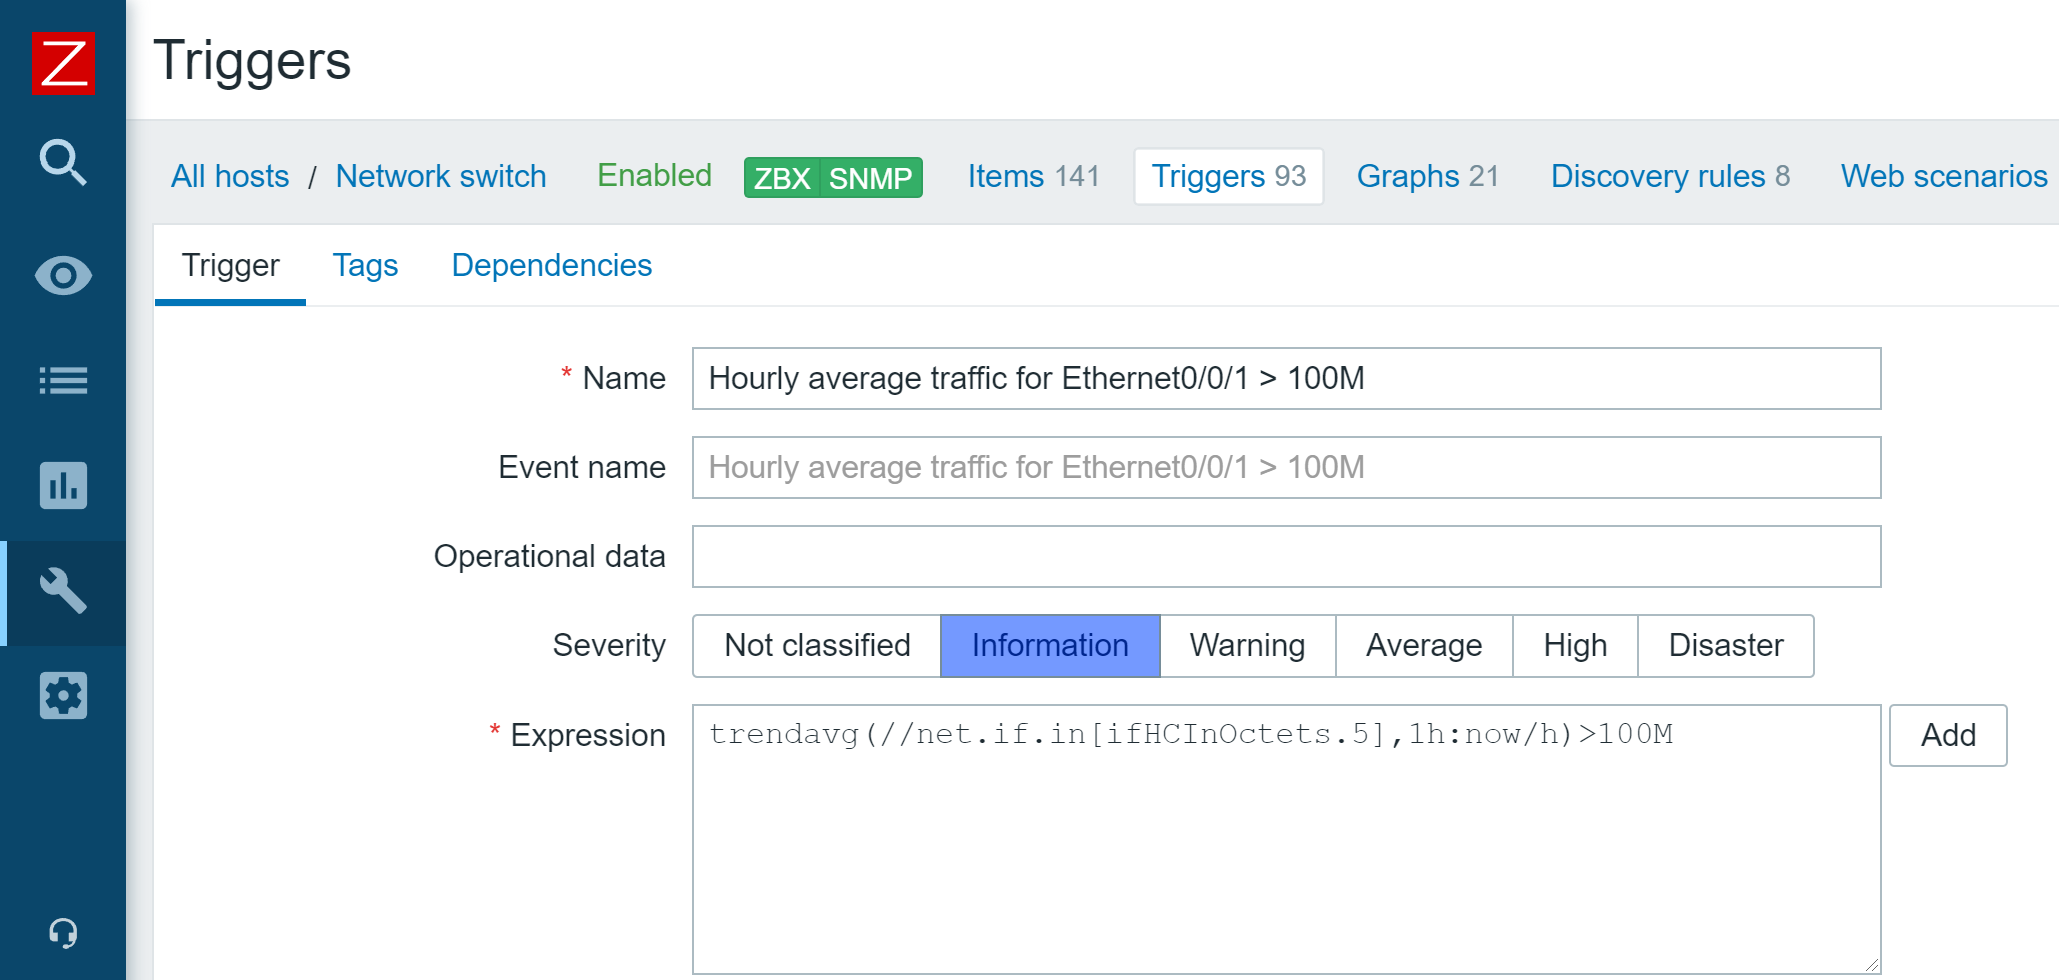
  • If you wish to simply define triggers and react on long-term trends and are not required to collect the trend values, then we can skip the creation of the calculated item and simply use the trend function on the original item in the trigger.

This trigger fires if the hourly average trend value exceeds 100M.
Note: In this case only the original item is required.

By combining these approaches in our environment – using preprocessing when we wish to discard or transform the data and also implementing opting out of storing the history data, whenever this is appropriate, we can minimize the performance impact on our Zabbix instance. Add a layer of distributed Zabbix proxies on top of this and you can truly achieve a large, scalable Zabbix infrastructure optimized for high-frequency ingestion and processing of your data.

Deploying and configuring Zabbix 5.4 in a multi-tenant environment

Post Syndicated from Arturs Lontons original https://blog.zabbix.com/deploying-and-configuring-zabbix-5-4-in-a-multi-tenant-environment/15109/

In this post and the video, we will discuss deploying and configuring Zabbix 5.4 in a multi-tenant environment and how Zabbix is finally ready for real multi-tenant use cases thanks to multiple features.

Contents

I. Monitoring requirements of multi-tenant environments (0:30)
II. Supported monitoring approaches (2:32)

III. Zabbix and multi-tenant environment (5:56)

IV. To-do list (21:36)
V. Questions & Answers (23:32)

Monitoring requirements of multi-tenant environments

Before talking Zabbix, let us first analyze the core requirements behind multi-tenant environments. Such environments can be quite complex with a particular set of prerequisites that we have to be sure we can satisfy before continuing further.

  • The core idea behind multi-tenancy is support for multiple customers. Therefore we need to support granular role/permission schema. The ability to define different roles for different customers and limit what they can access is key to success for such deployments.
  • Multiple customers means a lot of data. No matter if we’re talking about a single Zabbix instance or scaling by deploying multiple Zabbix instances (say, for different regions) we need to have the ability to process large amounts of data. 
  • On top of that, we must be able to scale upwards, ideally – both horizontally and vertically. More customers, different requirements, varying amounts of data to process – all of this needs to be accounted for in advance.
  • Redundancy is another key factor for us. As service providers, we absolutely cannot afford any downtime or data loss. While this may be acceptable in our own home labs or classrooms, this is not the case here. Unscheduled downtime could potentially result in a loss of a customer.

Supported monitoring approaches

Now that we have covered the architectural requirements, let’s focus on data collection. No matter the monitoring solution, the easiest approach in most cases would simply be to tell our customer to deploy an agent and be done with it. Unfortunately, this often doesn’t sit will with the end user and their security team. Let us also not forget that it is simply not possible to deploy an agent on some devices or environments – what then? Having a vast selection of monitoring methods is key for successful deployment of a multi-tenant monitoring service.

Let us take a look at this in the context of Zabbix.

Agent

  • With Zabbix agents we can obtain data in two ways – in passive (polling) and active modes (trapping). This is extremely useful while working with multiple customers, since each of them will have different internal network security policies. I have personally seen cases where only one of these approaches is supported, while the other is restricted by the security policies.
  • Agents also support deployment on different platforms (Windows, Unix, etc.), as well as execution of external third-party scripts either by way of User parameters or system.run item key.
  • Active agents are also capable of reading log files and event logs on Windows environments. This can be extremely useful, since many applications, even in-house ones, can provide a lot of monitoring data by logging it.

Agent-supported deployment on various platforms


Since we need to stay flexible, there are many other monitoring approaches supported by Zabbix that we can utilize:

  • SNMP, HTTP, IPMI and SSH agentless monitoring.
  • Simple checks (ICMP pings, port statuses).
  • Database and Java application monitoring.
  • External scripts (executed by the Zabbix server, Zabbix proxy or Zabbix agent).
  • Aggregations and calculations of existing data.
  • VMware monitoring and integration.
  • Web monitoring by creating web scenarios.
  • Synthetic monitoring for simulating real life user transactions.

Latest improvements

Why are we putting emphasis on multi tenancy just now? The reason is a couple of great features added in the last few releases. These features can finally allow us to utilize Zabbix in a truly multitenant environment:

Added in Zabbix 5.2:

  • Ability to create customizable user roles based on user types;
  • Secrets can now be stored in an, highly secure external vault;
  • Improvements in configuring frontend were also added. For example, each user can now select their time zone for frontend data display. This will be relevant for users in different geographical locations.

Added in Zabbix 5.4:

  • Users now have the ability to send scheduled reports. This is extremely useful for customers who may wish to receive scheduled reports about their environments. Now, instead of utilizing third-party scripts to export data and generate reports, you can use the native Zabbix functionality.
  • Major performance improvements have also been added, especially for really large instances with tens of thousands of new incoming values per second.

Zabbix and multi-tenant environment

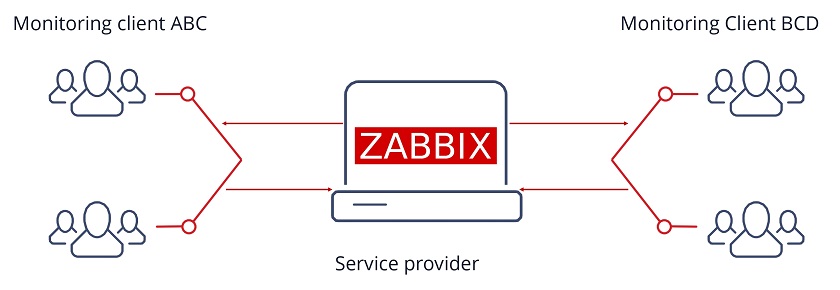
How do we use Zabbix in a multi-tenant environment? Essentially, we provide Zabbix as a service. We use the Zabbix monitoring tool to monitor our clients (ABC and BCD in the image). We monitor their network traffic, their operating system statistics, application statistics, log files, etc. For each tenant, these monitoring requirements are going to be different.

Multi-tenant environment

Zabbix proxy

Multi-tenancy would not be possible without Zabbix proxies. With Zabbix proxies we can deploy them in customer offices, data centers, organization branches and collect data locally. Since proxies also perform preprocessing, we can even utilize them to transform and normalize metrics or even discard some of the collected metrics before forwarding them to the central Zabbix backend server.

  • Proxies are capable of performing preprocessing ever since Zabbix version 5.0. This allows us to normalize and transform data, for example – change our textual data to numeric data, use throttling and other pre-processing approaches. Even custom JavaScript is supported nowadays to format or normalize the data before we send it to our central Zabbix backend server. So, instead of the server being responsible for all of the preprocessing and having quite a large preprocessing overhead, now the proxy can do it and then forward the data to the server.
  • In addition, on the proxy, the data gets compressed before forwarding to the server thus saving some network traffic overhead.
  • The proxy still continues collecting data and storing it in its own database even in case of a network outage on the customer’s site.
  • Once we collect the data by the proxy, it gets sent to the server via a single connection, which is a lot more feasible from the network security perspective. In this case we need to create only a single firewall rule as opposed to a wide array of rules if we were to monitor the customer’s site directly from the central Zabbix backend server.
  • We can execute remote scripts on the proxy.
  • We can also deploy multiple proxies to improve scalability. If a single proxy cannot handle the amount of data that we are gathering or preprocessing, we can always deploy an extra proxy. They are easy to deploy, and can even use out-of-the-box SQLite databases.

Passive and active proxies

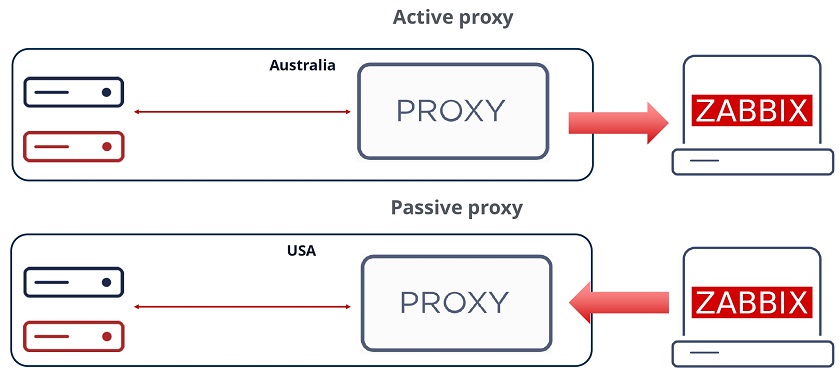
With proxies can also select the direction of the connection. We can deploy passive proxies, which get polled by the Zabbix backend server. In that case, the Zabbix server pulls the data from the proxy. In this scenario the Zabbix server is the one responsible for establishing the connection to the proxy. This adds a minor performance overhead to the Zabbix backend server. On the other hand, we can also deploy active proxies, where we remove that overhead from the server and proxy sends the data autonomously to the server.

At the end of the day, similar to how it goes with agent requirements, the proxy mode will depend on the security policies of the customer. Don’t forget that we aren’t restricted to a single type of proxy –  we can have both of these proxy types running at the same time.

Selecting the connection direction

Data preprocessing — throttling

Preprocessing can help us not only normalize our data, but we can also utilize it to save up on storage and performance overhead, which is vital in large environments.

When monitoring a service or an application state, we are going to be obtaining discrete values such as 1, 2, or 3, or any number. These numbers have a tendency to repeat – if our server stays up, we are going to continue receiving a number which represents “Up”. By using the preprocessing method called throttling, we can decrease the amount of these numbers stored by discarding repeating values. Only status changes are stored, therefore we can potentially save some database space and remove unneeded data processing overhead.

Discarding unchanged values


At this point in time, this feature sees more and more usage in many Zabbix environments, though it was severely underutilized initially when Zabbix 5.0 came out. So, if you aren’t using throttling yet and you’re running on 5.0 or newer, I definitely suggest trying to implement it to some extent. It is available in Preprocessing section of the item configuration.

Permissions

Robust permission design is essential to a multi-tenant environment. Even though permission logic has seen an addition of roles, the user group to host group relations haven’t been abandoned and still play vital role in overall permission schema.

With roles we still have to utilize the three user types – Users, Admin, and Super admins.

User role overview

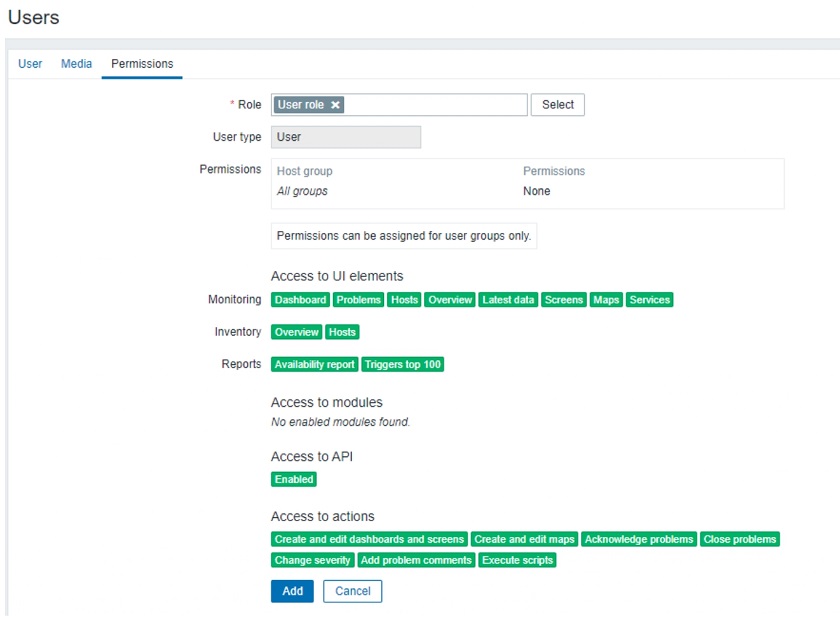
Here you can see the user role and the UI elements the user has access to together with API restrictions and the actions the user can perform.

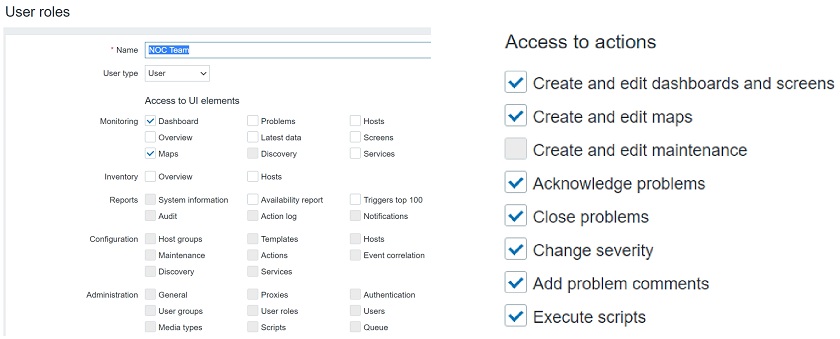
Roles grant the ability to configure access to specific UI elements, actions and restrict API calls in a granular fashion. So, when you’re configuring a role, you will see a screen similar to the one below:

Configuring user roles

User roles

Here you can select User type. The user type restrictions still apply. Users can get access only to Monitoring and Inventory, Admins can get access to except the Administration section, and Super admins can get access to every section, including Administration.

With roles we can further restrict these user types. You can have Super admins with some limitations, so that they could only do specific actions and access specific UI sections.

This option has two core benefits. The first one is security as we can limit what our customers can do and what they can access. The other benefit is in the UX, as we can simplify the UI for our users, especially people not experienced with Zabbix. We can restrict the visibility of the sections that the end users don’t have access to, so they will not be concerned with navigating through multiple sections and subsections that they are not familiar with.

User groups

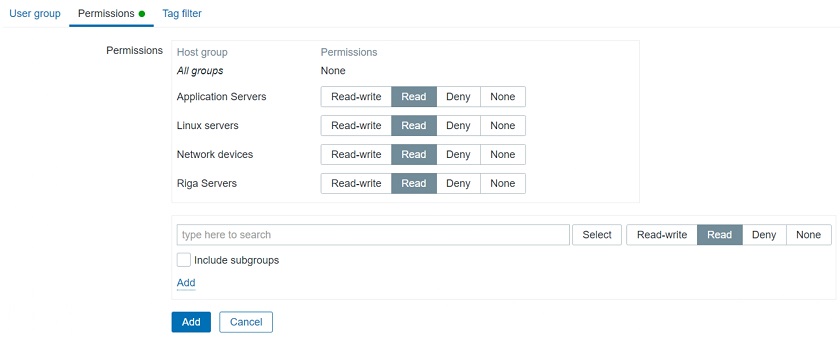
We still have user groups and user groups to host groups relations, which we have to take into consideration. Access to hosts is defined on User groups. So, we have to define our user groups and assign Full/Read only/Deny permissions on particular host groups. This is how we limit what specific customers can access.

User groups

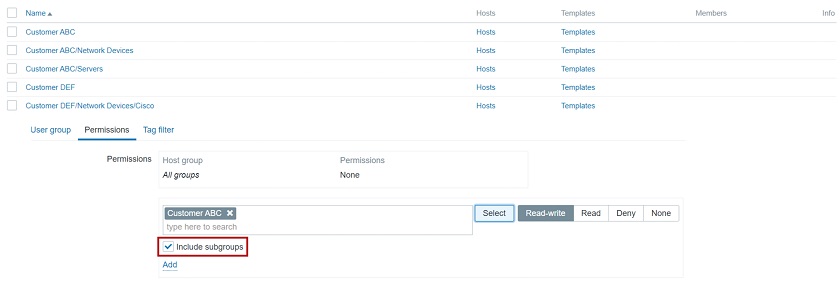
In addition, we can have host groups defined in a hierarchical manner. For instance, if you have two customers each of then having a “Network Devices” subgroup, we can select to include the root group and all of its subgroups when assigning user group to host group permissions. This is a really elegant and quick way to give a User or an Admin on the customer’s side access to all of their hosts or limit a specific organizational unit to only access what they need, e.g.: only permit access to network devices for network administrators.

Using group hierarchy

High availability

The next important decision is the HA implementation. Going without some sort of HA solution is simply too risky and therefore is not an option with such environments.

  • HA can be used to minimize downtime and add redundancy.
  • Zabbix supporst Linux HA tools – PCS, Corosync, Pacemaker, which are used to enable HA. You are also welcome to try and use other third-party tools for HA.
  • Out-of-the-box HA is planned for Zabbix 6.0.

HA setup

To achieve a quorum in our HA environment, we will require an odd number of nodes. For Zabbix backend HA it is very much recommended to have at least three nodes. Does that mean that you have to deploy 3 Zabbix servers? Not really – our third node is going to be a really small arbitration node, which is simply going to be checking connections to the two other Zabbix nodes and giving a vote to achieve quorum in case of issues with one of the nodes.

In the end we will have three nodes:  Zabbix server A, Zabbix server B, and the Arbiter node

  • An odd number of nodes is recommended to achieve quorum.
  • Only Active/Passive cluster architecture is supported.
  • We cannot have two Zabbix nodes active running at the same time and talking to the same database. It is important to use some ‘shoot the other node in the head’ mechanism — STONITH to avoid such split-brain scenarios.

Failure to abide by these requirements can result in issues with database consistency, issues with underlying queries and cleaning up or inserting data. This can cause unexpected Zabbix backend server crashes down the line.

In addition, it is very common to have a requirement for proxies to be deployed with HA. Before implementing HA for proxies, we need to decide if we really do need it. HA adds a significant configuration management overhead. We can have hundreds if not thousands of proxies, and managing HA for each of those can add a significant overhead. Of course, the more comfortable you feel with the HA tools, the easier the deployment and the management of the environment.

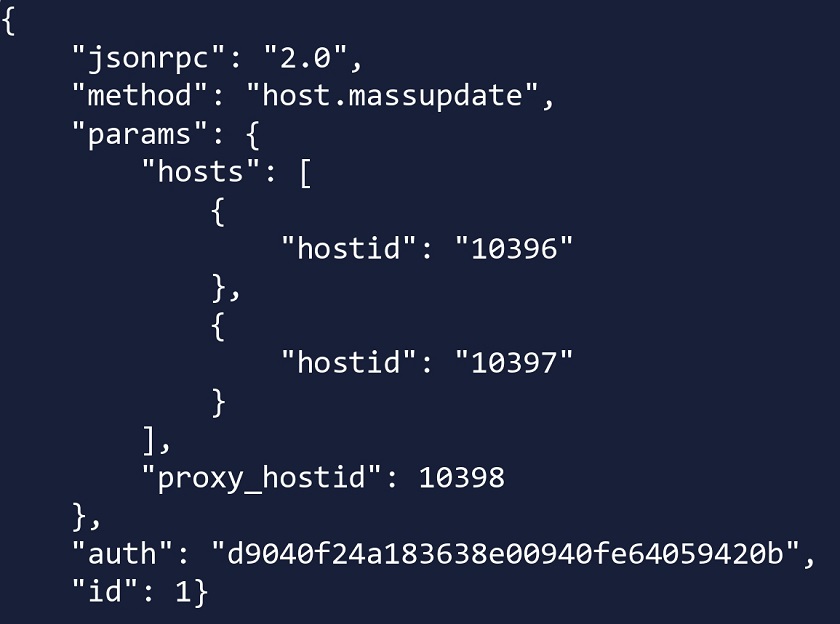
Another approach for  Zabbix proxy HA can also be implemented by using Zabbix API scripts. We can essentially have two proxies running without the need to have the HA suite. In this case, if proxy A is down, we can use Zabbix API to move a host from proxy A to proxy B.

Using Zabbix API script to change the proxy

Here, host.massupdate is used to change the proxy on the hosts. Combine this with a robust scripting logic and you end up with a very viable approach to move your hosts between proxies in failover scenarios.

Database replication

We have covered the HA for Zabbix server backend and let’s remember that with frontend servers, we can simply bring up additional frontends, for instance, by utilizing Docker containers. But what about the DB redundancy?

  • Database replication can be used as a form of redundancy for the Zabbix DB. No matter the DB backend – Postgres, MySQL, Oracle, we can deploy multiple DB nodes and utilize the native DB replication or use third-party tools for replication, for instance, Galera Cluster.
  • I personally prefer using native replication tools as it is a bit more simple and you don’t have to concern yourself with another configuration and management layer that could potentially fail and be a bother to troubleshoot. But this will depend on your requirements, design and skillset.

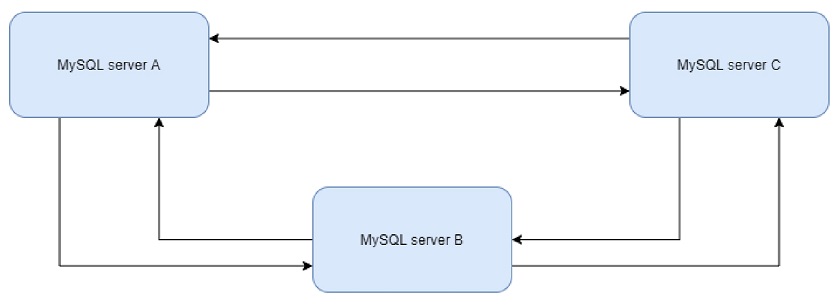
Let’s look at an example with MySQL replication. You can set it up in many different ways as multiple replication approaches are supported: master/slave, master/master, or even have multiple masters replicating to one another. It is completely up to you how to implement replication, especially if you are already experienced with such deployments.

Which approach is best? At the end of the day it will all depend on your company policies, database backend and a compromise between simplicty and extra redundancy. I definitely suggest delving deeper and studying use cases and articles for the DB backend of your choice, before you decide to go with any particular approach.

Database replication

Database performance tuning

Database tuning is vital for the long term stability of your Zabbix instance. The database defaults might be sufficient for your home office, but for large multi-tenant environments with tens of thousands new values per second they will not suffice. The database defaults depend on the database backend and the database version used, but ideally, these should be tuned and tested, preferably during the design stage, before you have deployed your Zabbix instance in production.

After installing the database backend we need to take a look at the hardware resources available. Ideally, you have already estimated the hardware resources required for your instance and ensured that DB hosts have sufficient memory, CPU resources and storage has been selected according to the I/O requirements. Now, you can move on to tuning your database backend.

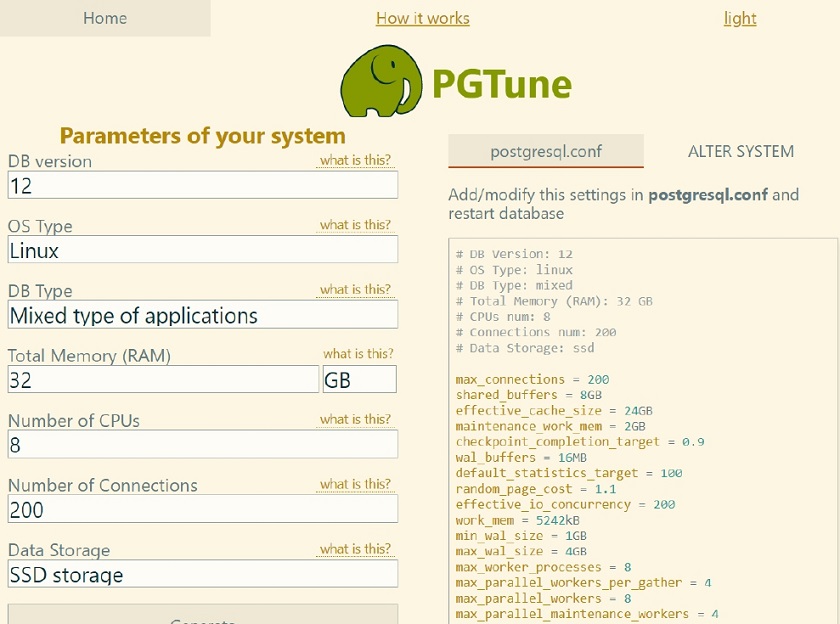
As an example with Postgres I used PGTune — an online database tuning tool. This is a simple estimate that should still provide you with a somewhat adequate configuration. Though ideally, you should have a DBA on board that is aware of what kind of data loads you will be dealing with to help you with an optimal database configuration.

Database performance tuning

History table partitioning

In such large environments, you will most likely see that housekeeper cannot keep up with the amount of data stored, unable to clean it up in a timely fashion with the housekeeper processes utilization reaching reaching 100 percent for 20-30 minutes at a time. This will have a negative effect on the overall database performance for the duration of housekeeping.

At this point, it is recommended to implement partitioning for history/trend tables. We can use Postgres with TimescaleDB plugin for this. Partitioning is supported out of the box, and you can configure it in Administration > General > Housekeeping.

For MySQL and Oracle backends we would have to rely on custom partitioning scripts or procedures. In addition, community-provided partitioning scripts are publicly available.

As always – don’t forget to test 3rd party scripts in a test environment before deploying it in production!

Community partitioning solution for MySQL

You can always create your own partitioning script, but you should be aware of what you’re doing and how things should be partitioned. We should always be partitioning only history and trend tables.

History table partitioning with TimescaleDB

  • TimescaleDB plugin for PostgreSQL DB backends supports out-of-the-box partitioning. You don’t have to rely on community scripts.
  • On TimescaleDB, we need to specify the chunk_time_interval parameter, which will define the partition chunk size.
  • In addition, we can also add compression of history/trends, which helps to reduce the history table size by 60-80 percent. Again, in such scenarios, your database is going to be huge — terabytes in size with hundreds of customers, each having thousands of metrics per second. So, compression is a really valuable asset.
  • The only thing we have to take into account is that compressed data is read-only and cannot be changed post-compression. So, no more changes or inserts are possible for the compressed chunks.

History and trends compression

To-do list

  • Deploy the latest available Zabbix version. Ideally stick with an LTS version.
  • Deploy proxy servers, define and configure HA/Replication on Zabbix proxies, as well as on Zabbix servers and databases.
  • Implement partitioning to improve database performance.
  • Implement throttling to reduce the volume of the incoming data.
  • Tune your database! Either use online guides or consult with your DBA.

With our to-do list completed, we can have our Zabbix environment with deployed with redundancy in mind, providing monitoring as a service for hundreds of customers, multiple proxies running for each of the customers, HA in place, and Zabbix performing up to our expectations.

Questions & Answers

Question. Will Zabbix have its native HA solution? Will it be the whole package or does it involve installing individual components and maintaining them?

Answer. It’s planned on the roadmap to have a native HA solution in Zabbix 6.0. You should be able to get your hands on it when the 6.0 beta version gets released. Hopefully, you’ll be able to get your hands on it, test it out yourselves and give us feedback. From the looks of it it should be very much plug-and-play and will remove a lot of management overhead when comparing it with current HA implementation. Right now this is being developed only for the Zabbix backend server. As for the frontend – nothing is stopping you from having multiple frontends pointed at the same DB/Zabbix backend server. 

Question. Can I run Zabbix on a single server and sell monitoring service to several customers with fully isolated environments, not just GUI, but also items, triggers, etc.

Answer. Yes, you can. You can have a single Zabbix instance and multiple customers being monitored by this instance. The only extra step that might be required is deploying proxies on the customer’s side. By using permission restrictions, proxy servers, roles, etc., we can then monitor multiple customers from a single Zabbix instance.

Question. When we change proxy, the agent configuration has to be updated. What about HA configuration on the proxy?

Answer. That really depends on the approach. If the agent is getting pointed at the virtual IP address and HA is managed by PCS, Corosync, or Pacemaker, then it should be fine as is and the VIP should just be on the currently active host. So, you’ll be essentially rerouted. With the HA by way of API approach, you can simply allow your agent to accept connections from both proxies. With ServerActive we can also specify multiple endpoints, so agents can actually be prepared for such an environment.

Question. How to merge two different instances into a single monitoring instance?

Answer. This is a complex task. First off, both instances need to have the same major Zabbix backend version. You might simply migrate the history from one instance to another, but then you will have some problems with underlying element IDs. So, in one instance you have your own set of items, triggers, users, etc. with your own set of IDs. These will most likely conflict with the set of IDs on the other instance.

You can do partial migration or use the export function to export your templates, hosts, value maps, network maps. I would try to export as much as I can as migration on SQL level will be a real pain. It is possible if you’re stubborn enough, but it can end up being a really complex task that can take days if not weeks to fully implement and test.

Question. Do subgroups relate to templates as well?

Answer. Subgroups relate to templates in a way where we can also define permissions to reading and modifying templates. For templates, you can also create per-customer templates and assign them to host groups. Users that have access to these host groups can then read or modify the templates.

Why Zabbix throttling preprocessing is a key point for high-frequency monitoring

Post Syndicated from Dmitry Lambert original https://blog.zabbix.com/why-zabbix-throttling-preprocessing-is-a-key-point-for-high-frequency-monitoring/12364/

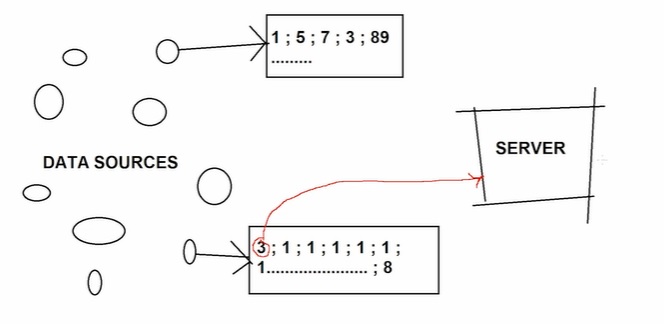
Sometimes we need much more than collecting generic data from our servers or network devices. For high-frequency monitoring, we need functionality to offload сore components from the extensive load. Throttling is the exact thing that will allow you to drop repetitive values on a Pre-processing level and collect only changing values.

Contents

I. High-frequency monitoring (0:33)

1. High-frequency monitoring issues (2:25)
2. Throttling (5:55)

Throttling is available since Zabbix 4.2 and is highly effective for high-frequency monitoring.

High-frequency monitoring

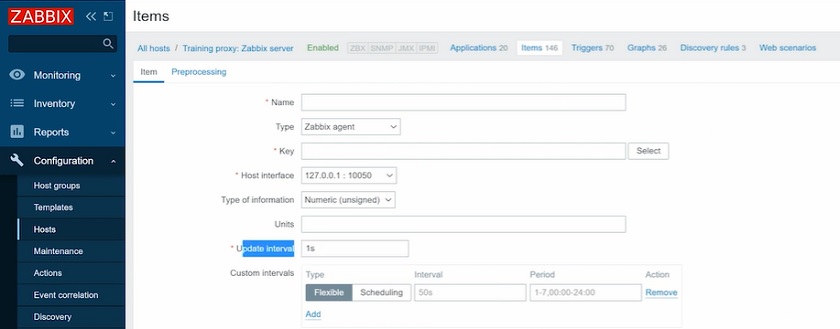
We have to set update intervals for all of the items we create in Configuration > Host > Items > Create item.

Setting update interval

The smallest update interval for regular items in Zabbix is one second. If we want to monitor all items, including memory usage, network bandwidth, or CPU load once per second, this can be considered a high-frequency interval. However, in the case of industrial equipment or telemetry data, we’ll most likely need the data more often, for instance, every 1 millisecond.

The easiest way to send data every millisecond is to use Zabbix sender — a small utility to send values to the Zabbix server or the proxy. But first, these values should be gathered.

High-frequency monitoring issues

Selecting an update interval for different items

We have to think about performance, as the more data we have, the more performance issues will arise and the more powerful hardware we’ll have to buy.

If the data grabbed from a host is constantly changing, it makes sense to collect the data every 10 or 100 milliseconds, for instance. This means that we have to process this changing data with the triggers, store it in the database, visualize it in the Latest data, as every time we receive a new value.

There are values that does not have that trend to change very frequently, but without Throttling we would still collect a new value every milisecond and process it with all our triggers and internal processes, even if the value does not change over hours.

Throttling

The greatest way to solve this problem is through throttling.

To illustrate it, in Configuration > Hosts, let’s create a ‘Throttling‘ host and add it to a group.

Creating host

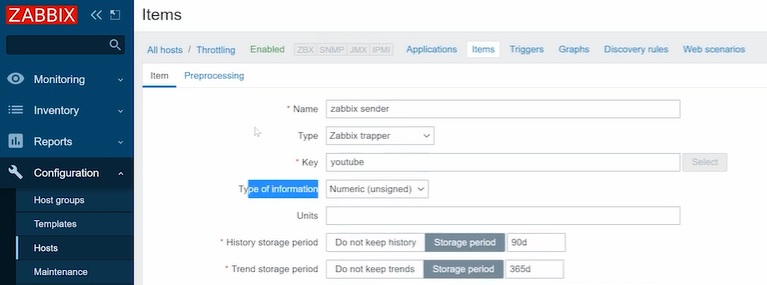
Then we’ll create an item to work as a Zabbix sender item.

Creating Zabbix sender item

NOTE. For a Zabbix sender item, the Type should always be ‘Zabbix trapper’.

Then open the CLI and reload the config cache:

zabbix_server -R config_cache_reload

Now we can send values to the Zabbix sender, specifying IP address of the Zabbix server, hostname, which is case-sensitive, the key, and then the value — 1:

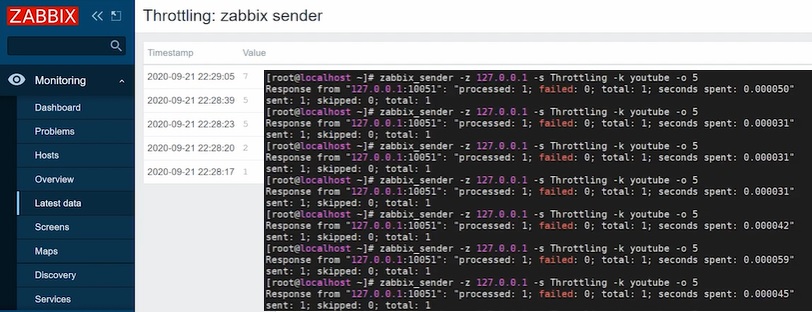
zabbix_sender -z 127.0.0.1 -s Throttling -k youtube -o 1

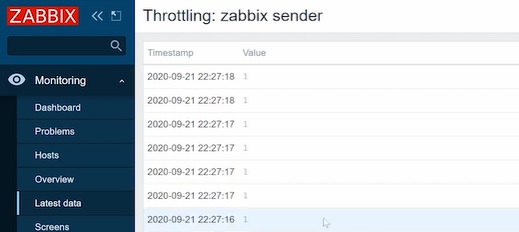
If we send value “1” several times, they all will be displayed in Monitoring > Latest data.

Displaying the values grabbed from the host

NOTE. It’s possible to filter the Latest data to display only the needed host and set a sufficient range of the last values to be displayed.

Using this method we are spamming the Zabbix server. So, we can add throttling to the settings of our item in the Pre-processing tab in Configuration > Hosts.

NOTE. There are no other parameters to configure besides this Pre-processing step from the throttling menu.

Discard unchanged

Discard unchanged throttling option

With the ‘Discard unchanged‘ throttling option, only new values will be processed by the server, while identical values will be ignored.

Throttling ignores identical values

Discard unchanged with a heartbeat

If we change the pre-processing settings for our item in the Pre-processing tab in Configuration > Hosts to ‘Discard unchanged with a heartbeat‘, we have one additional Parameter to specify — the interval to send the values if they are identical.

Discard unchanged with a heartbeat

So, if we specify 120 seconds, then in Monitoring > Latest data, we’ll get the values once per 120 seconds even if they are identical.

Displaying identical values with an interval

This throttling option is useful when we have nodata() triggers. So, with the Discard unchanged throttling option, the nodata() triggers will fire as identical data will be dropped. If we use Discard unchanged with heartbeat even identical values will be grabbed, so the trigger won’t fire.

In simpler words, the ‘Discard unchanged‘ throttling option will drop all identical values, while ‘Discard unchanged with heartbeat‘ will send even the identical values with the specified interval.

Watch the video.