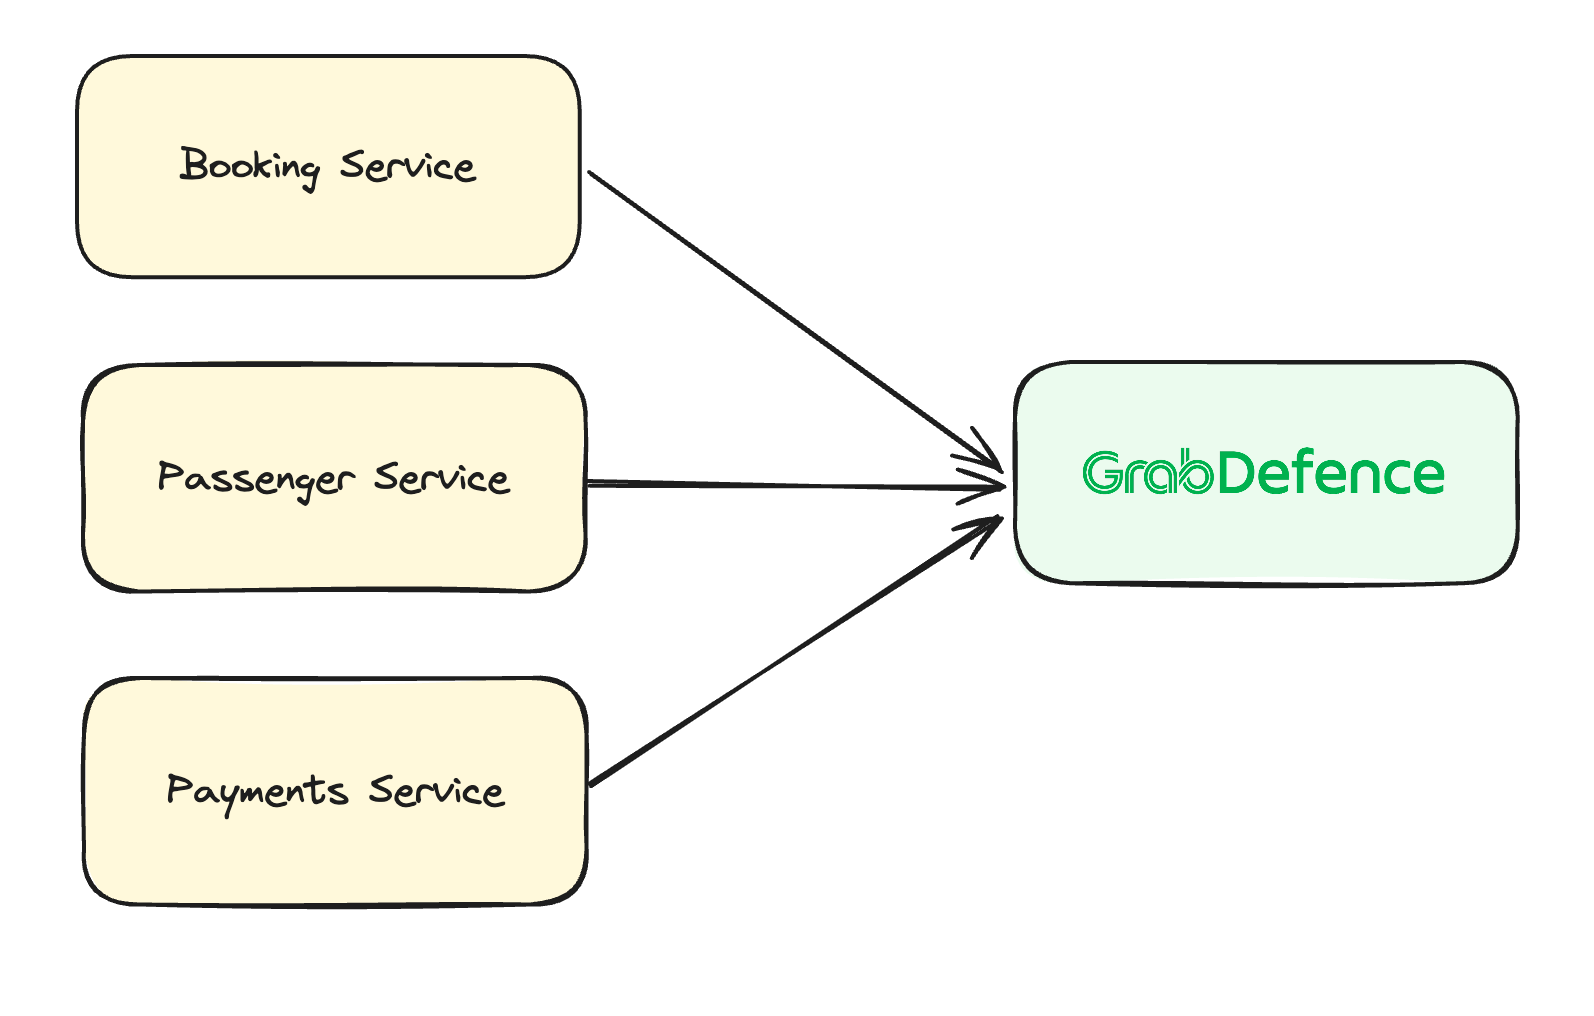
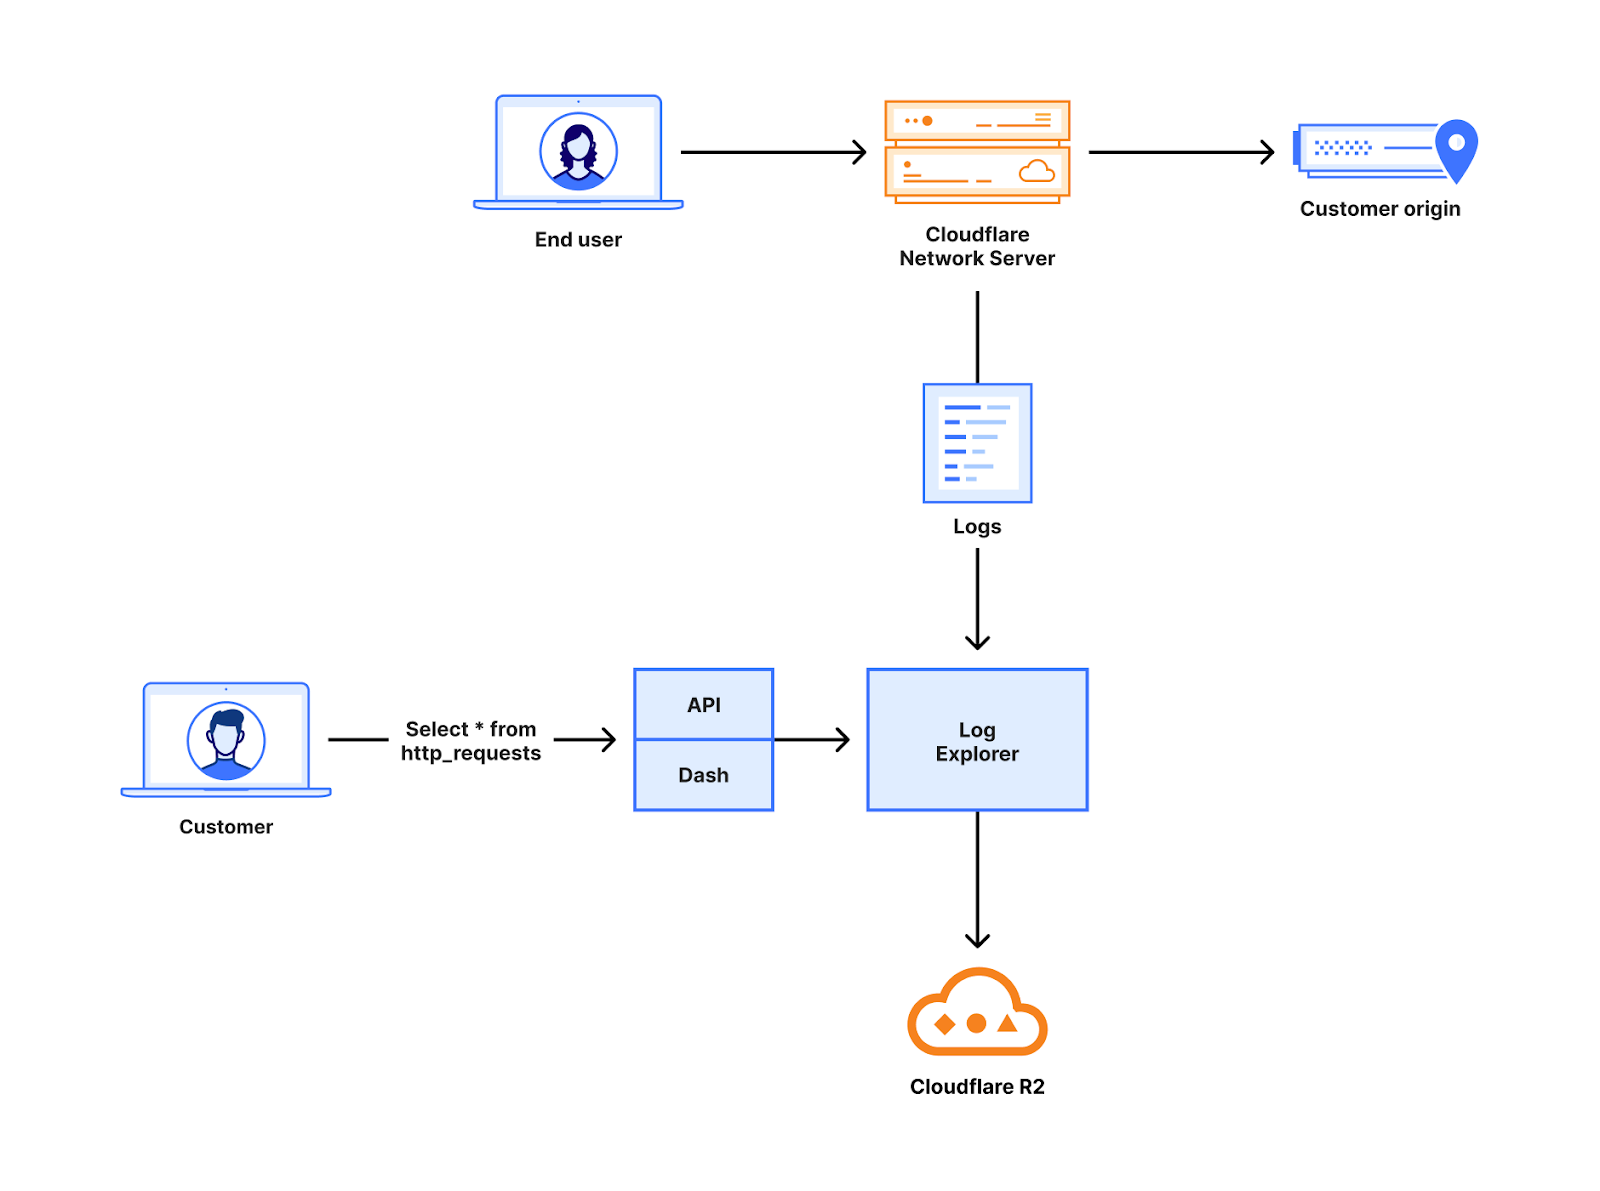
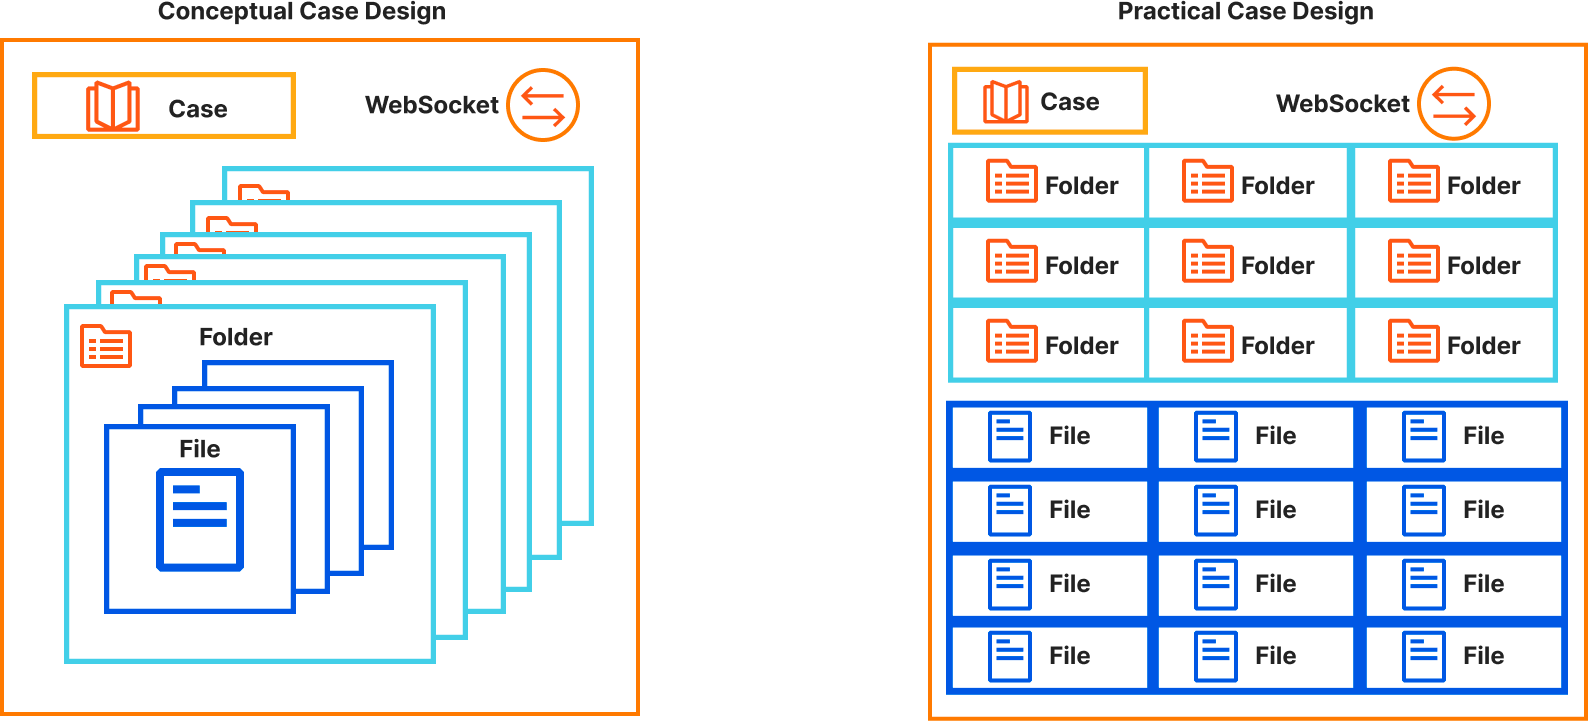
Grab has an in-house Risk Management platform called GrabDefence which relies on ingesting large amounts of data gathered from upstream services to power our heuristic risk rules and data science models in real time.
Fig 1. GrabDefence aggregates data from different upstream services
As Grab’s business grows, so does the amount of data. It becomes imperative that the data which fuels our risk systems is of reliable quality as any data discrepancy or missing data could impact fraud detection and prevention capabilities.
We need to quickly detect any data anomalies, which is where data observability comes in.
Data observability as a solution
Data observability is a type of data operation (DataOps; similar to DevOps) where teams build visibility over the health and quality of their data pipelines. This enables teams to be notified of data quality issues, and allows teams to investigate and resolve these issues faster.
We needed a solution that addresses the following issues:
Alerts for any data quality issues as soon as possible – so this means the observability tool had to work in real time.
With hundreds of data points to observe, we needed a neat and scalable solution which allows users to quickly pinpoint which data points were having issues.
A consistent way to compare, analyse, and compute data that might have different formats.
Hence, we decided to use Flink to standardise data transformations, compute, and observe data trends quickly (in real time) and scalably.
Utilising Flink for real-time computations at scale
What is Flink?
Flink SQL is a powerful, flexible tool for performing real-time analytics on streaming data. It allows users to query continuous data streams using standard SQL syntax, enabling complex event processing and data transformation within the Apache Flink ecosystem, which is particularly useful for scenarios requiring low-latency insights and decisions.
How we used Flink to compute data output
In Grab, data comes from multiple sources and while most of the data is in JSON format, the actual JSON structure differs between services. Because of JSON’s nested and dynamic data structure, it is difficult to consistently analyse the data – posing a significant challenge for real-time analysis.
To help address this issue, Apache Flink SQL has the capability to manage such intricacies with ease. It offers specialised functions tailored for parsing and querying JSON data, ensuring efficient processing.
Another standout feature of Flink SQL is the use of custom table functions, such as JSONEXPLOAD, which serves to deconstruct and flatten nested JSON structures into tabular rows. This transformation is crucial as it enables subsequent aggregation operations. By implementing a 5-minute tumbling window, Flink SQL can easily aggregate these now-flattened data streams. This technique is pivotal for monitoring, observing, and analysing data patterns and metrics in near real-time.
Now that data is aggregated by Flink for easy analysis, we still needed a way to incorporate comprehensive monitoring so that teams could be notified of any data anomalies or discrepancies in real time.
How we interfaced the output with Datadog
Datadog is the observability tool of choice in Grab, with many teams using Datadog for their service reliability observations and alerts. By aggregating data from Apache Flink and integrating it with Datadog, we can harness the synergy of real-time analytics and comprehensive monitoring. Flink excels in processing and aggregating data streams, which, when pushed to Datadog, can be further analysed and visualised. Datadog also provides seamless integration with collaboration tools like Slack, which enables teams to receive instant notifications and alerts.
With Datadog’s out-of-the-box features such as anomaly detection, teams can identify and be alerted to unusual patterns or outliers in their data streams. Taking a proactive approach to monitoring is crucial in maintaining system health and performance as teams can be alerted, then collaborate quickly to diagnose and address anomalies.
This integrated pipeline—from Flink’s real-time data aggregation to Datadog’s monitoring and Slack’s communication capabilities—creates a robust framework for real-time data operations. It ensures that any potential issues are quickly traced and brought to the team’s attention, facilitating a rapid response. Such an ecosystem empowers organisations to maintain high levels of system reliability and performance, ultimately enhancing the overall user experience.
Organising monitors and alerts using out-of-the-box solutions from Datadog
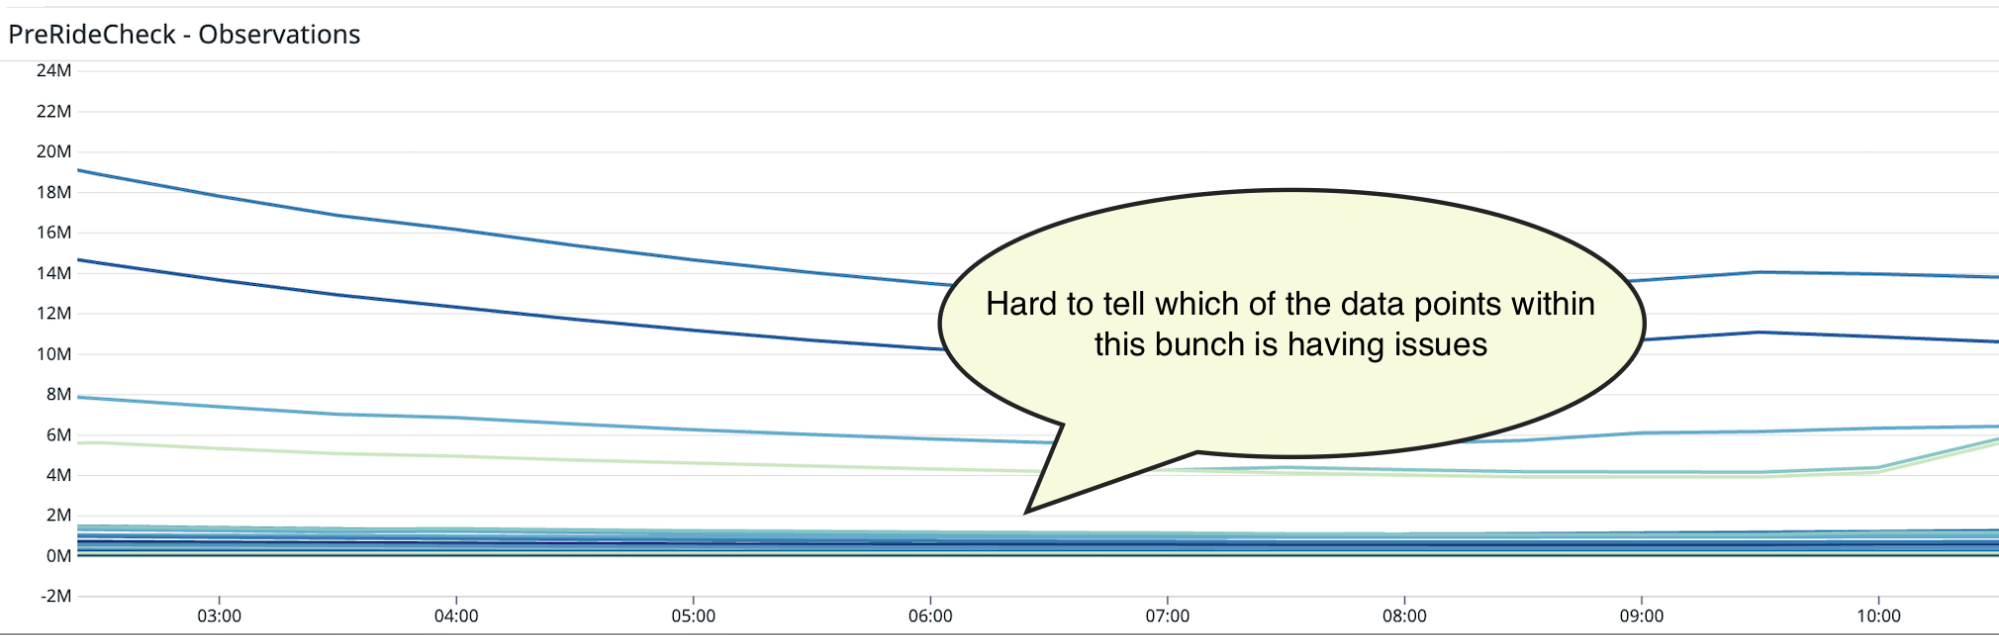
Once we integrated Flink data into Datadog, we realised that it could become unwieldy to try to identify the data point with issues from hundreds of other counters.
Fig 2. Hundreds of data points on a graph make it hard to decipher which ones have issues
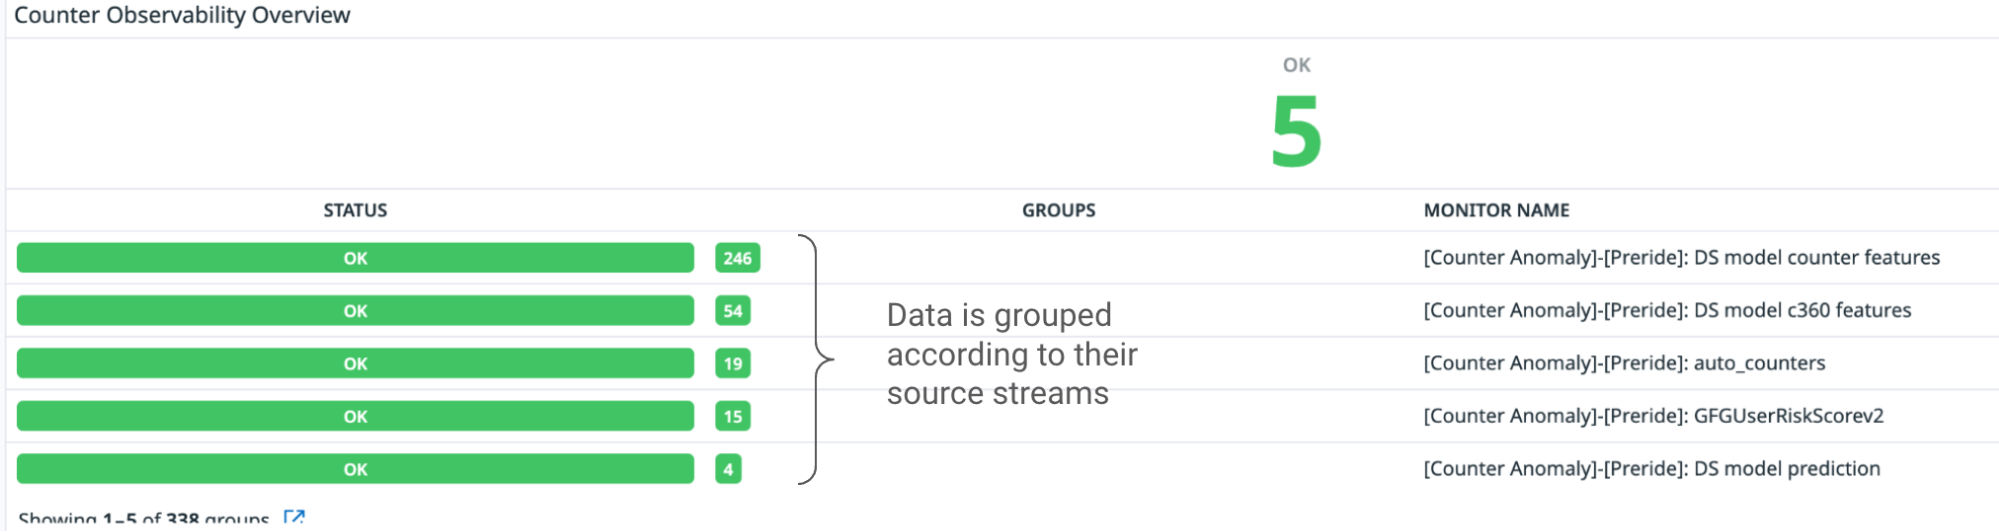
We decided to organise the counters according to the service stream it was coming from, and create individual monitors for each service stream. We used Datadog’s Monitor Summary tool to help visualise the total number of service streams we are reading from and the number of underlying data points within each stream.
Fig 3. Data is grouped according to their source stream
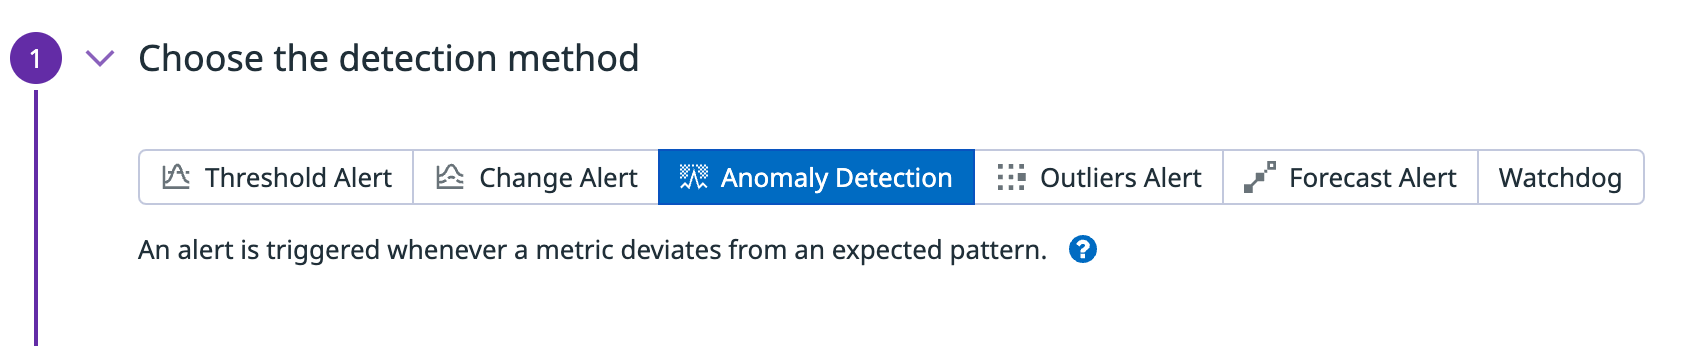
Within each individual stream, we used Datadog’s Anomaly Detection feature to create an alert whenever a data point from the stream exceeds a predefined threshold. This can be configured by the service teams on Datadog.
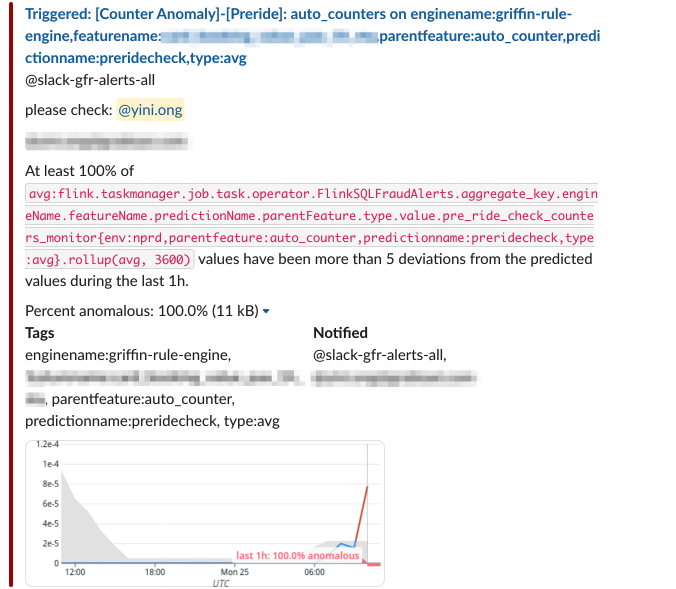
Fig 4. Datadog’s built-in Anomaly Detection function triggers alerts whenever a data point exceeds a threshold
These alerts are then sent to a Slack channel where the Data team is informed when a data point of interest starts throwing anomalous values.
Fig 5. Datadog integration with Slack to help alert users
Impact
Since the deployment of this data observability tool, we have seen significant improvement in the detection of anomalous values. If there are any anomalies or issues, we now get alerts within the same day (or hour) instead of days to weeks later.
Organising the alerts according to source streams have also helped simplify the monitoring load and allows users to quickly narrow down and identify which pipeline has failed.
What’s next?
At the moment, this data observability tool is only implemented on selected checkpoints in GrabDefence. We plan to expand the observability tool’s coverage to include more checkpoints, and continue to refine the workflows to detect and resolve these data issues.
Join us
Grab is the leading superapp platform in Southeast Asia, providing everyday services that matter to consumers. More than just a ride-hailing and food delivery app, Grab offers a wide range of on-demand services in the region, including mobility, food, package and grocery delivery services, mobile payments, and financial services across 428 cities in eight countries.
Powered by technology and driven by heart, our mission is to drive Southeast Asia forward by creating economic empowerment for everyone. If this mission speaks to you, join our team today!
Our customers depend on Amazon Web Services (AWS) for their mission-critical applications and most sensitive data. Every day, the world’s fastest-growing startups, largest enterprises, and most trusted governmental organizations are choosing AWS as the place to run their technology infrastructure. They choose us because security has been our top priority from day one. We designed AWS from its foundation to be the most secure way for our customers to run their workloads, and we’ve built our internal culture around security as a business imperative.
While technical security measures are important, organizations are made up of people. A recent report from the Cyber Safety Review Board (CSRB) makes it clear that a deficient security culture can be a root cause for avoidable errors that allow intrusions to succeed and remain undetected.
Security is our top priority
Our security culture starts at the top, and it extends through every part of our organization. Over eight years ago, we made the decision for our security team to report directly to our CEO. This structural design redefined how we build security into the culture of AWS and informs everyone at the company that security is our top priority by providing direct visibility to senior leadership. We empower our service teams to fully own the security of their services and scale security best practices and programs so our customers have the confidence to innovate on AWS.
We believe that there are four key principles to building a strong culture of security:
Security is built into our organizational structure
At AWS, we view security as a core function of our business, deeply connected to our mission objectives. This goes beyond good intentions—it’s embedded directly into our organizational structure. At Amazon, we make an intentional choice for all our security teams to report directly to the CEO while also being deeply embedded in our respective business units. The goal is to build security into the structural fabric of how we make decisions. Every week, the AWS leadership team, led by our CEO, meets with my team to discuss security and ensure we’re making the right choices on tactical and strategic security issues and course-correcting when needed. We report internally on operational metrics that tie our security culture to the impact that it has on our customers, connecting data to business outcomes and providing an opportunity for leadership to engage and ask questions. This support for security from the top levels of executive leadership helps us reinforce the idea that security is accelerating our business outcomes and improving our customers’ experiences rather than acting as a roadblock.
Security is everyone’s job
AWS operates with a strong ownership model built around our culture of security. Ownership is one of our key Leadership Principles at Amazon. Employees in every role receive regular training and reinforcement of the message that security is everyone’s job. Every service and product team is fully responsible for the security of the service or capability that they deliver. Security is built into every product roadmap, engineering plan, and weekly stand-up meeting, just as much as capabilities, performance, cost, and other core responsibilities of the builder team. The best security is not something that can be “bolted on” at the end of a process or on the outside of a system; rather, security is integral and foundational.
AWS business leaders prioritize building products and services that are designed to be secure. At the same time, they strive to create an environment that encourages employees to identify and escalate potential security concerns even when uncertain about whether there is an actual issue. Escalation is a normal part of how we work in AWS, and our practice of escalation provides a “security reporting safe space” to everyone. Our teams and individuals are encouraged to report and escalate any possible security issues or concerns with a high-priority ticket to the security team. We would much rather hear about a possible security concern and investigate it, regardless of whether it is unlikely or not. Our employees know that we welcome reports even for things that turn out to be nonissues.
Distributing security expertise and ownership across AWS
Our central AWS Security team provides a number of critical capabilities and services that support and enable our engineering and service teams to fulfill their security responsibilities effectively. Our central team provides training, consultation, threat-modeling tools, automated code-scanning frameworks and tools, design reviews, penetration testing, automated API test frameworks, and—in the end—a final security review of each new service or new feature. The security reviewer is empowered to make a go or no-go decision with respect to each and every release. If a service or feature does not pass the security review process in the first review, we dive deep to understand why so we can improve processes and catch issues earlier in development. But, releasing something that’s not ready would be an even bigger failure, so we err on the side of maintaining our high security bar and always trying to deliver to the high standards that our customers expect and rely on.
One important mechanism to distribute security ownership that we’ve developed over the years is the Security Guardians program. The Security Guardians program trains, develops, and empowers service team developers in each two-pizza team to be security ambassadors, or Guardians, within the product teams. At a high level, Guardians are the “security conscience” of each team. They make sure that security considerations for a product are made earlier and more often, helping their peers build and ship their product faster, while working closely with the central security team to help ensure the security bar remains high at AWS. Security Guardians feel empowered by being part of a cross-organizational community while also playing a critical role for the team and for AWS as a whole.
Scaling security through innovation
Another way we scale security across our culture at AWS is through innovation. We innovate to build tools and processes to help all of our people be as effective as possible and maintain focus. We use artificial intelligence (AI) to accelerate our secure software development process, as well as new generative AI–powered features in Amazon Inspector, Amazon Detective, AWS Config, and Amazon CodeWhisperer that complement the human skillset by helping people make better security decisions, using a broader collection of knowledge. This pattern of combining sophisticated tooling with skilled engineers is highly effective because it positions people to make the nuanced decisions required for effective security.
For large organizations, it can take years to assess every scenario and prove systems are secure. Even then, their systems are constantly changing. Our automated reasoning tools use mathematical logic to answer critical questions about infrastructure to detect misconfigurations that could potentially expose data. This provable security provides higher assurance in the security of the cloud and in the cloud. We apply automated reasoning in key service areas such as storage, networking, virtualization, identity, and cryptography. Amazon scientists and engineers also use automated reasoning to prove the correctness of critical internal systems. We process over a billion mathematical queries per day that power AWS Identity and Access Management Access Analyzer, Amazon Simple Storage Service (Amazon S3) Block Public Access, and other security offerings. AWS is the first and only cloud provider to use automated reasoning at this scale.
Advancing the future of cloud security
At AWS, we care deeply about our culture of security. We’re consistently working backwards from our customers and investing in raising the bar on our security tools and capabilities. For example, AWS enables encryption of everything. AWS Key Management Service (AWS KMS) is the first and only highly scalable, cloud-native key management system that is also FIPS 140-2 Level 3 certified. No one can retrieve customer plaintext keys, not even the most privileged admins within AWS. With the AWS Nitro System, which is the foundation of the AWS compute service Amazon Elastic Compute Cloud (Amazon EC2), we designed and delivered first-of-a-kind and still unique in the industry innovation to maximize the security of customers’ workloads. The Nitro System provides industry-leading privacy and isolation for all their compute needs, including GPU-based computing for the latest generative AI systems. No one, not even the most privileged admins within AWS, can access a customer’s workloads or data in Nitro-based EC2 instances.
We continue to innovate on behalf of our customers so they can move quickly, securely, and with confidence to enable their businesses, and our track record in the area of cloud security is second to none. That said, cybersecurity challenges continue to evolve, and while we’re proud of our achievements to date, we’re committed to constant improvement as we innovate and advance our technologies and our culture of security.
If you have feedback about this post, submit comments in the Comments section below. If you have questions about this post, contact AWS Support.
In an ever-changing security landscape, teams must be able to quickly remediate security risks. Many organizations look for ways to automate the remediation of security findings that are currently handled manually. Amazon CodeWhisperer is an artificial intelligence (AI) coding companion that generates real-time, single-line or full-function code suggestions in your integrated development environment (IDE) to help you quickly build software. By using CodeWhisperer, security teams can expedite the process of writing security automation scripts for various types of findings that are aggregated in AWS Security Hub, a cloud security posture management (CSPM) service.
In this post, we present some of the current challenges with security automation and walk you through how to use CodeWhisperer, together with Amazon EventBridge and AWS Lambda, to automate the remediation of Security Hub findings. Before reading further, please read the AWS Responsible AI Policy.
Current challenges with security automation
Many approaches to security automation, including Lambda and AWS Systems Manager Automation, require software development skills. Furthermore, the process of manually writing code for remediation can be a time-consuming process for security professionals. To help overcome these challenges, CodeWhisperer serves as a force multiplier for qualified security professionals with development experience to quickly and effectively generate code to help remediate security findings.
Security professionals should still cultivate software development skills to implement robust solutions. Engineers should thoroughly review and validate any generated code, as manual oversight remains critical for security.
Solution overview
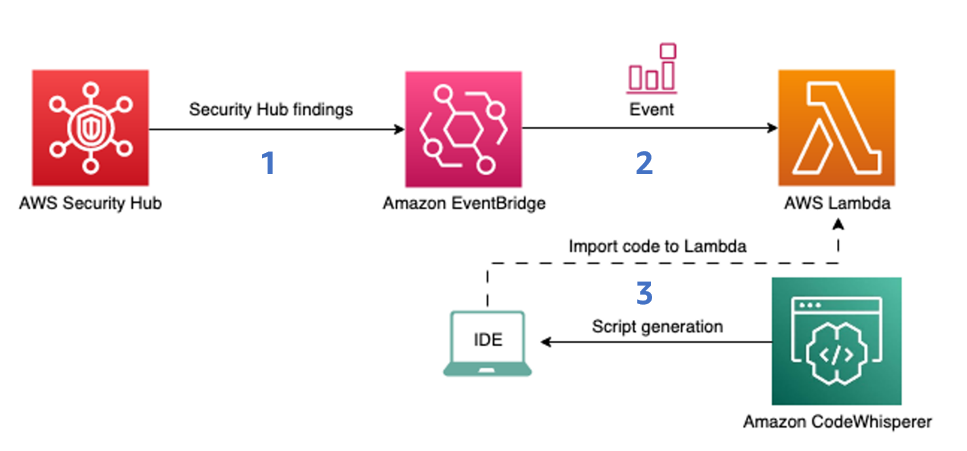
Figure 1 shows how the findings that Security Hub produces are ingested by EventBridge, which then invokes Lambda functions for processing. The Lambda code is generated with the help of CodeWhisperer.
Figure 1: Diagram of the solution
Security Hub integrates with EventBridge so you can automatically process findings with other services such as Lambda. To begin remediating the findings automatically, you can configure rules to determine where to send findings. This solution will do the following:
Ingest an Amazon Security Hub finding into EventBridge.
Use an EventBridge rule to invoke a Lambda function for processing.
Use CodeWhisperer to generate the Lambda function code.
It is important to note that there are two types of automation for Security Hub finding remediation:
Partial automation, which is initiated when a human worker selects the Security Hub findings manually and applies the automated remediation workflow to the selected findings.
End-to-end automation, which means that when a finding is generated within Security Hub, this initiates an automated workflow to immediately remediate without human intervention.
Important: When you use end-to-end automation, we highly recommend that you thoroughly test the efficiency and impact of the workflow in a non-production environment first before moving forward with implementation in a production environment.
Prerequisites
To follow along with this walkthrough, make sure that you have the following prerequisites in place:
In this scenario, you have been tasked with making sure that versioning is enabled across all Amazon Simple Storage Service (Amazon S3) buckets in your AWS account. Additionally, you want to do this in a way that is programmatic and automated so that it can be reused in different AWS accounts in the future.
To do this, you will perform the following steps:
Generate the remediation script with CodeWhisperer
Create the Lambda function
Integrate the Lambda function with Security Hub by using EventBridge
Create a custom action in Security Hub
Create an EventBridge rule to target the Lambda function
Run the remediation
Generate a remediation script with CodeWhisperer
The first step is to use VS Code to create a script so that CodeWhisperer generates the code for your Lambda function in Python. You will use this Lambda function to remediate the Security Hub findings generated by the [S3.14] S3 buckets should use versioning control.
Note: The underlying model of CodeWhisperer is powered by generative AI, and the output of CodeWhisperer is nondeterministic. As such, the code recommended by the service can vary by user. By modifying the initial code comment to prompt CodeWhisperer for a response, customers can change the corresponding output to help meet their needs. Customers should subject all code generated by CodeWhisperer to typical testing and review protocols to verify that it is free of errors and is in line with applicable organizational security policies. To learn about best practices on prompt engineering with CodeWhisperer, see this AWS blog post.
To generate the remediation script
Open a new VS Code window, and then open or create a new folder for your file to reside in.
Create a Python file called cw-blog-remediation.py as shown in Figure 2.
Figure 2: New VS Code file created called cw-blog-remediation.py
Add the following imports to the Python file.
import json
import boto3
Because you have the context added to your file, you can now prompt CodeWhisperer by using a natural language comment. In your file, below the import statements, enter the following comment and then press Enter.
# Create lambda function that turns on versioning for an S3 bucket after the function is triggered from Amazon EventBridge
Accept the first recommendation that CodeWhisperer provides by pressing Tab to use the Lambda function handler, as shown in Figure 3. &ngsp;
Figure 3: Generation of Lambda handler
To get the recommendation for the function from CodeWhisperer, press Enter. Make sure that the recommendation you receive looks similar to the following. CodeWhisperer is nondeterministic, so its recommendations can vary.
import json
import boto3
# Create lambda function that turns on versioning for an S3 bucket after function is triggered from Amazon EventBridgedef lambda_handler(event, context):
s3 = boto3.client('s3')
bucket = event['detail']['requestParameters']['bucketName']
response = s3.put_bucket_versioning(
Bucket=bucket,
VersioningConfiguration={
'Status': 'Enabled'
}
)
print(response)
return {
'statusCode': 200,
'body': json.dumps('Versioning enabled for bucket ' + bucket)
}
You can change the function body to fit your use case. To get the Amazon Resource Name (ARN) of the S3 bucket from the EventBridge event, replace the bucket variable with the following line:
To prompt CodeWhisperer to extract the bucket name from the bucket ARN, use the following comment:
# Take the S3 bucket name from the ARN of the S3 bucket
Your function code should look similar to the following:
import json
import boto3
# Create lambda function that turns on versioning for an S3 bucket after function is triggered from Amazon EventBridgedef lambda_handler(event, context):
s3 = boto3.client('s3')
bucket = event['detail']['findings'][0]['Resources'][0]['Id']
# Take the S3 bucket name from the ARN of the S3 bucket
bucket = bucket.split(':')[5]
response = s3.put_bucket_versioning(
Bucket=bucket,
VersioningConfiguration={
'Status': 'Enabled'
}
)
print(response)
return {
'statusCode': 200,
'body': json.dumps('Versioning enabled for bucket ' + bucket)
}
Create a .zip file for cw-blog-remediation.py. Find the file in your local file manager, right-click the file, and select compress/zip. You will use this .zip file in the next section of the post.
Create the Lambda function
The next step is to use the automation script that you generated to create the Lambda function that will enable versioning on applicable S3 buckets.
In the left navigation pane, choose Functions, and then choose Create function.
Select Author from Scratch and provide the following configurations for the function:
For Function name, select sec_remediation_function.
For Runtime, select Python 3.12.
For Architecture, select x86_64.
For Permissions, select Create a new role with basic Lambda permissions.
Choose Create function.
To upload your local code to Lambda, select Upload from and then .zip file, and then upload the file that you zipped.
Verify that you created the Lambda function successfully. In the Code source section of Lambda, you should see the code from the automation script displayed in a new tab, as shown in Figure 4.
Figure 4: Source code that was successfully uploaded
Choose the Code tab.
Scroll down to the Runtime settings pane and choose Edit.
For Handler, enter cw-blog-remediation.lambda_handler for your function handler, and then choose Save, as shown in Figure 5.
Figure 5: Updated Lambda handler
For security purposes, and to follow the principle of least privilege, you should also add an inline policy to the Lambda function’s role to perform the tasks necessary to enable versioning on S3 buckets.
In the Lambda console, navigate to the Configuration tab and then, in the left navigation pane, choose Permissions. Choose the Role name, as shown in Figure 6.
Figure 6: Lambda role in the AWS console
In the Add permissions dropdown, select Create inline policy.
Figure 7: Create inline policy
Choose JSON, add the following policy to the policy editor, and then choose Next.
In the left navigation pane, choose Settings, and then choose Custom actions.
Choose Create custom action.
Provide the following information, as shown in Figure 8:
For Name, enter TurnOnS3Versioning.
For Description, enter Action that will turn on versioning for a specific S3 bucket.
For Custom action ID, enter TurnOnS3Versioning.
Figure 8: Create a custom action in Security Hub
Choose Create custom action.
Make a note of the Custom action ARN. You will need this ARN when you create a rule to associate with the custom action in EventBridge.
Create an EventBridge rule to target the Lambda function
The next step is to create an EventBridge rule to capture the custom action. You will define an EventBridge rule that matches events (in this case, findings) from Security Hub that were forwarded by the custom action that you defined previously.
On the Define rule detail page, give your rule a name and description that represents the rule’s purpose—for example, you could use the same name and description that you used for the custom action. Then choose Next.
Scroll down to Event pattern, and then do the following:
For Event source, make sure that AWS services is selected.
For AWS service, select Security Hub.
For Event type, select Security Hub Findings – Custom Action.
Select Specific custom action ARN(s) and enter the ARN for the custom action that you created earlier.
Figure 9: Specify the EventBridge event pattern for the Security Hub custom action workflow
As you provide this information, the Event pattern updates.
Choose Next.
On the Select target(s) step, in the Select a target dropdown, select Lambda function. Then from the Function dropdown, select sec_remediation_function.
Choose Next.
On the Configure tags step, choose Next.
On the Review and create step, choose Create rule.
Run the automation
Your automation is set up and you can now test the automation. This test covers a partial automation workflow, since you will manually select the finding and apply the remediation workflow to one or more selected findings.
Important: As we mentioned earlier, if you decide to make the automation end-to-end, you should assess the impact of the workflow in a non-production environment. Additionally, you may want to consider creating preventative controls if you want to minimize the risk of event occurrence across an entire environment.
To run the automation
In the Security Hub console, on the Findings tab, add a filter by entering Title in the search box and selecting that filter. Select IS and enter S3 general purpose buckets should have versioning enabled (case sensitive). Choose Apply.
In the filtered list, choose the Title of an active finding.
Before you start the automation, check the current configuration of the S3 bucket to confirm that your automation works. Expand the Resources section of the finding.
Under Resource ID, choose the link for the S3 bucket. This opens a new tab on the S3 console that shows only this S3 bucket.
In your browser, go back to the Security Hub tab (don’t close the S3 tab—you will need to return to it), and on the left side, select this same finding, as shown in Figure 10.
Figure 10: Filter out Security Hub findings to list only S3 bucket-related findings
In the Actions dropdown list, choose the name of your custom action.
Figure 11: Choose the custom action that you created to start the remediation workflow
When you see a banner that displays Successfully started action…, go back to the S3 browser tab and refresh it. Verify that the S3 versioning configuration on the bucket has been enabled as shown in figure 12.
Figure 12: Versioning successfully enabled
Conclusion
In this post, you learned how to use CodeWhisperer to produce AI-generated code for custom remediations for a security use case. We encourage you to experiment with CodeWhisperer to create Lambda functions that remediate other Security Hub findings that might exist in your account, such as the enforcement of lifecycle policies on S3 buckets with versioning enabled, or using automation to remove multiple unused Amazon EC2 elastic IP addresses. The ability to automatically set public S3 buckets to private is just one of many use cases where CodeWhisperer can generate code to help you remediate Security Hub findings.
To sum up, CodeWhisperer acts as a tool that can help boost the productivity of security experts who have coding abilities, assisting them to swiftly write code to address security issues. However, security specialists should continue building their software development capabilities to implement robust solutions. Engineers should carefully review and test any generated code, since human oversight is still vital for security.
If you have feedback about this post, submit comments in the Comments section below. If you have questions about this post, contact AWS Support.
Today, AWS Key Management Service (AWS KMS) is introducing faster options for automatic symmetric key rotation. We’re also introducing rotate on-demand, rotation visibility improvements, and a new limit on the price of all symmetric keys that have had two or more rotations (including existing keys). In this post, I discuss all those capabilities and changes. I also present a broader overview of how symmetric cryptographic key rotation came to be, and cover our recommendations on when you might need rotation and how often to rotate your keys. If you’ve ever been curious about AWS KMS automatic key rotation—why it exists, when to enable it, and when to use it on-demand—read on.
How we got here
There are longstanding reasons for cryptographic key rotation. If you were Caesar in Roman times and you needed to send messages with sensitive information to your regional commanders, you might use keys and ciphers to encrypt and protect your communications. There are well-documented examples of using cryptography to protect communications during this time, so much so that the standard substitution cipher, where you swap each letter for a different letter that is a set number of letters away in the alphabet, is referred to as Caesar’s cipher. The cipher is the substitution mechanism, and the key is the number of letters away from the intended letter you go to find the substituted letter for the ciphertext.
The challenge for Caesar in relying on this kind of symmetric key cipher is that both sides (Caesar and his field generals) needed to share keys and keep those keys safe from prying eyes. What happens to Caesar’s secret invasion plans if the key used to encipher his attack plan was secretly intercepted in transmission down the Appian Way? Caesar had no way to know. But if he rotated keys, he could limit the scope of which messages could be read, thus limiting his risk. Messages sent under a key created in the year 52 BCE wouldn’t automatically work for messages sent the following year, provided that Caesar rotated his keys yearly and the newer keys weren’t accessible to the adversary. Key rotation can reduce the scope of data exposure (what a threat actor can see) when some but not all keys are compromised. Of course, every time the key changed, Caesar had to send messengers to his field generals to communicate the new key. Those messengers had to ensure that no enemies intercepted the new keys without their knowledge – a daunting task.
Figure 1: The state of the art for secure key rotation and key distribution in 52 BC.
Fast forward to the 1970s–2000s
In modern times, cryptographic algorithms designed for digital computer systems mean that keys no longer travel down the Appian Way. Instead, they move around digital systems, are stored in unprotected memory, and sometimes are printed for convenience. The risk of key leakage still exists, therefore there is a need for key rotation. During this period, more significant security protections were developed that use both software and hardware technology to protect digital cryptographic keys and reduce the need for rotation. The highest-level protections offered by these techniques can limit keys to specific devices where they can never leave as plaintext. In fact, the US National Institute of Standards and Technologies (NIST) has published a specific security standard, FIPS 140, that addresses the security requirements for these cryptographic modules.
Modern cryptography also has the risk of cryptographic key wear-out
Besides addressing risks from key leakage, key rotation has a second important benefit that becomes more pronounced in the digital era of modern cryptography—cryptographic key wear-out. A key can become weaker, or “wear out,” over time just by being used too many times. If you encrypt enough data under one symmetric key, and if a threat actor acquires enough of the resulting ciphertext, they can perform analysis against your ciphertext that will leak information about the key. Current cryptographic recommendations to protect against key wear-out can vary depending on how you’re encrypting data, the cipher used, and the size of your key. However, even a well-designed AES-GCM implementation with robust initialization vectors (IVs) and large key size (256 bits) should be limited to encrypting no more than 4.3 billion messages (232), where each message is limited to about 64 GiB under a single key.
Figure 2: Used enough times, keys can wear out.
During the early 2000s, to help federal agencies and commercial enterprises navigate key rotation best practices, NIST formalized several of the best practices for cryptographic key rotation in the NIST SP 800-57 Recommendation for Key Management standard. It’s an excellent read overall and I encourage you to examine Section 5.3 in particular, which outlines ways to determine the appropriate length of time (the cryptoperiod) that a specific key should be relied on for the protection of data in various environments. According to the guidelines, the following are some of the benefits of setting cryptoperiods (and rotating keys within these periods):
5.3 Cryptoperiods
A cryptoperiod is the time span during which a specific key is authorized for use by legitimate entities or the keys for a given system will remain in effect. A suitably defined cryptoperiod:
Limits the amount of information that is available for cryptanalysis to reveal the key (e.g. the number of plaintext and ciphertext pairs encrypted with the key);
Limits the amount of exposure if a single key is compromised;
Limits the use of a particular algorithm (e.g., to its estimated effective lifetime);
Limits the time available for attempts to penetrate physical, procedural, and logical access mechanisms that protect a key from unauthorized disclosure;
Limits the period within which information may be compromised by inadvertent disclosure of a cryptographic key to unauthorized entities; and
Limits the time available for computationally intensive cryptanalysis.
Sometimes, cryptoperiods are defined by an arbitrary time period or maximum amount of data protected by the key. However, trade-offs associated with the determination of cryptoperiods involve the risk and consequences of exposure, which should be carefully considered when selecting the cryptoperiod (see Section 5.6.4).
One of the challenges in applying this guidance to your own use of cryptographic keys is that you need to understand the likelihood of each risk occurring in your key management system. This can be even harder to evaluate when you’re using a managed service to protect and use your keys.
Fast forward to the 2010s: Envisioning a key management system where you might not need automatic key rotation
When we set out to build a managed service in AWS in 2014 for cryptographic key management and help customers protect their AWS encryption workloads, we were mindful that our keys needed to be as hardened, resilient, and protected against external and internal threat actors as possible. We were also mindful that our keys needed to have long-term viability and use built-in protections to prevent key wear-out. These two design constructs—that our keys are strongly protected to minimize the risk of leakage and that our keys are safe from wear out—are the primary reasons we recommend you limit key rotation or consider disabling rotation if you don’t have compliance requirements to do so. Scheduled key rotation in AWS KMS offers limited security benefits to your workloads.
Specific to key leakage, AWS KMS keys in their unencrypted, plaintext form cannot be accessed by anyone, even AWS operators. Unlike Caesar’s keys, or even cryptographic keys in modern software applications, keys generated by AWS KMS never exist in plaintext outside of the NIST FIPS 140-2 Security Level 3 fleet of hardware security modules (HSMs) in which they are used. See the related post AWS KMS is now FIPS 140-2 Security Level 3. What does this mean for you? for more information about how AWS KMS HSMs help you prevent unauthorized use of your keys. Unlike many commercial HSM solutions, AWS KMS doesn’t even allow keys to be exported from the service in encrypted form. Why? Because an external actor with the proper decryption key could then expose the KMS key in plaintext outside the service.
This hardened protection of your key material is salient to the principal security reason customers want key rotation. Customers typically envision rotation as a way to mitigate a key leaking outside the system in which it was intended to be used. However, since KMS keys can be used only in our HSMs and cannot be exported, the possibility of key exposure becomes harder to envision. This means that rotating a key as protection against key exposure is of limited security value. The HSMs are still the boundary that protects your keys from unauthorized access, no matter how many times the keys are rotated.
If we decide the risk of plaintext keys leaking from AWS KMS is sufficiently low, don’t we still need to be concerned with key wear-out? AWS KMS mitigates the risk of key wear-out by using a key derivation function (KDF) that generates a unique, derived AES 256-bit key for each individual request to encrypt or decrypt under a 256-bit symmetric KMS key. Those derived encryption keys are different every time, even if you make an identical call for encrypt with the same message data under the same KMS key. The cryptographic details for our key derivation method are provided in the AWS KMS Cryptographic Details documentation, and KDF operations use the KDF in counter mode, using HMAC with SHA256. These KDF operations make cryptographic wear-out substantially different for KMS keys than for keys you would call and use directly for encrypt operations. A detailed analysis of KMS key protections for cryptographic wear-out is provided in the Key Management at the Cloud Scale whitepaper, but the important take-away is that a single KMS key can be used for more than a quadrillion (250) encryption requests without wear-out risk.
In fact, within the NIST 800-57 guidelines is consideration that when the KMS key (key-wrapping key in NIST language) is used with unique data keys, KMS keys can have longer cryptoperiods:
“In the case of these very short-term key-wrapping keys, an appropriate cryptoperiod (i.e., which includes both the originator and recipient-usage periods) is a single communication session. It is assumed that the wrapped keys will not be retained in their wrapped form, so the originator-usage period and recipient-usage period of a key-wrapping key is the same. In other cases, a key-wrapping key may be retained so that the files or messages encrypted by the wrapped keys may be recovered later. In such cases, the recipient-usage period may be significantly longer than the originator-usage period of the key-wrapping key, and cryptoperiods lasting for years may be employed.”
Source: NIST 800-57 Recommendations for Key Management, section 5.3.6.7.
So why did we build key rotation in AWS KMS in the first place?
Although we advise that key rotation for KMS keys is generally not necessary to improve the security of your keys, you must consider that guidance in the context of your own unique circumstances. You might be required by internal auditors, external compliance assessors, or even your own customers to provide evidence of regular rotation of all keys. A short list of regulatory and standards groups that recommend key rotation includes the aforementioned NIST 800-57, Center for Internet Security (CIS) benchmarks, ISO 27001, System and Organization Controls (SOC) 2, the Payment Card Industry Data Security Standard (PCI DSS), COBIT 5, HIPAA, and the Federal Financial Institutions Examination Council (FFIEC) Handbook, just to name a few.
Customers in regulated industries must consider the entirety of all the cryptographic systems used across their organizations. Taking inventory of which systems incorporate HSM protections, which systems do or don’t provide additional security against cryptographic wear-out, or which programs implement encryption in a robust and reliable way can be difficult for any organization. If a customer doesn’t have sufficient cryptographic expertise in the design and operation of each system, it becomes a safer choice to mandate a uniform scheduled key rotation.
That is why we offer an automatic, convenient method to rotate symmetric KMS keys. Rotation allows customers to demonstrate this key management best practice to their stakeholders instead of having to explain why they chose not to.
Figure 3 details how KMS appends new key material within an existing KMS key during each key rotation.
Figure 3: KMS key rotation process
We designed the rotation of symmetric KMS keys to have low operational impact to both key administrators and builders using those keys. As shown in Figure 3, a keyID configured to rotate will append new key material on each rotation while still retaining and keeping the existing key material of previous versions. This append method achieves rotation without having to decrypt and re-encrypt existing data that used a previous version of a key. New encryption requests under a given keyID will use the latest key version, while decrypt requests under that keyID will use the appropriate version. Callers don’t have to name the version of the key they want to use for encrypt/decrypt, AWS KMS manages this transparently.
Some customers assume that a key rotation event should forcibly re-encrypt any data that was ever encrypted under the previous key version. This is not necessary when AWS KMS automatically rotates to use a new key version for encrypt operations. The previous versions of keys required for decrypt operations are still safe within the service.
We’ve offered the ability to automatically schedule an annual key rotation event for many years now. Lately, we’ve heard from some of our customers that they need to rotate keys more frequently than the fixed period of one year. We will address our newly launched capabilities to help meet these needs in the final section of this blog post.
More options for key rotation in AWS KMS (with a price reduction)
After learning how we think about key rotation in AWS KMS, let’s get to the new options we’ve launched in this space:
Configurable rotation periods: Previously, when using automatic key rotation, your only option was a fixed annual rotation period. You can now set a rotation period from 90 days to 2,560 days (just over seven years). You can adjust this period at any point to reset the time in the future when rotation will take effect. Existing keys set for rotation will continue to rotate every year.
On-demand rotation for KMS keys: In addition to more flexible automatic key rotation, you can now invoke on-demand rotation through the AWS Management Console for AWS KMS, the AWS Command Line Interface (AWS CLI), or the AWS KMS API using the new RotateKeyOnDemand API. You might occasionally need to use on-demand rotation to test workloads, or to verify and prove key rotation events to internal or external stakeholders. Invoking an on-demand rotation won’t affect the timeline of any upcoming rotation scheduled for this key.
Note: We’ve set a default quota of 10 on-demand rotations for a KMS key. Although the need for on-demand key rotation should be infrequent, you can ask to have this quota raised. If you have a repeated need for testing or validating instant key rotation, consider deleting the test keys and repeating this operation for RotateKeyOnDemand on new keys.
Improved visibility: You can now use the AWS KMS console or the new ListKeyRotations API to view previous key rotation events. One of the challenges in the past is that it’s been hard to validate that your KMS keys have rotated. Now, every previous rotation for a KMS key that has had a scheduled or on-demand rotation is listed in the console and available via API.
Figure 4: Key rotation history showing date and type of rotation
Price cap for keys with more than two rotations: We’re also introducing a price cap for automatic key rotation. Previously, each annual rotation of a KMS key added $1 per month to the price of the key. Now, for KMS keys that you rotate automatically or on-demand, the first and second rotation of the key adds $1 per month in cost (prorated hourly), but this price increase is capped at the second rotation. Rotations after your second rotation aren’t billed. Existing customers that have keys with three or more annual rotations will see a price reduction for those keys to $3 per month (prorated) per key starting in the month of May, 2024.
Summary
In this post, I highlighted the more flexible options that are now available for key rotation in AWS KMS and took a broader look into why key rotation exists. We know that many customers have compliance needs to demonstrate key rotation everywhere, and increasingly, to demonstrate faster or immediate key rotation. With the new reduced pricing and more convenient ways to verify key rotation events, we hope these new capabilities make your job easier.
Flexible key rotation capabilities are now available in all AWS Regions, including the AWS GovCloud (US) Regions. To learn more about this new capability, see the Rotating AWS KMS keys topic in the AWS KMS Developer Guide.
If you have feedback about this post, submit comments in the Comments section below. If you have questions about this post, contact AWS Support.
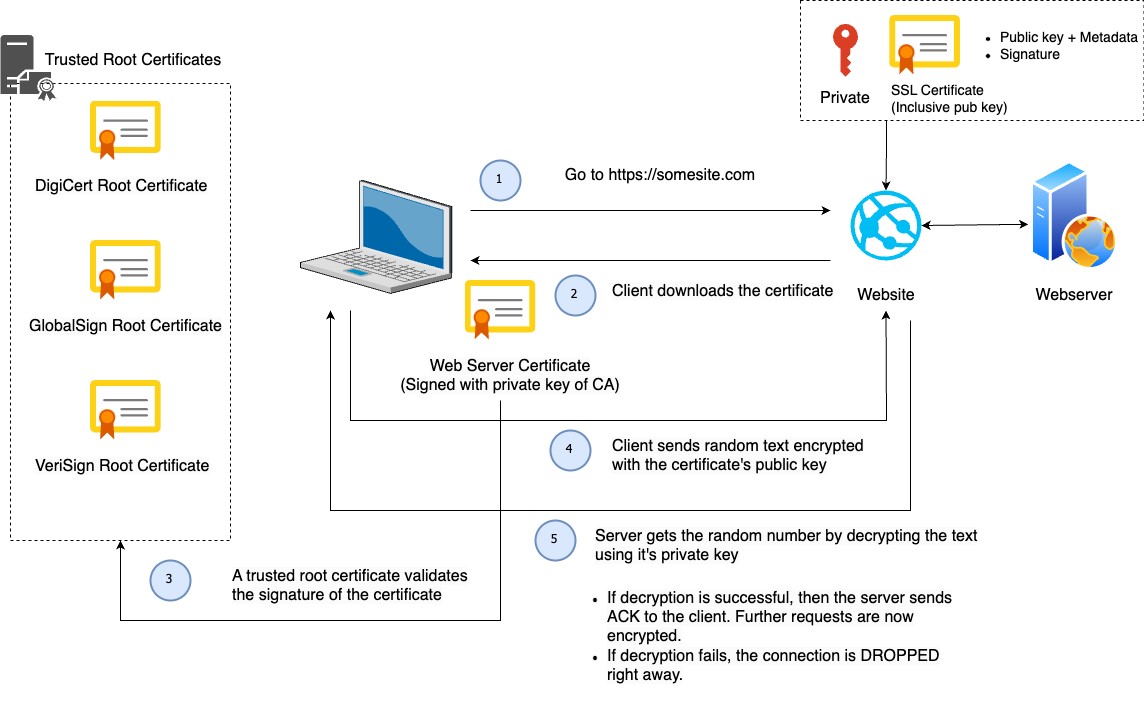
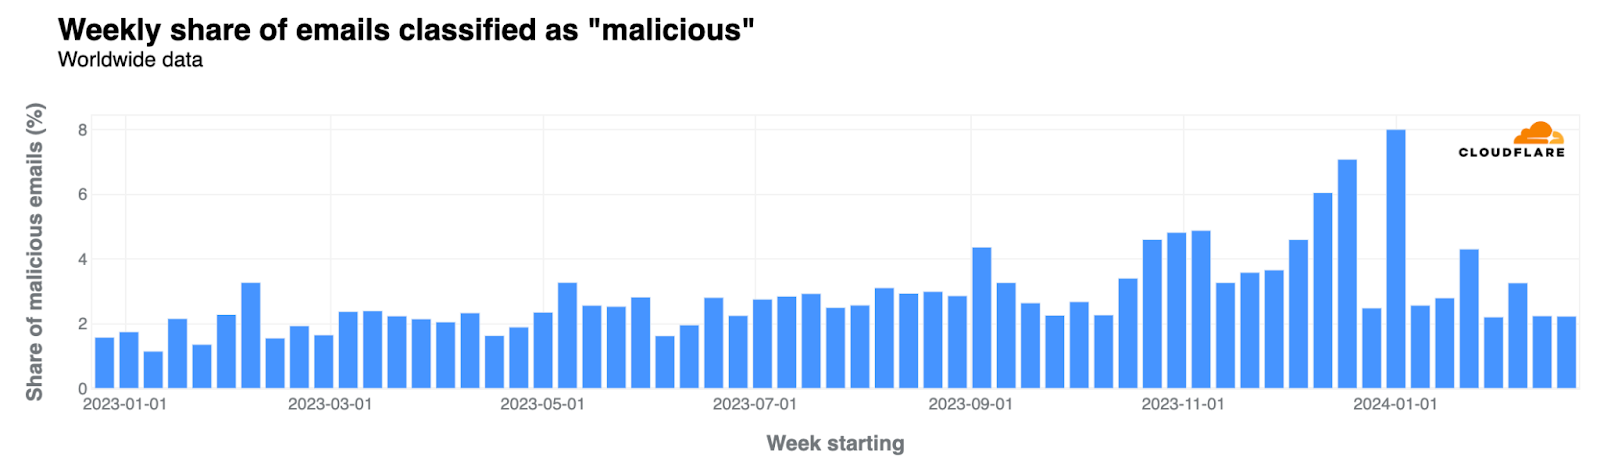
Let’s Encrypt, a publicly trusted certificate authority (CA) that Cloudflare uses to issue TLS certificates, has been relying on two distinct certificate chains. One is cross-signed with IdenTrust, a globally trusted CA that has been around since 2000, and the other is Let’s Encrypt’s own root CA, ISRG Root X1. Since Let’s Encrypt launched, ISRG Root X1 has been steadily gaining its own device compatibility.
On September 30, 2024, Let’s Encrypt’s certificate chain cross-signed with IdenTrust will expire. After the cross-sign expires, servers will no longer be able to serve certificates signed by the cross-signed chain. Instead, all Let’s Encrypt certificates will use the ISRG Root X1 CA.
Most devices and browser versions released after 2016 will not experience any issues as a result of the change since the ISRG Root X1 will already be installed in those clients’ trust stores. That’s because these modern browsers and operating systems were built to be agile and flexible, with upgradeable trust stores that can be updated to include new certificate authorities.
The change in the certificate chain will impact legacy devices and systems, such as devices running Android version 7.1.1 (released in 2016) or older, as those exclusively rely on the cross-signed chain and lack the ISRG X1 root in their trust store. These clients will encounter TLS errors or warnings when accessing domains secured by a Let’s Encrypt certificate. We took a look at the data ourselves and found that, of all Android requests, 2.96% of them come from devices that will be affected by the change. That’s a substantial portion of traffic that will lose access to the Internet. We’re committed to keeping those users online and will modify our certificate pipeline so that we can continue to serve users on older devices without requiring any manual modifications from our customers.
A better Internet, for everyone
In the past, we invested in efforts like “No Browsers Left Behind” to help ensure that we could continue to support clients as SHA-1 based algorithms were being deprecated. Now, we’re applying the same approach for the upcoming Let’s Encrypt change.
We have made the decision to remove Let’s Encrypt as a certificate authority from all flows where Cloudflare dictates the CA, impacting Universal SSL customers and those using SSL for SaaS with the “default CA” choice.
Starting in June 2024, one certificate lifecycle (90 days) before the cross-sign chain expires, we’ll begin migrating Let’s Encrypt certificates that are up for renewal to use a different CA, one that ensures compatibility with older devices affected by the change. That means that going forward, customers will only receive Let’s Encrypt certificates if they explicitly request Let’s Encrypt as the CA.
The change that Let’s Encrypt is making is a necessary one. For us to move forward in supporting new standards and protocols, we need to make the Public Key Infrastructure (PKI) ecosystem more agile. By retiring the cross-signed chain, Let’s Encrypt is pushing devices, browsers, and clients to support adaptable trust stores.
However, we’ve observed changes like this in the past and while they push the adoption of new standards, they disproportionately impact users in economically disadvantaged regions, where access to new technology is limited.
Our mission is to help build a better Internet and that means supporting users worldwide. We previously published a blog post about the Let’s Encrypt change, asking customers to switch their certificate authority if they expected any impact. However, determining the impact of the change is challenging. Error rates due to trust store incompatibility are primarily logged on clients, reducing the visibility that domain owners have. In addition, while there might be no requests incoming from incompatible devices today, it doesn’t guarantee uninterrupted access for a user tomorrow.
Cloudflare’s certificate pipeline has evolved over the years to be resilient and flexible, allowing us to seamlessly adapt to changes like this without any negative impact to our customers.
How Cloudflare has built a robust TLS certificate pipeline
Today, Cloudflare manages tens of millions of certificates on behalf of customers. For us, a successful pipeline means:
Customers can always obtain a TLS certificate for their domain
CA related issues have zero impact on our customer’s ability to obtain a certificate
The best security practices and modern standards are utilized
Optimizing for future scale
Supporting a wide range of clients and devices
Every year, we introduce new optimizations into our certificate pipeline to maintain the highest level of service. Here’s how we do it…
Ensuring customers can always obtain a TLS certificate for their domain
Since the launch of Universal SSL in 2014, Cloudflare has been responsible for issuing and serving a TLS certificate for every domain that’s protected by our network. That might seem trivial, but there are a few steps that have to successfully execute in order for a domain to receive a certificate:
Domain owners need to complete Domain Control Validation for every certificate issuance and renewal.
The certificate authority needs to verify the Domain Control Validation tokens to issue the certificate.
CAA records, which dictate which CAs can be used for a domain, need to be checked to ensure only authorized parties can issue the certificate.
The certificate authority must be available to issue the certificate.
Each of these steps requires coordination across a number of parties — domain owners, CDNs, and certificate authorities. At Cloudflare, we like to be in control when it comes to the success of our platform. That’s why we make it our job to ensure each of these steps can be successfully completed.
We ensure that every certificate issuance and renewal requires minimal effort from our customers. To get a certificate, a domain owner has to complete Domain Control Validation (DCV) to prove that it does in fact own the domain. Once the certificate request is initiated, the CA will return DCV tokens which the domain owner will need to place in a DNS record or an HTTP token. If you’re using Cloudflare as your DNS provider, Cloudflare completes DCV on your behalf by automatically placing the TXT token returned from the CA into your DNS records. Alternatively, if you use an external DNS provider, we offer the option to Delegate DCV to Cloudflare for automatic renewals without any customer intervention.
Once DCV tokens are placed, Certificate Authorities (CAs) verify them. CAs conduct this verification from multiple vantage points to prevent spoofing attempts. However, since these checks are done from multiple countries and ASNs (Autonomous Systems), they may trigger a Cloudflare WAF rule which can cause the DCV check to get blocked. We made sure to update our WAF and security engine to recognize that these requests are coming from a CA to ensure they’re never blocked so DCV can be successfully completed.
Some customers have CA preferences, due to internal requirements or compliance regulations. To prevent an unauthorized CA from issuing a certificate for a domain, the domain owner can create a Certification Authority Authorization (CAA) DNS record, specifying which CAs are allowed to issue a certificate for that domain. To ensure that customers can always obtain a certificate, we check the CAA records before requesting a certificate to know which CAs we should use. If the CAA records block all of the CAs that are available in Cloudflare’s pipeline and the customer has not uploaded a certificate from the CA of their choice, then we add CAA records on our customers’ behalf to ensure that they can get a certificate issued. Where we can, we optimize for preference. Otherwise, it’s our job to prevent an outage by ensuring that there’s always a TLS certificate available for the domain, even if it does not come from a preferred CA.
Today, Cloudflare is not a publicly trusted certificate authority, so we rely on the CAs that we use to be highly available. But, 100% uptime is an unrealistic expectation. Instead, our pipeline needs to be prepared in case our CAs become unavailable.
Ensuring that CA-related issues have zero impact on our customer’s ability to obtain a certificate
At Cloudflare, we like to think ahead, which means preventing incidents before they happen. It’s not uncommon for CAs to become unavailable — sometimes this happens because of an outage, but more commonly, CAs have maintenance periods every so often where they become unavailable for some period of time.
It’s our job to ensure CA redundancy, which is why we always have multiple CAs ready to issue a certificate, ensuring high availability at all times. If you’ve noticed different CAs issuing your Universal SSL certificates, that’s intentional. We evenly distribute the load across our CAs to avoid any single point of failure. Plus, we keep a close eye on latency and error rates to detect any issues and automatically switch to a different CA that’s available and performant. You may not know this, but one of our CAs has around 4 scheduled maintenance periods every month. When this happens, our automated systems kick in seamlessly, keeping everything running smoothly. This works so well that our internal teams don’t get paged anymore because everything just works.
Adopting best security practices and modern standards
Security has always been, and will continue to be, Cloudflare’s top priority, and so maintaining the highest security standards to safeguard our customer’s data and private keys is crucial.
Over the past decade, the CA/Browser Forum has advocated for reducing certificate lifetimes from 5 years to 90 days as the industry norm. This shift helps minimize the risk of a key compromise. When certificates are renewed every 90 days, their private keys remain valid for only that period, reducing the window of time that a bad actor can make use of the compromised material.
We fully embrace this change and have made 90 days the default certificate validity period. This enhances our security posture by ensuring regular key rotations, and has pushed us to develop tools like DCV Delegation that promote automation around frequent certificate renewals, without the added overhead. It’s what enables us to offer certificates with validity periods as low as two weeks, for customers that want to rotate their private keys at a high frequency without any concern that it will lead to certificate renewal failures.
Cloudflare has always been at the forefront of new protocols and standards. It’s no secret that when we support a new protocol, adoption skyrockets. This month, we will be adding ECDSA support for certificates issued from Google Trust Services. With ECDSA, you get the same level of security as RSA but with smaller keys. Smaller keys mean smaller certificates and less data passed around to establish a TLS connection, which results in quicker connections and faster loading times.
Optimizing for future scale
Today, Cloudflare issues almost 1 million certificates per day. With the recent shift towards shorter certificate lifetimes, we continue to improve our pipeline to be more robust. But even if our pipeline can handle the significant load, we still need to rely on our CAs to be able to scale with us. With every CA that we integrate, we instantly become one of their biggest consumers. We hold our CAs to high standards and push them to improve their infrastructure to scale. This doesn’t just benefit Cloudflare’s customers, but it helps the Internet by requiring CAs to handle higher volumes of issuance.
And now, with Let’s Encrypt shortening their chain of trust, we’re going to add an additional improvement to our pipeline — one that will ensure the best device compatibility for all.
Supporting all clients — legacy and modern
The upcoming Let’s Encrypt change will prevent legacy devices from making requests to domains or applications that are protected by a Let’s Encrypt certificate. We don’t want to cut off Internet access from any part of the world, which means that we’re going to continue to provide the best device compatibility to our customers, despite the change.
Because of all the recent enhancements, we are able to reduce our reliance on Let’s Encrypt without impacting the reliability or quality of service of our certificate pipeline. One certificate lifecycle (90 days) before the change, we are going to start shifting certificates to use a different CA, one that’s compatible with the devices that will be impacted. By doing this, we’ll mitigate any impact without any action required from our customers. The only customers that will continue to use Let’s Encrypt are ones that have specifically chosen Let’s Encrypt as the CA.
What to expect of the upcoming Let’s Encrypt change
Let’s Encrypt’s cross-signed chain will expire on September 30th, 2024. Although Let’s Encrypt plans to stop issuing certificates from this chain on June 6th, 2024, Cloudflare will continue to serve the cross-signed chain for all Let’s Encrypt certificates until September 9th, 2024.
90 days or one certificate lifecycle before the change, we are going to start shifting Let’s Encrypt certificates to use a different certificate authority. We’ll make this change for all products where Cloudflare is responsible for the CA selection, meaning this will be automatically done for customers using Universal SSL and SSL for SaaS with the “default CA” choice.
Any customers that have specifically chosen Let’s Encrypt as their CA will receive an email notification with a list of their Let’s Encrypt certificates and information on whether or not we’re seeing requests on those hostnames coming from legacy devices.
After September 9th, 2024, Cloudflare will serve all Let’s Encrypt certificates using the ISRG Root X1 chain. Here is what you should expect based on the certificate product that you’re using:
Universal SSL
With Universal SSL, Cloudflare chooses the CA that is used for the domain’s certificate. This gives us the power to choose the best certificate for our customers. If you are using Universal SSL, there are no changes for you to make to prepare for this change. Cloudflare will automatically shift your certificate to use a more compatible CA.
Advanced Certificates
With Advanced Certificate Manager, customers specifically choose which CA they want to use. If Let’s Encrypt was specifically chosen as the CA for a certificate, we will respect the choice, because customers may have specifically chosen this CA due to internal requirements, or because they have implemented certificate pinning, which we highly discourage.
If we see that a domain using an Advanced certificate issued from Let’s Encrypt will be impacted by the change, then we will send out email notifications to inform those customers which certificates are using Let’s Encrypt as their CA and whether or not those domains are receiving requests from clients that will be impacted by the change. Customers will be responsible for changing the CA to another provider, if they chose to do so.
SSL for SaaS
With SSL for SaaS, customers have two options: using a default CA, meaning Cloudflare will choose the issuing authority, or specifying which CA to use.
If you’re leaving the CA choice up to Cloudflare, then we will automatically use a CA with higher device compatibility.
If you’re specifying a certain CA for your custom hostnames, then we will respect that choice. We will send an email out to SaaS providers and platforms to inform them which custom hostnames are receiving requests from legacy devices. Customers will be responsible for changing the CA to another provider, if they chose to do so.
Custom Certificates
If you directly integrate with Let’s Encrypt and use Custom Certificates to upload your Let’s Encrypt certs to Cloudflare then your certificates will be bundled with the cross-signed chain, as long as you choose the bundle method “compatible” or “modern” and upload those certificates before September 9th, 2024. After September 9th, we will bundle all Let’s Encrypt certificates with the ISRG Root X1 chain. With the “user-defined” bundle method, we always serve the chain that’s uploaded to Cloudflare. If you upload Let’s Encrypt certificates using this method, you will need to ensure that certificates uploaded after September 30th, 2024, the date of the CA expiration, contain the right certificate chain.
In addition, if you control the clients that are connecting to your application, we recommend updating the trust store to include the ISRG Root X1. If you use certificate pinning, remove or update your pin. In general, we discourage all customers from pinning their certificates, as this usually leads to issues during certificate renewals or CA changes.
Conclusion
Internet standards will continue to evolve and improve. As we support and embrace those changes, we also need to recognize that it’s our responsibility to keep users online and to maintain Internet access in the parts of the world where new technology is not readily available. By using Cloudflare, you always have the option to choose the setup that’s best for your application.
For additional information regarding the change, please refer to our developer documentation.
Internet security and reliability has become deeply personal. This holds true for many of us, but especially those who work with vulnerable communities, political dissidents, journalists in authoritarian nations, or human rights advocates. The threats they face, both in the physical world and online, are steadily increasing.
At Cloudflare, our mission is to help build a better Internet. With many of our Impact projects, which protect a range of vulnerable voices from civil society, journalists, state and local governments that run elections, political campaigns, political parties, community networks, and more, we’ve learned how to keep these important groups secure online. But, we can’t do it alone. Collaboration and sharing of best practices with multiple stakeholders to get the right tools into the groups that need them is essential in democratizing access to powerful security tools.
Civil society has historically been the voice for sharing information about attacks that target vulnerable communities, both online and offline. In the last few years, we see governments increasingly appreciating how cyberattacks affect vulnerable voices and make an effort to identify the risks to these communities, and the resources available to protect them.
In March 2023, the US government launched the Summit for Democracy co-hosted by Costa Rica, Zambia, the Netherlands, and South Korea. We’ve written about our work at the summit and commitments on a wide range of actions to help advance human rights online. We were also proud to be included in US Agency for International Development’s (USAID) announcement, as part of the second summit in South Korea in March 2024, as a potential technology partner for the Advancing Digital Democracy Academy initiative, which will offer skills training in cybersecurity, cloud computing, responsible AI to support governments, civil society organizations, and other vulnerable groups.
With multistakeholder collaboration a growing effort, we want to give you insight into our ongoing efforts with the US Cybersecurity and Infrastructure Security Agency through the Joint Cyber Defense Collaborative (JCDC) to work together to raise awareness about threats to civil society, best practices that groups can use to protect themselves online today, and new resources developed for these vulnerable communities.
What types of threats do civil society organizations face?
Civil society organizations, which include non-governmental organizations, community-based organizations, and advocacy groups, face a wide range of threats and challenges that can vary depending on their location, focus areas, and activities. These threats can come from various sources, offline and online, from governments, non-state actors, and external influences.
Since our founding, we’ve provided a set of free services based on the idea that democratizing access to cybersecurity products makes the Internet safer and faster for a broader audience. Since 2014, we’ve continued to strengthen this idea with Project Galileo, providing a higher level of protection to vulnerable voices. Fast forward to 2024, and we now protect more than 2,600 organizations in 111 countries under Project Galileo, allowing us to gain a better understanding of threats these organizations face on a daily basis. In June 2023, we published a report showing that between July 1, 2022, and May 5, 2023, Cloudflare mitigated 20 billion attacks against organizations protected under the project, an average of nearly 67.7 million cyber attacks per day over the 10 month period.
We continue to learn more about cyberattacks against these groups and how to better equip them with the tools they need to stay online. Our Q2 2023 DDoS report, for example, noted that 17.6% of all traffic to nonprofits was DDoS traffic, and that nonprofits were the second most targeted sector for DDoS. In addition, we see prominent civil society organizations, like our partner the International Press Institute, fall victim to a cyber attack after releasing a report identifying multiple DDoS attacks against many independent media outlets in Hungary over a five month period.
What do these attacks look like for a civil society organization?
It is easy to provide overall statistics on the number of cyber attacks we see against organizations under Project Galileo. But that doesn’t provide the whole story on what attacks look like in practice or how organizations can defend against them in real time.
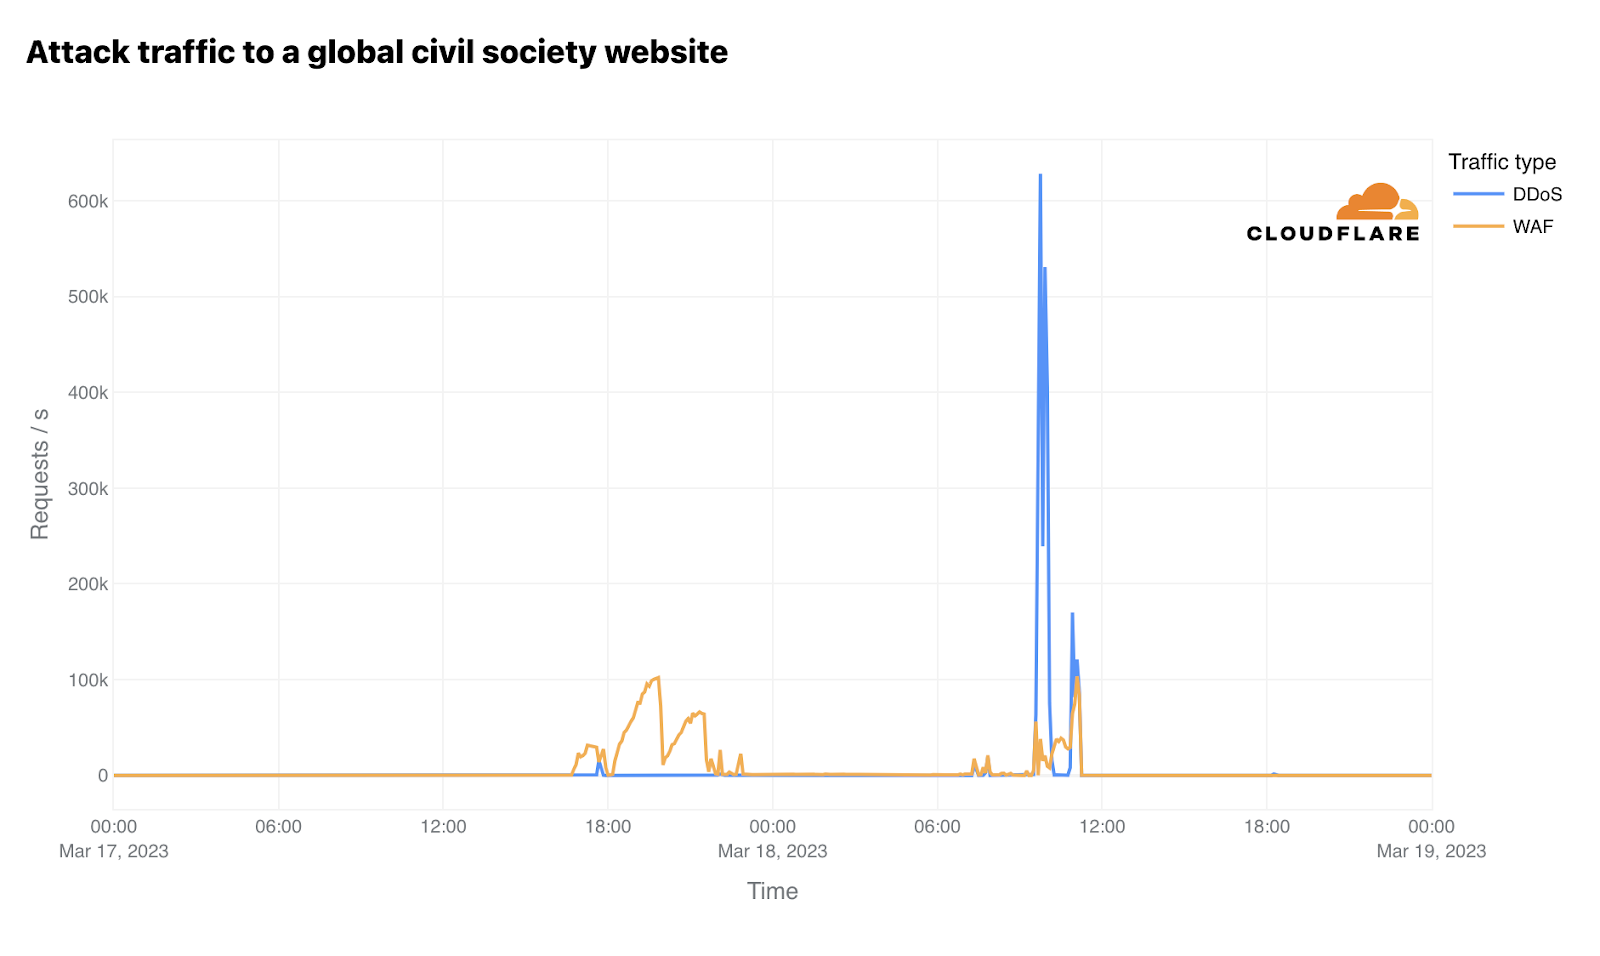
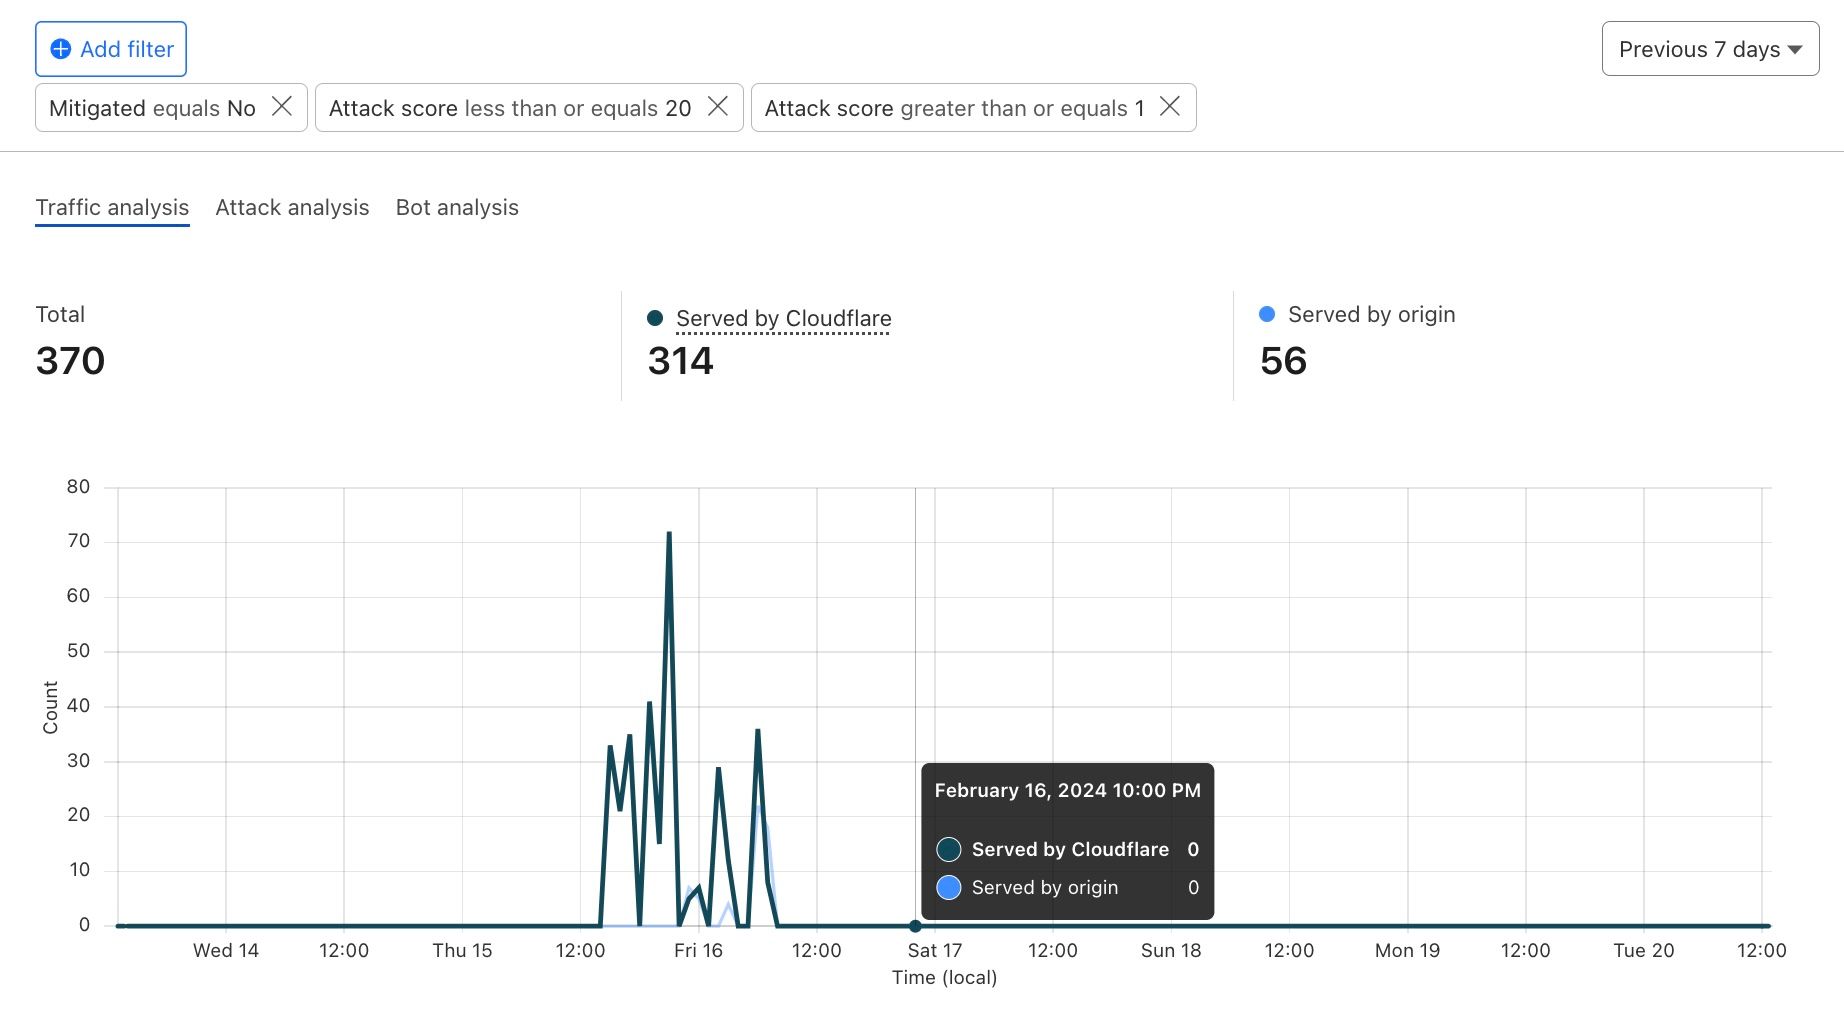
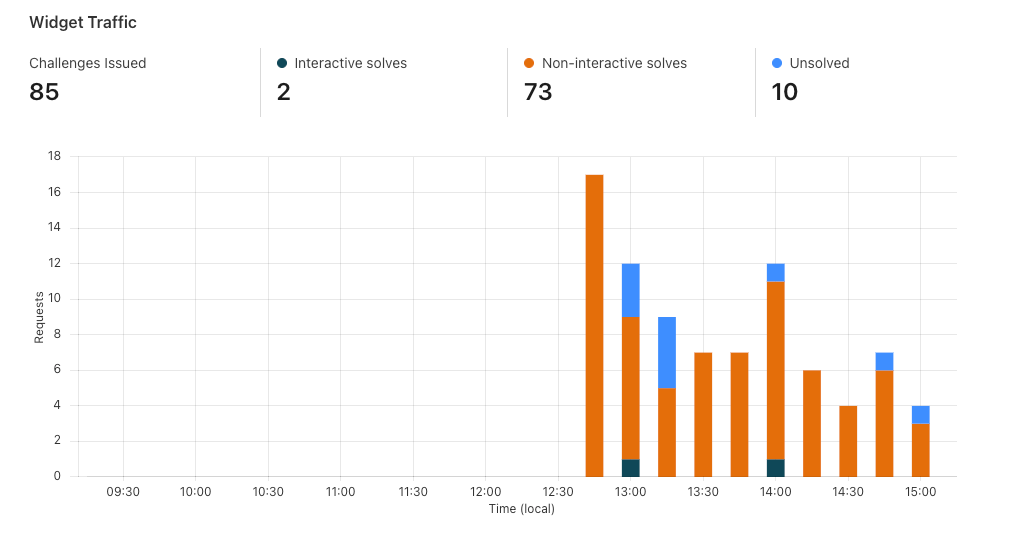
When we were developing our Radar dashboard for the 9th anniversary of Project Galileo, we came across a noteworthy incident that involved an organization reporting on international legal issues, which highlights the importance of having security measures in place, even for organizations that do not believe they are a target. This event occurred between March 17 and March 18, 2023. On March 17, an international arrest warrant was issued for Russian President Vladimir Putin and Russian official Maria Lvova-Belova in connection with an alleged plot to relocate Ukrainian children to Russia.
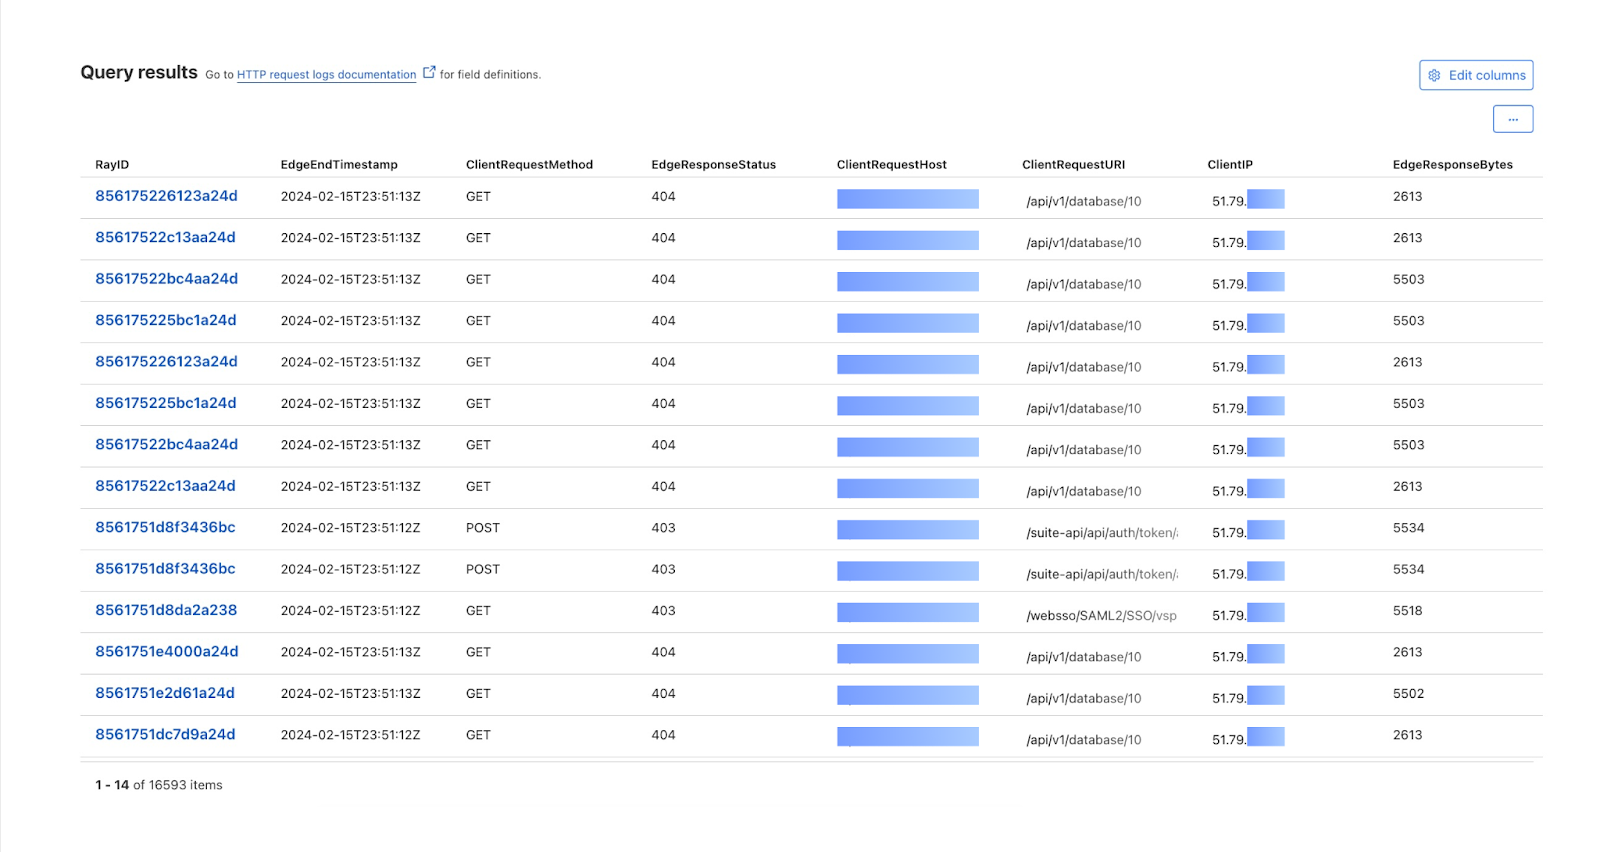
Before and after this incident, the organization’s website experienced low levels of traffic. However, on March 17, we observed a sudden surge in request traffic, escalating from under 1,000 requests per second to approximately 100,000 requests per second within a four-hour window, reaching its peak at 19:00 UTC. Fortunately, the majority of this traffic was effectively managed by our Web Application Firewall. Another notable spike occurred on March 18, with the peak occurring at 09:45 UTC, surpassing 667,000 requests per second. Almost all of these requests were identified as Distributed Denial of Service (DDoS) attacks, as illustrated in the chart above. Throughout March 18, Cloudflare successfully thwarted a total of 844.4 million requests categorized as application layer DDoS attacks.
This incident highlights a recurring theme that we encounter within Project Galileo. Many organizations may remain unaware of their vulnerability to cyberattacks until their website is targeted by a disruptive DDoS attack. In this instance, the organization maintained its online presence throughout the entire attack, likely only discovering the abnormal surge in traffic after the attack had subsided.
This is just one example of an attack targeting an organization under Project Galileo, but they happen every day. But don’t just take it from us, check out more stories from organizations on how they stay secure online.
Collaborating with CISA through the Joint Cyber Defense Collaborative to identify how to get our services to more vulnerable communities
One of the ways we expand our protections with Project Galileo is through partnerships and collaborations. We currently work with more than 50 civil society organizations who approve organizations for protection under Project Galileo. The role of our civil society partners is essential as they have the knowledge and expertise around organizations that need these types of services.
When JCDC reached out to us about an initiative focused on protecting vulnerable communities online, we were excited to help make resources more accessible from a trusted voice. As governments increasingly identify the need for cybersecurity services for vulnerable communities, they have the ability to make these resources accessible and bring together multiple stakeholders to help promote best security practices. With JCDC, we are collaborating on three working groups to cover a range of topics that include crowdsourcing resources available for at-risk communities, developing new resources for these groups, cyber volunteer programs from companies and civil society, information sharing and development of threat reports and more.
With a range of stakeholders including civil society, tech companies, and CISA, we’ve been able to identify opportunities to build capacity and transparency strategies when it comes to extending products to these communities. We hope that other governments can see these efforts on providing protections to vulnerable communities as a model for effective collaboration.
What are steps you can take right now to ensure your organization’s website and internal teams are protected?
As part of our working groups with JCDC, we focused on enhancing the baseline of cyber hygiene for civil society organizations and improving resilience and response capabilities in the face of a cyberattack. We put together a list of tools and resources that are available for much of these groups that include:
Cloudlare’s Social Impact portal to help organizations navigate how to keep their website secure on Cloudflare.
Zero Trust Security for vulnerable communities:In this roadmap, created by Cloudflare, intended for civil society and at-risk organizations, we hope to demystify the work of Zero Trust security and offer easy to follow steps to boost your cyber security efforts in your organization. This roadmap includes a range of Cloudflare’s security products with case studies for civil society, level of effort to implement, and the teams involved to make the complex world of cyber security more accessible and understandable to a wider audience.
Cloudflare Radar and the Outage Center to track Internet shutdowns: In addition to the route leaks and route hijacks insights, we have Radar notification functionality, enabling organizations to subscribe to notifications about traffic anomalies, confirmed Internet outages, route leaks, or route hijacks.
JCDC’s CISA Awareness site: CISA—through JCDC—has compiled a list of cybersecurity resources intended to help high-risk communities who are at heightened risk of being targeted by cyber threat actors because of their identity or work.
To the future
There is still a lot of work to be done when it comes to protecting vulnerable voices. We hope that by collaborating with a range of stakeholders from governments, civil society, and tech companies we can better share tools and expertise to help these communities navigate the complex digital environments we find ourselves in. We remain committed to this crucial mission in the years to come and look forward to creating more partnerships to expand our products into new areas. If you are an organization looking for protection under Project Galileo, please visit our website: cloudflare.com/galileo.
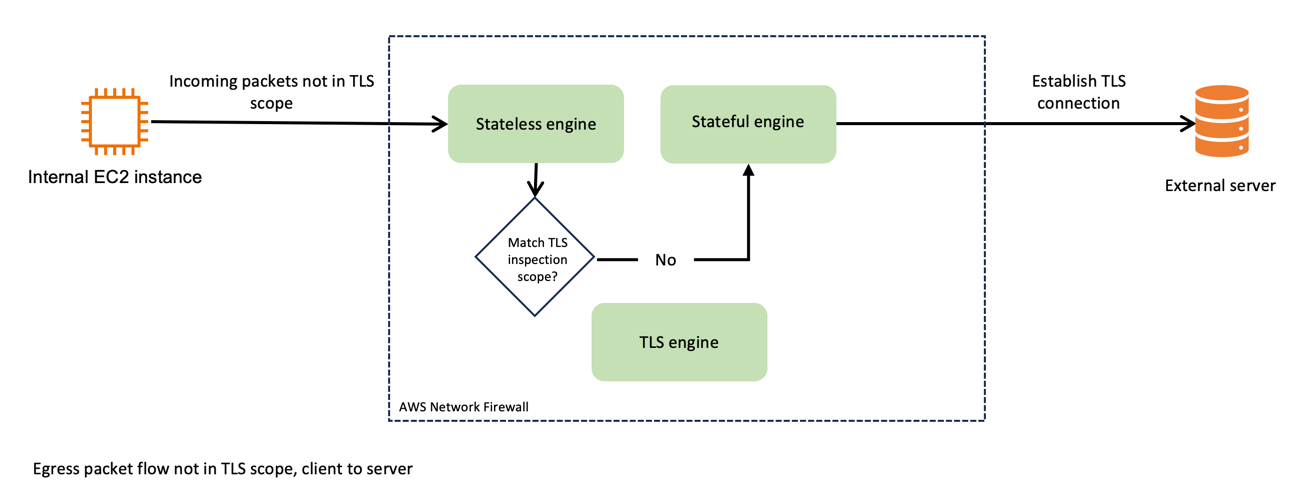
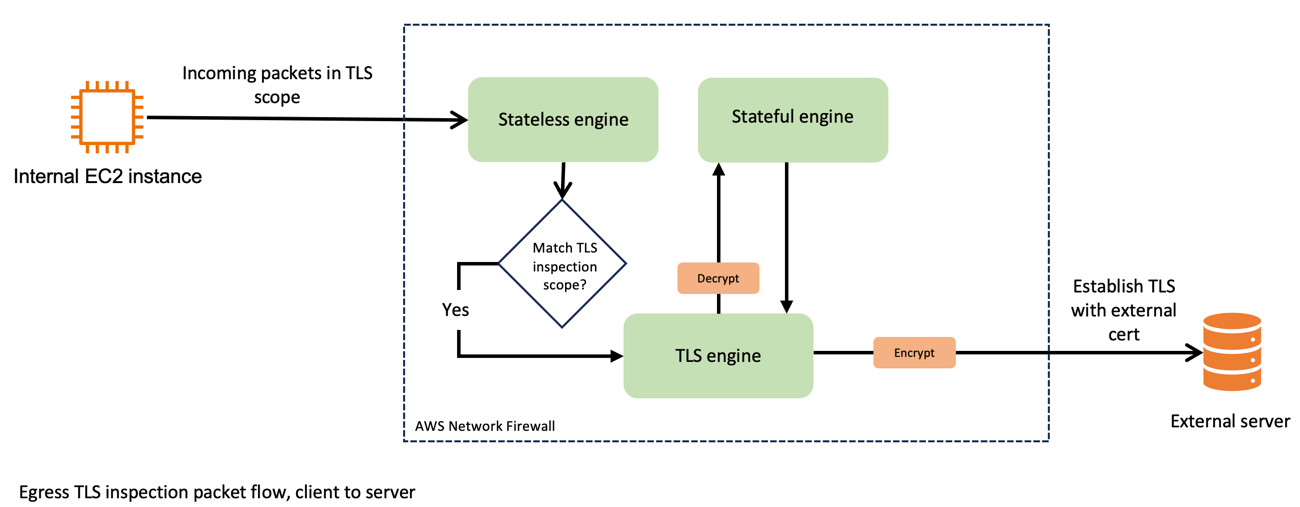
In the evolving landscape of network security, safeguarding data as it exits your virtual environment is as crucial as protecting incoming traffic. In a previous post, we highlighted the significance of ingress TLS inspection in enhancing security within Amazon Web Services (AWS) environments. Building on that foundation, I focus on egress TLS inspection in this post.
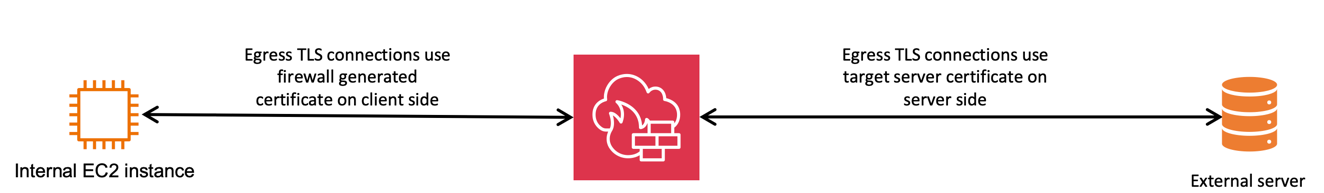
Egress TLS decryption, a pivotal feature of AWS Network Firewall, offers a robust mechanism to decrypt, inspect the payload, and re-encrypt outbound SSL/TLS traffic. This process helps ensure that your sensitive data remains secure and aligned with your organizational policies as it traverses to external destinations. Whether you’re a seasoned AWS user or new to cloud security, understanding and implementing egress TLS inspection can bolster your security posture by helping you identify threats within encrypted communications.
In this post, we explore the setup of egress TLS inspection within Network Firewall. The discussion covers the key steps for configuration, highlights essential best practices, and delves into important considerations for maintaining both performance and security. By the end of this post, you will understand the role and implementation of egress TLS inspection, and be able to integrate this feature into your network security strategy.
Overview of egress TLS inspection
Egress TLS inspection is a critical component of network security because it helps you identify and mitigate risks that are hidden in encrypted traffic, such as data exfiltration or outbound communication with malicious sites (for example command and control servers). It involves the careful examination of outbound encrypted traffic to help ensure that data leaving your network aligns with security policies and doesn’t contain potential threats or sensitive information.
This process helps ensure that the confidentiality and integrity of your data are maintained while providing the visibility that you need for security analysis.
Figure 1 depicts the traffic flow of egress packets that don’t match the TLS inspection scope. Incoming packets that aren’t in scope of the TLS inspection pass through the stateless engine, and then the stateful engine, before being forwarded to the destination server. Because it isn’t within the scope for TLS inspection, the packet isn’t sent to the TLS engine.
Figure 1: Network Firewall packet handling, not in TLS scope
Now, compare that to Figure 2, which shows the traffic flow when egress TLS inspection is enabled. After passing through the stateless engine, traffic matches the TLS inspection scope. Network Firewall forwards the packet to the TLS engine, where it’s decrypted. Network Firewall passes the decrypted traffic to the stateful engine, where it’s inspected and passed back to the TLS engine for re-encryption. Network Firewall then forwards the packet to its destination.
Figure 2: Network Firewall packet handling, in TLS scope
Now consider the use of certificates for these connections. As shown in Figure 3, the egress TLS connections use a firewall-generated certificate on the client side and the target servers’ certificate on the server side. Network Firewall decrypts the packets that are internal to the firewall process and processes them in clear text through the stateful engine.
Figure 3: Egress TLS certificate usage
By implementing egress TLS inspection, you gain a more comprehensive view of your network traffic, so you can monitor and manage data flows more effectively. This enhanced visibility is crucial in detecting and responding to potential security threats that might otherwise remain hidden in encrypted traffic.
In the following sections, I guide you through the configuration of egress TLS inspection, discuss best practices, and highlight key considerations to help achieve a balance between robust security and optimal network performance.
Additional consideration: the challenge of SNI spoofing
Server Name Indication (SNI) spoofing can affect how well your TLS inspection works. SNI is a component of the TLS protocol that allows a client to specify which server it’s trying to connect to at the start of the handshake process.
SNI spoofing occurs when an entity manipulates the SNI field to disguise the true destination of the traffic. This is similar to requesting access to one site while intending to connect to a different, less secure site. SNI spoofing can pose significant challenges to network security measures, particularly those that rely on SNI information for traffic filtering and inspection.
In the context of egress TLS inspection, a threat actor can use SNI spoofing to circumvent security tools because these tools often use the SNI field to determine the legitimacy and safety of outbound connections. If the threat actor spoofs the SNI field successfully, unauthorized traffic could pass through the network, circumventing detection.
To effectively counteract SNI spoofing, use TLS inspection on Network Firewall. When you use TLS inspection on Network Firewall, spoofed SNIs on traffic within the scope of what TLS inspection looks at are dropped. The spoofed SNI traffic is dropped because Network Firewall validates the TLS server certificate to check the associated domains in it against the SNI.
Set up egress TLS inspection in Network Firewall
In this section, I guide you through the essential steps to set up egress TLS inspection in Network Firewall.
Prerequisites
The example used in this post uses a prebuilt environment. To learn more about the prebuilt environment and how to build a similar configuration in your own AWS environment, see Creating a TLS inspection configuration in Network Firewall. To follow along with this post, you will need a working topology with Network Firewall deployed and an Amazon Elastic Compute Cloud (Amazon EC2) instance deployed in a private subnet.
Additionally, you need to have a certificate generated that you will present to your clients when they make outbound TLS requests that match your inspection configuration. After you generate your certificate, note the certificate body, private key, and certificate chain because you will import these into ACM.
Obtain a certificate authority (CA) signed certificate, private key, and certificate chain.
Open the ACM console, and in the left navigation pane, choose Certificates.
Choose Import certificates.
In the Certificate details section, paste your certificate’s information, including the certificate body, certificate private key, and certificate chain, into the relevant fields.
Choose Next.
On the Add Tags page, add a tag to your certificate:
Note: It might take a few minutes for ACM to process the import request and show the certificate in the list. If the certificate doesn’t immediately appear, choose the refresh icon. Additionally, the Certificate Authority used to create the certificate you import to ACM can be public or private.
Review the imported certificate and do the following:
Note the Certificate ID. You will need this ID later when you assign the certificate to the TLS configuration.
Make sure that the status shows Issued. After ACM issues the certificate, you can use it in the TLS configuration.
Figure 4: Verify the certificate was issued in ACM
Create a TLS inspection configuration
The next step is to create a TLS inspection configuration. You will do this in two parts. First, you will create a rule group to define the stateful inspection criteria. Then you will create the TLS inspection configuration where you define what traffic you should decrypt for inspection and how you should handle revoked and expired certificates.
To create a rule group
Navigate to VPC > Network Firewall rule groups.
Choose Create rule group.
On the Choose rule group type page, do the following:
For Rule group type, select Stateful rule group. In this example, the stateless rule group that has already been created is being used.
For Rule group format, select Suricata compatible rule string.
Leave the other values as default and choose Next.
On the Describe rule group page, enter a name, description, and capacity for your rule group, and then choose Next.
Note: The capacity is the number of rules that you expect to have in this rule group. In our example, I set the value to 10, which is appropriate for a demo environment. Production environments require additional thought to the capacity before you create the rule group.
On the Configure rules page, in the Suricata compatible rule string section, enter your Suricata compatible rules line-by-line, and then choose Next.
On the Configure advanced settings – optional page, choose Next. You won’t use these settings in this walkthrough.
Add relevant tags by providing a key and a value for your tag, and then choose Next.
On the Review and create page, review your rule group and then choose Create rule group.
To create the TLS inspection configuration
Navigate to VPC > Network Firewall > TLS inspection configurations.
Choose Create TLS inspection configuration.
In the CA certificate for outbound SSL/TLS inspection – new section, from the dropdown menu, choose the certificate that you imported from ACM previously, and then choose Next.
Figure 5: Select the certificate for use with outbound SSL/TLS inspection
On the Describe TLS inspection configuration page, enter a name and description for the configuration, and then choose Next.
Define the scope—the traffic to include in decryption. For this walkthrough, you decrypt traffic that is on port 443. On the Define scope page, do the following:
For the Destination port range, in the dropdown, select Custom and then in the box, enter your port (in this example, 443). This is shown in Figure 6.
Figure 6: Specify a custom destination port in the TLS scope configuration
Choose Add scope configuration to add the scope configuration. This allows you to add multiple scopes. In this example, you have defined a scope indicating that the following traffic should be decrypted:
Source IP
Source Port
Destination IP
Destination Port
Any
Any
Any
443
In the Scope configuration section, verify that the scope is listed, as seen in Figure 7, and then choose Next.
Figure 7: Add the scope configuration to the SSL/TLS inspection policy
On the Advanced settings page, do the following to determine how to handle certificate revocation:
For Check certificate revocation status, select Enable.
In the Revoked – Action dropdown, select an action for revoked certificates. Your options are to Drop, Reject, or Pass. A drop occurs silently. A reject causes a TCP reset to be sent, indicating that the connection was dropped. Selecting pass allows the connection to establish.
In the Unknown status – Action section, select an action for certificates that have an unknown status. The same three options that are available for revoked certificates are also available for certificates with an unknown status.
Choose Next.
Note: The recommended best practice is to set the action to Reject for both revoked and unknown status. Later in this walkthrough, you will set these values to Drop and Allow to illustrate the behavior during testing. After testing, you should set both values to Reject.
Add relevant tags by providing a key and value for your tag, and then choose Next.
Review the configuration, and then choose Create TLS inspection configuration.
Add the configuration to a Network Firewall policy
The next step is to add your TLS inspection configuration to your firewall policy. This policy dictates how Network Firewall handles and applies the rules for your outbound traffic. As part of this configuration, your TLS inspection configuration defines what traffic is decrypted prior to inspection.
To add the configuration to a Network Firewall policy
Navigate to VPC > Network Firewall > Firewall policies.
Choose Create firewall policy.
In the Firewall policy details section, seen in Figure 8, enter a name and description, select a stream exception option for the policy, and then choose Next.
Figure 8: Define the firewall policy details
To attach a stateless rule group to the policy, choose Add stateless rule groups.
Select an existing policy, seen in Figure 9, and then choose Add rule groups.
Figure 9: Select a stateless policy from an existing rule group
In the Stateful rule group section, choose Add stateful rule groups.
Select the newly created TLS inspection rule group, and then choose Add rule group.
On the Add rule groups page, choose Next.
On the Configure advanced settings – optional page, choose Next. For this walkthrough, you will leave these settings at their default values.
On the Add TLS inspection configuration – optional section, seen in Figure 10, do the following:
Choose Add TLS inspection configuration.
From the dropdown, select your TLS inspection configuration.
Choose Next.
Figure 10: Add the TLS configuration to the firewall policy
Add relevant tags by providing a key and a value, and then choose Next.
Review the policy configuration, and choose Create firewall policy.
Associate the policy with your firewall
The final step is to associate this firewall policy, which includes your TLS inspection configuration, with your firewall. This association activates the egress TLS inspection, enforcing your defined rules and criteria on outbound traffic. When the policy is associated, packets from the existing stateful connections that match the TLS scope definition are immediately routed to the decryption engine where they are dropped. This occurs because decryption and encryption can only work for a connection when Network Firewall receives TCP and TLS handshake packets from the start.
Currently, you have an existing policy applied. Let’s briefly review the policy that exists and see how TLS traffic looks prior to applying your configuration. Then you will apply the TLS configuration and look at the difference.
To review the existing policy that doesn’t have TLS configuration
Navigate to VPC > Network Firewall > Firewalls
Choose the existing firewall, as seen in Figure 11.
Figure 11: Select the firewall to edit the policy
In the Firewall Policy section, make sure that your firewall policy is displayed. As shown in the example in Figure 12, the firewall policy DemoFirewallPolicy is applied—this policy doesn’t perform TLS inspection.
Figure 12: Identify the existing firewall policy associated with the firewall
From a test EC2 instance, navigate to an external site that requires TLS encryption. In this example, I use the site example.com. Examine the certificate that was issued. In this example, an external organization issued the certificate (it’s not the certificate that I imported into ACM). You can see this in Figure 13.
Figure 13: View of the certificate before TLS inspection is applied
Returning to the firewall configuration, change the policy to the one that you created with TLS inspection.
To change to the policy with TLS inspection
In the Firewall Policy section, choose Edit.
In the Edit firewall policy section, select the TLS Inspection policy, and then choose Save changes.
Note: It might take a moment for Network Firewall to update the firewall configuration.
Figure 14: Modify the policy applied to the firewall
Return to the test EC2 instance and test the site again. Notice that your customer certificate authority (CA) has issued the certificate. This indicates that the configuration is working as expected and you can see this in Figure 15.
Note: The test EC2 instance must trust the certificate that Network Firewall presents. The method to install the CA certificate on your host devices will vary based on the operating system. For this walkthrough, I installed the CA certificate before testing.
Figure 15: Verify the new certificate used by Network Firewall TLS inspection is seen
Another test that you can do is revoked certificate handling. Example.com provides URLs to sites with revoked or expired certificates that you can use to test.
To test revoked certificate handling
From the command line interface (CLI) of the EC2 instance, do a curl on this page.
Note: The curl -ikv command combines three options:
-i includes the HTTP response headers in the output
-k allows connections to SSL sites without certificates being validated
-v enables verbose mode, which displays detailed information about the request and response, including the full HTTP conversation. This is useful for debugging HTTPS connections.
The output should show that an error 104, Connection reset by peer, was sent.
*   Trying 203.0.113.10:443...
* Connected to revoked-rsa-dv.example.com (203.0.113.10) port 443
* ALPN: curl offers h2,http/1.1
* Cipher selection: ALL:!EXPORT:!EXPORT40:!EXPORT56:!aNULL:!LOW:!RC4:@STRENGTH
* TLSv1.2 (OUT), TLS handshake, Client hello (1):
* TLSv1.2 (IN), TLS handshake, Server hello (2):
* TLSv1.2 (IN), TLS handshake, Certificate (11):
* TLSv1.2 (IN), TLS handshake, Server key exchange (12):
* TLSv1.2 (IN), TLS handshake, Server finished (14):
* TLSv1.2 (OUT), TLS handshake, Client key exchange (16):
* TLSv1.2 (OUT), TLS change cipher, Change cipher spec (1):
* TLSv1.2 (OUT), TLS handshake, Finished (20):
* TLSv1.2 (IN), TLS change cipher, Change cipher spec (1):
* TLSv1.2 (IN), TLS handshake, Finished (20):
* SSL connection using TLSv1.2 / ECDHE-RSA-AES256-GCM-SHA384
* ALPN: server did not agree on a protocol. Uses default.
* Server certificate:
*  subject: CN=revoked-rsa-dv.example.com
*  start date: Feb 20 21:17:23 2024 GMT
*  expire date: Feb 19 21:17:23 2025 GMT
*  issuer: C=US; ST=VA; O=Custom Org; OU=Custom Unit; CN=Custom Intermediate CA; [email protected]
*  SSL certificate verify result: unable to get local issuer certificate (20), continuing anyway.
* using HTTP/1.x
> GET /?_gl=1*guvyqo*_gcl_au*MTczMzQyNzU3OC4xNzA4NTQ5OTgw HTTP/1.1
> Host: revoked-rsa-dv.example.com
> User-Agent: curl/8.3.0
> Accept: */*
>
* Recv failure: Connection reset by peer
* OpenSSL SSL_read: Connection reset by peer, errno 104
* Closing connection
* Send failure: Broken pipe
curl: (56) Recv failure: Connection reset by peer
sh-4.2$
As you configure egress TLS inspection, consider the specific types of traffic and the security requirements of your organization. By tailoring your configuration to these needs, you can help make your network’s security more robust, without adversely affecting performance.
Performance and security considerations for egress TLS inspection
Implementing egress TLS inspection in Network Firewall is an important step in securing your network, but it’s equally important to understand its impact on performance and security. Here are some key considerations:
Balance security and performance – Egress TLS inspection provides enhanced security by allowing you to monitor and control outbound encrypted traffic, but it can introduce additional processing overhead. It’s essential to balance the depth of inspection with the performance requirements of your network. Efficient rule configuration can help minimize performance impacts while still achieving the desired level of security.
Optimize rule sets – The effectiveness of egress TLS inspection largely depends on the rule sets that you configure. It’s important to optimize these rules to target specific security concerns relevant to your outbound traffic. Overly broad or complex rules can lead to unnecessary processing, which might affect network throughput.
Use monitoring and logging – Regular monitoring and logging are vital for maintaining the effectiveness of egress TLS inspection. They help in identifying potential security threats and also provide insights into the impact of TLS inspection on network performance. AWS provides tools and services that you can use to monitor the performance and security of your network firewall.
Considering these factors will help ensure that your use of egress TLS inspection strengthens your network’s security posture and aligns with your organization’s performance needs.
Best practices and recommendations for egress TLS inspection
Implementing egress TLS inspection requires a thoughtful approach. Here are some best practices and recommendations to help you make the most of this feature in Network Firewall:
Prioritize traffic for inspection – You might not need the same level of scrutiny for all your outbound traffic. Prioritize traffic based on sensitivity and risk. For example, traffic to known, trusted destinations might not need as stringent inspection as traffic to unknown or less secure sites.
Use managed rule groups wisely – AWS provides managed rule groups and regularly updates them to address emerging threats. You can use AWS managed rules with TLS decryption; however, the TLS keywords will no longer invoke for traffic that has been decrypted by the firewall, within the stateful inspection engine. You can still benefit from the non-TLS rules within managed rule groups, and gain increased visibility into those rules because the decrypted traffic is visible to the inspection engine. You can also create your own custom rules against the inner protocols that are now available for inspection—for example, matching against an HTTP header within the decrypted HTTPS stream. You can use managed rules to complement your custom rules, contributing to a robust and up-to-date security posture.
Regularly update custom rules – Keep your custom rule sets aligned with the evolving security landscape. Regularly review and update these rules to make sure that they address new threats and do not inadvertently block legitimate traffic.
Test configuration changes – Before you apply new rules or configurations in a production environment, test them in a controlled setting. This practice can help you identify potential issues that could impact network performance or security.
Monitor and analyze traffic patterns – Regular monitoring of outbound traffic patterns can provide valuable insights. Use AWS tools to analyze traffic logs, which can help you fine-tune your TLS inspection settings and rules for optimal performance and security.
Plan for scalability – As your network grows, make sure that your TLS inspection setup can scale accordingly. Consider the impact of increased traffic on performance and adjust your configurations to maintain efficiency.
Train your team – Make sure that your network and security teams are well informed about the TLS inspection process, including its benefits and implications. A well-informed team can better manage and respond to security events.
By following these best practices, you can implement egress TLS inspection in your AWS environment, helping to enhance your network’s security while maintaining performance.
Conclusion
Egress TLS inspection is a critical capability for securing your network by providing increased visibility and control over encrypted outbound traffic. In this post, you learned about the key concepts, configuration steps, performance considerations, and best practices for implementing egress TLS inspection with Network Firewall. By decrypting, inspecting, and re-encrypting selected outbound traffic, you can identify hidden threats and enforce security policies without compromising network efficiency.
Continually reviewing your organization’s incident response capabilities can be challenging without a mechanism to create security findings with actual Amazon Web Services (AWS) resources within your AWS estate. As prescribed within the AWS Security Incident Response whitepaper, it’s important to periodically review your incident response capabilities to make sure your security team is continually maturing internal processes and assessing capabilities within AWS. Generating sample security findings is useful to understand the finding format so you can enrich the finding with additional metadata or create and prioritize detections within your security information event management (SIEM) solution. However, if you want to conduct an end-to-end incident response simulation, including the creation of real detections, sample findings might not create actionable detections that will start your incident response process because of alerting suppressions you might have configured, or imaginary metadata (such as synthetic Amazon Elastic Compute Cloud (Amazon EC2) instance IDs), which might confuse your remediation tooling.
In this post, we walk through how to deploy a solution that provisions resources to generate simulated security findings for actual provisioned resources within your AWS account. Generating simulated security findings in your AWS account gives your security team an opportunity to validate their cyber capabilities, investigation workflow and playbooks, escalation paths across teams, and exercise any response automation currently in place.
Important: It’s strongly recommended that the solution be deployed in an isolated AWS account with no additional workloads or sensitive data. No resources deployed within the solution should be used for any purpose outside of generating the security findings for incident response simulations. Although the security findings are non-destructive to existing resources, they should still be done in isolation. For any AWS solution deployed within your AWS environment, your security team should review the resources and configurations within the code.
Conducting incident response simulations
Before deploying the solution, it’s important that you know what your goal is and what type of simulation to conduct. If you’re primarily curious about the format that active Amazon GuardDuty findings will create, you should generate sample findings with GuardDuty. At the time of this writing, Amazon Inspector doesn’t currently generate sample findings.
If you want to validate your incident response playbooks, make sure you have playbooks for the security findings the solution generates. If those playbooks don’t exist, it might be a good idea to start with a high-level tabletop exercise to identify which playbooks you need to create.
Because you’re running this sample in an AWS account with no workloads, it’s recommended to run the sample solution as a purple team exercise. Purple team exercises should be periodically run to support training for new analysts, validate existing playbooks, and identify areas of improvement to reduce the mean time to respond or identify areas where processes can be optimized with automation.
Now that you have a good understanding of the different simulation types, you can create security findings in an isolated AWS account.
Prerequisites
[Recommended] A separate AWS account containing no customer data or running workloads
[Optional] AWS Security Hub can be enabled to show a consolidated view of security findings generated by GuardDuty and Inspector
Solution architecture
The architecture of the solution can be found in Figure 1.
Figure 1: Sample solution architecture diagram
A user specifies the type of security findings to generate by passing an AWS CloudFormation parameter.
An Amazon Simple Notification Service (Amazon SNS) topic is created to subscribe to findings for notifications. Subscribed users are notified of the finding through the deployed SNS topic.
Upon user selection of the CloudFormation parameter, EC2 instances are provisioned to run commands to generate security findings.
Note: If the parameter inspector is provided during deployment, then only one EC2 instance is deployed. If the parameter guardduty is provided during deployment, then two EC2 instances are deployed.
The Lambda function, ecr_cleanup_function, cleans up the vulnerable images in the deployed Amazon ECR repository based on applied tags and sends a notification to the Amazon SNS topic.
Note: The ecr_cleanup_function Lambda function is also invoked as a custom resource to clean up vulnerable images during deployment. If there are issues with cleanup, the EventBridge rule continually attempts to clean up vulnerable images.
For GuardDuty, the following actions are taken and resources are deployed:
An AWS Systems Manager parameter stores the IAM access key for guardduty-demo-user.
An AWS Secrets Manager secret stores the inactive IAM secret access key for guardduty-demo-user.
An Amazon DynamoDB table is created, and the table name is stored in a Systems Manager parameter to be referenced within the EC2 user data.
An Amazon Simple Storage Service (Amazon S3) bucket is created, and the bucket name is stored in a Systems Manager parameter to be referenced within the EC2 user data.
A Lambda function adds a threat list to GuardDuty that includes the IP addresses of the EC2 instances deployed as part of the sample.
EC2 user data generates GuardDuty findings for the following:
Updates EKS cluster configuration to make a dashboard public.
DynamoDB
Adds an item to the DynamoDB table for Joshua Tree.
EC2
Creates an AWS CloudTrail trail named guardduty-demo-trail-<GUID> and subsequently deletes the same CloudTrail trail. The <GUID> is randomly generated by using the $RANDOM function
Runs portscan on 172.31.37.171 (an RFC 1918 private IP address) and private IP of the EKS Deployment EC2 instance provisioned as part of the sample. Port scans are primarily used by bad actors to search for potential vulnerabilities. The target of the port scans are internal IP addresses and do not leave the sample VPC deployed.
Curls DNS domains that are labeled for bitcoin, command and control, and other domains associated with known threats.
Amazon S3
Disables Block Public Access and server access logging for the S3 bucket provisioned as part of the solution.
IAM
Deletes the existing account password policy and creates a new password policy with a minimum length of six characters.
guardduty_remediation_eks_rule – When a GuardDuty finding for EKS is created, a Lambda function attempts to delete the EKS resources. Subscribed users are notified of the finding through the deployed SNS topic.
guardduty_remediation_credexfil_rule – When a GuardDuty finding for InstanceCredentialExfiltration is created, a Lambda function is used to revoke the IAM role’s temporary security credentials and AWS permissions. Subscribed users are notified of the finding through the deployed SNS topic.
guardduty_respond_IAMUser_rule – When a GuardDuty finding for IAM is created, subscribed users are notified through the deployed SNS topic. There is no remediation activity triggered by this rule.
Guardduty_notify_S3_rule – When a GuardDuty finding for Amazon S3 is created, subscribed users are notified through the deployed Amazon SNS topic. This rule doesn’t invoke any remediation activity.
The following Lambda functions are created:
guardduty_iam_remediation_function – This function revokes active sessions and sends a notification to the SNS topic.
eks_cleanup_function – This function deletes the EKS resources in the EKS CloudFormation template.
Note: Upon attempts to delete the overall sample CloudFormation stack, this runs to delete the EKS CloudFormation template.
An S3 bucket stores EC2 user data scripts run from the EC2 instances
Option 1: Deploy the solution with AWS CloudFormation using the console
Use the console to sign in to your chosen AWS account and then choose the Launch Stack button to open the AWS CloudFormation console pre-loaded with the template for this solution. It takes approximately 10 minutes for the CloudFormation stack to complete.
Option 2: Deploy the solution by using the AWS CDK
To build the app when navigating to the project’s root folder, use the following commands:
npm install -g aws-cdk-lib
npm install
Run the following command in your terminal while authenticated in your separate deployment AWS account to bootstrap your environment. Be sure to replace <INSERT_AWS_ACCOUNT> with your account number and replace <INSERT_REGION> with the AWS Region that you want the solution deployed to.
After the solution successfully deploys, security findings should start appearing in your AWS account’s GuardDuty console within a couple of minutes.
Amazon GuardDuty findings
In order to create a diverse set of GuardDuty findings, the solution uses Amazon EC2 user data to run scripts. Those scripts can be found in the sample repository. You can also review and change scripts as needed to fit your use case or to remove specific actions if you don’t want specific resources to be altered or security findings to be generated.
A comprehensive list of active GuardDuty finding types and details for each finding can be found in the Amazon GuardDuty user guide. In this solution, activities which cause the following GuardDuty findings to be generated, are performed:
To generate the EKS security findings, the EKS Deployment EC2 instance is running eksctl commands that deploy CloudFormation templates. If the EKS cluster doesn’t deploy, it might be because of capacity restraints in a specific Availability Zone. If this occurs, manually delete the failed EKS CloudFormation templates.
If you want to create the EKS cluster and security findings manually, you can do the following:
Connect to the EKS Deployment EC2 instance using an IAM role that has access to start a session through Systems Manager. After connecting to the ssm-user, issue the following commands in the Session Manager session:
The findings for Amazon Inspector are generated by using the open source Vulhub collection. The open source collection has pre-built vulnerable Docker environments that pull images into Amazon ECR.
The Amazon Inspector findings that are created vary depending on what exists within the open source library at deployment time. The following are examples of findings you will see in the console:
If you deployed the security finding generator solution by using the Launch Stack button in the console or the CloudFormation template security_finding_generator_cfn, do the following to clean up:
In the CloudFormation console for the account and Region where you deployed the solution, choose the SecurityFindingGeneratorStack stack.
Choose the option to Delete the stack.
If you deployed the solution by using the AWS CDK, run the command cdk destroy.
Important: The solution uses eksctl to provision EKS resources, which deploys additional CloudFormation templates. There are custom resources within the solution that will attempt to delete the provisioned CloudFormation templates for EKS. If there are any issues, you should verify and manually delete the following CloudFormation templates:
In this blog post, I showed you how to deploy a solution to provision resources in an AWS account to generate security findings. This solution provides a technical framework to conduct periodic simulations within your AWS environment. By having real, rather than simulated, security findings, you can enable your security teams to interact with actual resources and validate existing incident response processes. Having a repeatable mechanism to create security findings also provides your security team the opportunity to develop and test automated incident response capabilities in your AWS environment.
If you have feedback about this post, submit comments in the Comments section below. If you have questions about this post, start a new thread on the Incident Response re:Post or contact AWS Support.
A few days ago a significant supply chain attack attempt was accidentally revealed – the xz utiliy was compromised, likely by a nation state, in order to plant a backdoor which allows sniffing on encrypted traffic.
The xz library is a building block of many other packages and is basically ubiquitous. A famous XKCD strip describes the situation graphically:
This means that if it wasn’t accidentally discovered due to worsened performance, we would eventually have a carefully planted backdoor on practically every Linux server out there. This is a major issue and even though open source security is better than closed source security, even if just by allowing backdoors to be discovered by anyone, we need to address such nation state attempts of planting backdoors.
I propose two complementary measures:
Public funding for open source – the EU and the US need to create a structured, not overly bureaucratic process to fund the maintenance of core open source projects (like xz). Germany has done a good job in setting up its Sovereign tech fund, but we need broader instruments that make sure there is no open source abandonware on which many other projects depend. Currently large corporations often fund the development of open source, but xz is an example that the little building blocks may fall through the cracks. Open source funding can also be directed at systematic security analysis of open source projects (like the one in point 2, but not limited the security services).
Analyzing high-risk project – security services and other public and private organizations need to first pinpoint high-risk projects (ones that if compromised, cause a huge risk that trickles down to the whole ecosystem), rank projects based on risk, and then analyze no just source code, but also maintenance activities, maintainer recruitment and churn, commit patterns and so on. In hindsight, the xz backdoor could have been caught by monitoring such metadata and the suspicious activities by the “hacker”. We, of course, need (open source) tools to do these analysis, but also highly-skilled people in the security services of larger countries.
Overall, we can and should learn lessons and take measures based on this incident. Because the next one might not cause noticeable performance degradation and get into actual production, which will be devastating.
The frontend is what we use to login into our system. The Zabbix frontend will connect to our Zabbix server and our database. But we also send information from our laptop to the frontend. It’s important that when we enter our credentials that we can do this in a safe way. So it makes sense to make use of certificates and one way to do this is by making use of self-signed certificates.
To give you a better understanding of why your browser will warn you when using self-signed certificates, we have to know that when we request an SSL certificate from an official Certificate Authority (CA) that you submit a Certificate Signing Request (CSR) to them. They in return provide you with a Signed SSL certificate. For this, they make use of their root certificate and private key.
Our browser comes with a copy of the root certificate (CA) from various authorities, or it can access it from the OS. This is why our self-signed certificates are not trusted by our browser – we don’t have any CA validation. Our only workaround is to create our own root certificate and private key.
Table of Contents
Understanding the concepts
How to create an SSL certificate:
How SSL works – Client – Server flow:
NOTE: I have borrowed the designs from this video, which does a good job of explaining how SSL works.
Securing the Frontend with self signed SSL on Nginx
In order to configure this, there are a few steps that we need to follow:
Generate a private key for the CA ( Certificate Authority )
Generate a root certificate
Generate CA-Authenticated Certificates
Generate a Certificate Signing Request (CSR)
Generate an X509 V3 certificate extension configuration file
Generate the certificate using our CSR, the CA private key, the CA certificate, and the config file
Copy the SSL certificates to your Virtual Host
Adapt your Nginx Zabbix config
Generate a private key for the CA
The first step is to make a folder named “SSL” so we can create our certificates and save them:
req: This command is used for X.509 certificate signing request (CSR) management
x509: This option specifies that a self-signed certificate should be created
new: This option is used to generate a new certificate
nodes: This option indicates that the private key should not be encrypted. It will generates a private key without a passphrase, making it more
convenient but potentially less secure
key myCA.key: This specifies the private key file (myCA.key) to be used in generating the certificate
sha256: This option specifies the hash algorithm to be used for the certificate. In this case, SHA-256 is chosen for stronger security
days 1825: This sets the validity period of the certificate in days. Here, it’s set to 1825 days (5 years)
out myCA.pem: This specifies the output file name for the generated certificate. In this case, “myCA.pem”
The information you enter is not so important, but it’s best to fill it in as comprehensively as possible. Just make sure you enter for CN your IP or DNS.
You are about to be asked to enter information that will be incorporated into your certificate request. What you are about to enter is what is called a Distinguished Name or a DN. There are quite a few fields but you can leave some blank For some fields there will be a default value, If you enter '.', the field will be left blank. ----- Country Name (2 letter code) [XX]:BE State or Province Name (full name) []:vlaams-brabant Locality Name (eg, city) [Default City]:leuven Organization Name (eg, company) [Default Company Ltd]: Organizational Unit Name (eg, section) []: Common Name (eg, your name or your server's hostname) []:192.168.0.134 Email Address []:
Generate CA-Authenticated Certificates
It’s probably good practice to use the dns name of your webiste in the name for the private key. As we use in this case an IP address rather than a dns, I will use the fictive dns zabbix.mycompany.internal.
You will be asked the same set of questions as above. Once again, your answers hold minimal significance and in our case no one will inspect the certificate, so they matter even less.
You are about to be asked to enter information that will be incorporated into your certificate request. What you are about to enter is what is called a Distinguished Name or a DN. There are quite a few fields but you can leave some blank For some fields there will be a default value, If you enter '.', the field will be left blank. ----- Country Name (2 letter code) [XX]:BE State or Province Name (full name) []:vlaams-brabant Locality Name (eg, city) [Default City]:leuven Organization Name (eg, company) [Default Company Ltd]: Organizational Unit Name (eg, section) []: Common Name (eg, your name or your server's hostname) []:192.168.0.134 Email Address []:
Please enter the following 'extra' attributes to be sent with your certificate request A challenge password []: An optional company name []:
Generate an X509 V3 certificate extension configuration file
# vi zabbix.mycompany.internal.ext
Add the following lines in your certificate extension file. Replace IP or DNS with your own values.
Modify the “When using this certificate:” dropdown to “Always Trust”
Close the certificate window
Import the CA in Windows
Open the “Microsoft Management Console” by pressing Windows + R, typing mmc, and clicking Open
Navigate to File > Add/Remove Snap-in
Select Certificates and click Add
Choose Computer Account and proceed by clicking Next
Select Local Computer and click Finish
Click OK to return to the MMC window
Expand the view by double-clicking Certificates (local computer)
Right-click on Certificates under “Object Type” in the middle column, select All Tasks, and then Import
Click Next, followed by Browse. Change the certificate extension dropdown next to the filename field to All Files (.) and locate the myCA.pem file
Click Open, then Next
Choose “Place all certificates in the following store.” with “Trusted Root Certification Authorities store” as the default. Proceed by clicking Next, then Finish, to finalize the wizard
If all went well you should find your certificate under Trusted Root Certification Authorities > Certificates
Warning! You also need to import the myCA.crt file in your OS. We are not an official CA, so we have to import it in our OS and tell it to trust this Certificate. This action depends on the OS you use.
As you are using OpenSSL, you should also create a strong Diffie-Hellman group, which is used in negotiating Perfect Forward Secrecy with clients. You can do this by typing:
Add the following lines to your Nginx configuration, modifying the file paths as needed. Replace the existing lines with port 80 with this configuration. This will enable SSL and HTTP2.
Implementing user authentication and authorization for custom applications requires significant effort. For authentication, customers often use an external identity provider (IdP) such as Amazon Cognito. Yet, authorization logic is typically implemented in code. This code can be prone to errors, especially as permissions models become complex, and presents significant challenges when auditing permissions and deciding who has access to what. As a result, within Common Weakness Enumeration’s (CWE’s) list of the Top 25 Most Dangerous Software Weaknesses for 2023, four are related to incorrect authorization.
At re:Inforce 2023, we launched Amazon Verified Permissions, a fine-grained permissions management service for the applications you build. Verified Permissions centralizes permissions in a policy store and lets developers use those permissions to authorize user actions within their applications. Permissions are expressed as Cedar policies. You can learn more about the benefits of moving your permissions centrally and expressing them as policies in Policy-based access control in application development with Amazon Verified Permissions.
In this post, we explore how you can provide a faster and richer user experience while still authorizing all requests in the application. You will learn two techniques—bulk authorization and response caching—to improve the efficiency of your applications. We describe how you can apply these techniques when listing authorized resources and actions and loading multiple components on webpages.
Use cases
You can use Verified Permissions to enforce permissions that determine what the user is able to see at the level of the user interface (UI), and what the user is permitted to do at the level of the API.
UI permissions enable developers to control what a user is allowed see in the application. Developers enforce permissions in the UI to control the list of resources a user can see and the actions they can take. For example, a UI-level permission in a banking application might determine whether a transfer funds button is enabled for a given account.
API permissions enable developers to control what a user is allowed to do in an application. Developers control access to individual API calls made by an application on behalf of the user. For example, an API-level permission in a banking application might determine whether a user is permitted to initiate a funds transfer from an account.
Cedar provides consistent and readable policies that can be used at both the level of the UI and the API. For example, a single policy can be checked at the level of the UI to determine whether to show the transfer funds button and checked at the level of the API to determine authority to initiate the funds transfer.
Challenges
Verified Permissions can be used for implementing fine-grained API permissions. Customer applications can use Verified Permissions to authorize API requests, based on centrally managed Cedar policies, with low latency. Applications authorize such requests by calling the IsAuthorized API of the service, and the response contains whether the request is allowed or denied. Customers are happy with the latency of individual authorization requests, but have asked us to help them improve performance for use cases that require multiple authorization requests. They typically mention two use cases:
Compound authorization: Compound authorization is needed when one high-level API action involves many low-level actions, each of which has its own permissions. This requires the application to make multiple requests to Verified Permissions to authorize the user action. For example, in a banking application, loading a credit card statement requires three API calls: GetCreditCardDetails, GetCurrentStatement, and GetCreditLimit. This requires three calls to Verified Permissions, one for each API call.
UI permissions: Developers implement UI permissions by calling the same authorization API for every possible resource a principal can access. Each request involves an API call, and the UI can only be presented after all of them have completed. Alternatively, for a resource-centric view, the application can make the call for multiple principals to determine which ones have access.
Solution
In this post, we show you two techniques to optimize the application’s latency based on API permissions and UI permissions.
Batch authorization allows you to make up to 30 authorization decisions in a single API call. This feature was released in November 2023. See the what’s new post and API specifications to learn more.
Solving for enforcing fine grained permissions while delivering a great user experience
You can use UI permissions to authorize what resources and actions a user can view in an application. We see developers implementing these controls by first generating a small set of resources based on database filters and then further reducing the set down to authorized resources by checking permissions on each resource using Verified Permissions. For example, when a user of a business banking system tries to view balances on company bank accounts, the application first filters the list to the set of bank accounts for that company. The application then filters the list further to only include the accounts that the user is authorized to view by making an API request to Verified Permissions for each account in the list. With batch authorization, the application can make a single API call to Verified Permissions to filter the list down to the authorized accounts.
Similarly, you can use UI permissions to determine what components of a page or actions should be visible to users of the application. For example, in a banking application, the application wants to control the sub-products (such as credit card, bank account, or stock trading) visible to a user or only display authorized actions (such as transfer or change address) when displaying an account overview page. Customers want to use Verified Permissions to determine which components of the page to display, but that can adversely impact the user experience (UX) if they make multiple API calls to build the page. With batch authorization, you can make one call to Verified Permissions to determine permissions for all components of the page. This enables you to provide a richer experience in your applications by displaying only the components that the user is allowed to access while maintaining low page load latency.
Solving for enforcing permissions for every API call without impacting performance
Compound authorization is where a single user action results in a sequence of multiple authorization calls. You can use bulk authorization combined with response caching to improve efficiency. The application makes a single bulk authorization request to Verified Permissions to determine whether each of the component API calls are permitted and the response is cached. This cache is then referenced for each component’s API call in the sequence.
Sample application – Use cases, personas, and permissions
We’re using an online order management application for a toy store to demonstrate how you can apply batch authorization and response caching to improve UX and application performance.
One function of the application is to enable employees in a store to process online orders.
Personas
The application is used by two types of users:
Pack associates are responsible for picking, packing, and shipping orders. They’re assigned to a specific department.
Store managers are responsible for overseeing the operations of a store.
Use cases
The application supports these use cases:
Listing orders: Users can list orders. A user should only see the orders for which they have view permissions.
Pack associates can list all orders of their department.
Store managers can list all orders of their store.
Figure 1 shows orders for Julian, who is a pack associate in the Soft Toy department
Figure 1: Orders for Julian in the Soft Toy department
Order actions: Users can take some actions on an order. The application enables the relevant UI elements based on the user’s permissions.
Pack associates can select Get Box Size and Mark as Shipped, as shown in Figure 2.
Store managers can select Get Box Size, Mark as Shipped, Cancel Order, and Route to different warehouse.
Figure 2: Actions available to Julian as a pack associate
Viewing an order: Users can view the details of a specific order. When a user views an order, the application loads the details, label, and receipt. Figure 3 shows the available actions for Julian who is a pack associate.
Figure 3: Order Details for Julian, showing permitted actions
In the sample application, the policy template for the store owner role looks like the following:
permit (
        principal == ?principal,
        action in [
                avp::sample::toy::store::Action::"OrderActions",
                avp::sample::toy::store::Action::"AddPackAssociate",
                avp::sample::toy::store::Action::"AddStoreManager",
                avp::sample::toy::store::Action::"ListPackAssociates",
                avp::sample::toy::store::Action::"ListStoreManagers"
        ],
        resource in ?resource
);
When a user is assigned a role, the application creates a policy from the corresponding template by passing the user and store. For example, the policy created for the store owner is as follows:
permit (
    principal ==  avp::sample::toy::store::User::"test_user_pool|sub_store_manager_user",
    action in  [
                avp::sample::toy::store::Action::"OrderActions",
                avp::sample::toy::store::Action::"AddPackAssociate",
                avp::sample::toy::store::Action::"AddStoreManager",
                avp::sample::toy::store::Action::"ListPackAssociates",
                avp::sample::toy::store::Action::"ListStoreManagers"
    ],
    resource in avp::sample::toy::store::Store::"toy store 1"
);
In this section, we discuss high level design, challenges with the barebones integration, and how you can use the preceding techniques to reduce latency and costs.
Listing orders
Figure 4: Architecture for listing orders
As shown in Figure 4, the process to list orders is:
The user accesses the application hosted in AWS Amplify.
The user then authenticates through Amazon Cognito and obtains an identity token.
The application uses Amplify to load the order page. The console calls the API ListOrders to load the order.
The API is hosted in API Gateway and protected by a Lambda authorizer function.
The Lambda function collects entity information from an in-memory data store to formulate the isAuthorized request.
Then the Lambda function invokes Verified Permissions to authorize the request. The function checks against Verified Permissions for each order in the data store for the ListOrder call. If Verified Permissions returns deny, the order is not provided to the user. If Verified Permissions returns allow, the request is moved forward.
Challenge
Figure 5 shows that the application called IsAuthorized multiple times, sequentially. Multiple sequential calls cause the page to be slow to load and increase infrastructure costs.
Figure 5: Graph showing repeated calls to IsAuthorized
Reduce latency using batch authorization
If you transition to using batch authorization, the application can receive 30 authorization decisions with a single API call to Verified Permissions. As you can see in Figure 6, the time to authorize has reduced from close to 800 ms to 79 ms, delivering a better overall user experience.
Figure 6: Reduced latency by using batch authorization
Order actions
Figure 7: Order actions architecture
As shown in Figure 7, the process to get authorized actions for an order is:
The user goes to the application landing page on Amplify.
The application calls the Order actions API at API Gateway
The application sends a request to initiate order actions to display only authorized actions to the user.
The Lambda function collects entity information from an in-memory data store to formulate the isAuthorized request.
The Lambda function then checks with Verified Permissions for each order action. If Verified Permissions returns deny, the action is dropped. If Verified Permissions returns allow, the request is moved forward and the action is added to a list of order actions to be sent in a follow-up request to Verified Permissions to provide the actions in the user’s UI.
Challenge
As you saw with listing orders, Figure 8 shows how the application is still calling IsAuthorized multiple times, sequentially. This means the page remains slow to load and has increased impacts on infrastructure costs.
Figure 8: Graph showing repeated calls to IsAuthorized
Reduce latency using batch authorization
If you add another layer by transitioning to using batch authorization once again, the application can receive all decisions with a single API call to Verified Permissions. As you can see from Figure 9, the time to authorize has reduced from close to 500 ms to 150 ms, delivering an improved user experience.
Figure 9: Graph showing results of layering batch authorization
Viewing an order
Figure 10: Order viewing architecture
The process to view an order, shown in Figure 10, is:
The user accesses the application hosted in Amplify.
The user authenticates through Amazon Cognito and obtains an identity token.
The application calls three APIs hosted at API Gateway.
The API’s: Get order details, Get label, and Get receipt are targeted sequentially to load the UI for the user in the application.
A Lambda authorizer protects each of the above-mentioned APIs and is launched for each invoke.
The Lambda function collects entity information from an in-memory data store to formulate the isAuthorized request.
For each API, the following steps are repeated. The Lambda authorizer is invoked three times during page load.
The Lambda function invokes Verified Permissions to authorize the request. If Verified Permissions returns deny, the request is rejected and an HTTP unauthorized response (403) is sent back. If Verified Permissions returns allow, the request is moved forward.
If the request is allowed, API Gateway calls the Lambda Order Management function to process the request. This is the primary Lambda function supporting the application and typically contains the core business logic of the application.
Challenge
In using the standard authorization pattern for this use case, the application calls Verified Permissions three times. This is because the user action to view an order requires compound authorization because each API call made by the console is authorized. While this enforces least privilege, it impacts the page load and reload latency of the application.
Reduce latency using batch authorization and decision caching
You can use batch authorization and decision caching to reduce latency. In the sample application, the cache is maintained by API Gateway. As shown in Figure 11, applying these techniques to the console application results in only one call to Verified Permissions, reducing latency.
Figure 11: Batch authorization with decision caching architecture
The decision caching processshown in Figure 11, is:
The user accesses the application hosted in Amplify.
The user then authenticates through Amazon Cognito and obtains an identity token.
The application then calls three APIs hosted at API Gateway
When the Lambda function for the Get order details API is invoked, it uses the Lambda Authorizer to call batch authorization to get authorization decisions for the requested action, Get order details, and related actions, Get label and Get receipt.
A Lambda authorizer protects each of the above-mentioned APIs but because of batch authorization, is invoked only once.
The Lambda function collects entity information from an in-memory data store to formulate the isAuthorized request.
The Lambda function invokes Verified Permissions to authorize the request. If Verified Permissions returns deny, the request is rejected and an HTTP unauthorized response (403) is sent back. If Verified Permissions returns allow, the request is moved forward.
API Gateway caches the authorization decision for all actions (the requested action and related actions).
If the request is allowed by the Lambda authorizer function, API Gateway calls the order management Lambda function to process the request. This is the primary Lambda function supporting the application and typically contains the core business logic of the application.
When subsequent APIs are called, the API Gateway uses the cached authorization decisions and doesn’t use the Lambda authorization function.
Caching considerations
You’ve seen how you can use caching to implement fine-grained authorization at scale in your applications. This technique works well when your application has high cache hit rates, where authorization results are frequently loaded from the cache. Applications where the users initiate the same action multiple times or have a predictable sequence of actions will observe high cache hit rates. Another consideration is that employing caching can delay the time between policy updates and policy enforcement. We don’t recommend using caching for authorization decisions if your application requires policies to take effect quickly or your policies are time dependent (for example, a policy that gives access between 10:00 AM and 2:00 PM).
Conclusion
In this post, we showed you how to implement fine grained permissions in application at scale using Verified Permissions. We covered how you can use batch authorization and decision caching to improve performance and ensure Verified Permissions remains a cost-effective solution for large-scale applications. We applied these techniques to a demo application, avp-toy-store-sample, that is available to you for hands-on testing. For more information about Verified Permissions, see the Amazon Verified Permissions product details and Resources.
If you have feedback about this post, submit comments in the Comments section below. If you have questions about this post, contact AWS Support.
You’re browsing your inbox and spot an email that looks like it’s from a brand you trust. Yet, something feels off. This might be a phishing attempt, a common tactic where cybercriminals impersonate reputable entities — we’ve written about the top 50 most impersonated brands used in phishing attacks. One factor that can be used to help evaluate the email’s legitimacy is its Top-Level Domain (TLD) — the part of the email address that comes after the dot.
In this analysis, we focus on the TLDs responsible for a significant share of malicious or spam emails since January 2023. For the purposes of this blog post, we are considering malicious email messages to be equivalent to phishing attempts. With an average of 9% of 2023’s emails processed by Cloudflare’s Cloud Email Security service marked as spam and 3% as malicious, rising to 4% by year-end, we aim to identify trends and signal which TLDs have become more dubious over time. Keep in mind that our measurements represent where we observe data across the email delivery flow. In some cases, we may be observing after initial filtering has taken place, at a point where missed classifications are likely to cause more damage. This information derived from this analysis could serve as a guide for Internet users, corporations, and geeks like us, searching for clues, as Internet detectives, in identifying potential threats. To make this data readily accessible, Cloudflare Radar, our tool for Internet insights, now includes a new section dedicated to email security trends.
Cyber attacks often leverage the guise of authenticity, a tactic Cloudflare thwarted following a phishing scheme similar to the one that compromised Twilio in 2022. The US Cybersecurity and Infrastructure Security Agency (CISA) notes that 90% of cyber attacks start with phishing, and fabricating trust is a key component of successful malicious attacks. We see there are two forms of authenticity that attackers can choose to leverage when crafting phishing messages, visual and organizational. Attacks that leverage visual authenticity rely on attackers using branding elements, like logos or images, to build credibility. Organizationally authentic campaigns rely on attackers using previously established relationships and business dynamics to establish trust and be successful.
Our findings from 2023 reveal that recently introduced generic TLDs (gTLDs), including several linked to the beauty industry, are predominantly used both for spam and malicious attacks. These TLDs, such as .uno, .sbs, and .beauty, all introduced since 2014, have seen over 95% of their emails flagged as spam or malicious. Also, it’s important to note that in terms of volume, “.com” accounts for 67% of all spam and malicious emails (more on that below).
TLDs
2023 Spam %
2023 Malicious %
2023 Spam + malicious %
TLD creation
.uno
62%
37%
99%
2014
.sbs
64%
35%
98%
2021
.best
68%
29%
97%
2014
.beauty
77%
20%
97%
2021
.top
74%
23%
97%
2014
.hair
78%
18%
97%
2021
.monster
80%
17%
96%
2019
.cyou
34%
62%
96%
2020
.wiki
69%
26%
95%
2014
.makeup
32%
63%
95%
2021
Email and Top-Level Domains history
In 1971, Ray Tomlinson sent the first networked email over ARPANET, using the @ character in the address. Five decades later, email remains relevant but also a key entry point for attackers.
Before the advent of the World Wide Web, email standardization and growth in the 1980s, especially within academia and military communities, led to interoperability. Fast forward 40 years, and this interoperability is once again a hot topic, with platforms like Threads, Mastodon, and other social media services aiming for the open communication that Jack Dorsey envisioned for Twitter. So, in 2024, it’s clear that social media, messaging apps like Slack, Teams, Google Chat, and others haven’t killed email, just as “video didn’t kill the radio star.”
The structure of a domain name.
The domain name system, managed by ICANN, encompasses a variety of TLDs, from the classic “.com” (1985) to the newer generic options. There are also the country-specific (ccTLDs), where the Internet Assigned Numbers Authority (IANA) is responsible for determining an appropriate trustee for each ccTLD. An extensive 2014 expansion by ICANN was designed to “increase competition and choice in the domain name space,” introducing numerous new options for specific professional, business, and informational purposes, which in turn, also opened up new possibilities for phishing attempts.
3.4 billion unwanted emails
Cloudflare’s Cloud Email Security service is helping protect our customers, and that also comes with insights. In 2022, Cloudflare blocked 2.4 billion unwanted emails, and in 2023 that number rose to over 3.4 billion unwanted emails, 26% of all messages processed. This total includes spam, malicious, and “bulk” (practice of sending a single email message, unsolicited or solicited, to a large number of recipients simultaneously) emails. That means an average of 9.3 million per day, 6500 per minute, 108 per second.
Bear in mind that new customers also make the numbers grow — in this case, driving a 42% increase in unwanted emails from 2022 to 2023. But this gives a sense of scale in this email area. Those unwanted emails can include malicious attacks that are difficult to detect, becoming more frequent, and can have devastating consequences for individuals and businesses that fall victim to them. Below, we’ll give more details on email threats, where malicious messages account for almost 3% of emails averaged across all of 2023 and it shows a growth tendency during the year, with higher percentages in the last months of the year. Let’s take a closer look.
Top phishing TLDs (and types of TLDs)
First, let’s start with an 2023 overview of top level domains with a high percentage of spam and malicious messages. Despite excluding TLDs with fewer than 20,000 emails, our analysis covers unwanted emails considered to be spam and malicious from more than 350 different TLDs (and yes, there are many more).
A quick overview highlights the TLDs with the highest rates of spam and malicious attacks as a proportion of their outbound email, those with the largest volume share of spam or malicious emails, and those with the highest rates of just-malicious and just-spam TLD senders. It reveals that newer TLDs, especially those associated with the beauty industry (generally available since 2021 and serving a booming industry), have the highest rates as a proportion of their emails. However, it’s relevant to recognize that “.com” accounts for 67% of all spam and malicious emails. Malicious emails often originate from recently created generic TLDs like “.bar”, “.makeup”, or “.cyou”, as well as certain country-code TLDs (ccTLDs) employed beyond their geographical implications.
Highest % of spam and malicious emails
Volume share of spam + malicious
Highest % of malicious
Highest % of spam
TLD
Spam + mal %
TLD
Spam + mal %
TLD
Malicious %
TLD
Spam %
.uno
99%
.com
67%
.bar
70%
.autos
93%
.sbs
98%
.shop
5%
.makeup
63%
.today
92%
.best
97%
.net
4%
.cyou
62%
.directory
91%
.beauty
97%
.no
3%
.ml
56%
.boats
87%
.top
97%
.org
2%
.tattoo
54%
.center
85%
.hair
97%
.ru
1%
.om
47%
.monster
80%
.monster
96%
.jp
1%
.cfd
46%
.lol
79%
.cyou
96%
.click
1%
.skin
39%
.hair
78%
.wiki
95%
.beauty
1%
.uno
37%
.shop
78%
.makeup
95%
.cn
1%
.pw
37%
.beauty
77%
Focusing on volume share, “.com” dominates the spam + malicious list at 67%, and is joined in the top 3 by another “classic” gTLD, “.net”, at 4%. They also lead by volume when we look separately at the malicious (68% of all malicious emails are “.com” and “.net”) and spam (71%) categories, as shown below. All of the generic TLDs introduced since 2014 represent 13.4% of spam and malicious and over 14% of only malicious emails. These new TLDs (most of them are only available since 2016) are notable sources of both spam and malicious messages. Meanwhile, country-code TLDs contribute to more than 12% of both categories of unwanted emails.
This breakdown highlights the critical role of both established and new generic TLDs, which surpass older ccTLDs in terms of malicious emails, pointing to the changing dynamics of email-based threats.
Type of TLDs
Spam
Malicious
Spam + malicious
ccTLDs
13%
12%
12%
.com and .net only
71%
68%
71%
new gTLDs
13%
14%
13.4%
That said, “.shop” deserves a highlight of its own. The TLD, which has been available since 2016, is #2 by volume of spam and malicious emails, accounting for 5% of all of those emails. It also represents, when we separate those two categories, 5% of all malicious emails, and 5% of all spam emails. As we’re going to see below, its influence is growing.
Full 2023 top 50 spam & malicious TLDs list
For a more detailed perspective, below we present the top 50 TLDs with the highest percentages of spam and malicious emails during 2023. We also include a breakdown of those two categories.
It’s noticeable that even outside the top 10, other recent generic TLDs are also higher in the ranking, such as “.autos” (the #1 in the spam list), “.today”, “.bid” or “.cam”. TLDs that seem to promise entertainment or fun or are just leisure or recreational related (including “.fun” itself), occupy a position in our top 50 ranking.
2023 Top 50 spam & malicious TLDs (by highest %)
Rank
TLD
Spam %
Malicious %
Spam + malicious %
1
.uno
62%
37%
99%
2
.sbs
64%
35%
98%
3
.best
68%
29%
97%
4
.beauty
77%
20%
97%
5
.top
74%
23%
97%
6
.hair
78%
18%
97%
7
.monster
80%
17%
96%
8
.cyou
34%
62%
96%
9
.wiki
69%
26%
95%
10
.makeup
32%
63%
95%
11
.autos
93%
2%
95%
12
.today
92%
3%
94%
13
.shop
78%
16%
94%
14
.bid
74%
18%
92%
15
.cam
67%
25%
92%
16
.directory
91%
0%
91%
17
.icu
75%
15%
91%
18
.ml
33%
56%
89%
19
.lol
79%
10%
89%
20
.skin
49%
39%
88%
21
.boats
87%
1%
88%
22
.tattoo
34%
54%
87%
23
.click
61%
27%
87%
24
.ltd
70%
17%
86%
25
.rest
74%
11%
86%
26
.center
85%
0%
85%
27
.fun
64%
21%
85%
28
.cfd
39%
46%
84%
29
.bar
14%
70%
84%
30
.bio
72%
11%
84%
31
.tk
66%
17%
83%
32
.yachts
58%
23%
81%
33
.one
63%
17%
80%
34
.ink
68%
10%
78%
35
.wf
76%
1%
77%
36
.no
76%
0%
76%
37
.pw
39%
37%
75%
38
.site
42%
31%
73%
39
.life
56%
16%
72%
40
.homes
62%
10%
72%
41
.services
67%
2%
69%
42
.mom
63%
5%
68%
43
.ir
37%
29%
65%
44
.world
43%
21%
65%
45
.lat
40%
24%
64%
46
.xyz
46%
18%
63%
47
.ee
62%
1%
62%
48
.live
36%
26%
62%
49
.pics
44%
16%
60%
50
.mobi
41%
19%
60%
Change in spam & malicious TLD patterns
Let’s look at TLDs where spam + malicious emails comprised the largest share of total messages from that TLD, and how that list of TLDs changed from the first half of 2023 to the second half. This shows which TLDs were most problematic at different times during the year.
Highlighted in bold in the following table are those TLDs that climbed in the rankings for the percentage of spam and malicious emails from July to December 2023, compared with January to June. Generic TLDs “.uno”, “.makeup” and “.directory” appeared in the top list and in higher positions for the first time in the last six months of the year.
January – June 2023
July – Dec 2023
tld
Spam + malicious %
tld
Spam + malicious %
.click
99%
.uno
99%
.best
99%
.sbs
98%
.yachts
99%
.beauty
97%
.hair
99%
.best
97%
.autos
99%
.makeup
95%
.wiki
98%
.monster
95%
.today
98%
.directory
95%
.mom
98%
.bid
95%
.sbs
97%
.top
93%
.top
97%
.shop
92%
.monster
97%
.today
92%
.beauty
97%
.cam
92%
.bar
96%
.cyou
92%
.rest
95%
.icu
91%
.cam
95%
.boats
88%
.homes
94%
.wiki
88%
.pics
94%
.rest
88%
.lol
94%
.hair
87%
.quest
93%
.fun
87%
.cyou
93%
.cfd
86%
.ink
92%
.skin
85%
.shop
92%
.ltd
84%
.skin
91%
.one
83%
.ltd
91%
.center
83%
.tattoo
91%
.services
81%
.no
90%
.lol
78%
.ml
90%
.wf
78%
.center
90%
.pw
76%
.store
90%
.life
76%
.icu
89%
.click
75%
From the rankings, it’s clear that the recent generic TLDs have the highest spam and malicious percentage of all emails. The top 10 TLDs in both halves of 2023 are all recent and generic, with several introduced since 2021.
Reasons for the prominence of these gTLDs include the availability of domain names that can seem legitimate or mimic well-known brands, as we explain in this blog post. Cybercriminals often use popular or catchy words. Some gTLDs allow anonymous registration. Their low cost and the delay in updated security systems to recognize new gTLDs as spam and malicious sources also play a role — note that, as we’ve seen, cyber criminals also like to change TLDs and methods.
The impact of a lawsuit?
There’s also been a change in the types of domains with the highest malicious percentage in 2023, possibly due to Meta’s lawsuit against Freenom, filed in December 2022 and refiled in March 2023. Freenom provided domain name registry services for free in five ccTLDs, which wound up being used for purposes beyond local businesses or content: “.cf” (Central African Republic), “.ga” (Gabon), “.gq” (Equatorial Guinea), “.ml” (Mali), and “.tk” (Tokelau). However, Freenom stopped new registrations during 2023 following the lawsuit, and in February 2024, announced its decision to exit the domain name business.
Focusing on Freenom TLDs, which appeared in our top 50 ranking only in the first half of 2023, we see a clear shift. Since October, these TLDs have become less relevant in terms of all emails, including malicious and spam percentages. In February 2023, they accounted for 0.17% of all malicious emails we tracked, and 0.04% of all spam and malicious. Their presence has decreased since then, becoming almost non-existent in email volume in September and October, similar to other analyses.
TLDs ordered by volume of spam + malicious
In addition to looking at their share, another way to examine the data is to identify the TLDs that have a higher volume of spam and malicious emails — the next table is ordered that way. This means that we are able to show more familiar (and much older) TLDs, such as “.com”. We’ve included here the percentage of all emails in any given TLD that are classified as spam or malicious, and also spam + malicious to spotlight those that may require more caution. For instance, with high volume “.shop”, “.no”, “.click”, “.beauty”, “.top”, “.monster”, “.autos”, and “.today” stand out with a higher spam and malicious percentage (and also only malicious email percentage).
In the realm of country-code TLDs, Norway’s “.no” leads in spam, followed by China’s “.cn”, Russia’s “.ru”, Ukraine’s “.ua”, and Anguilla’s “.ai”, which recently has been used more for artificial intelligence-related domains than for the country itself.
In bold and red, we’ve highlighted the TLDs where spam + malicious represents more than 20% of all emails in that TLD — already what we consider a high number for domains with a lot of emails.
TLDs with more spam + malicious emails (in volume) in 2023
Rank
TLD
Spam %
Malicious %
Spam + mal %
1
.com
3.6%
0.8%
4.4%
2
.shop
77.8%
16.4%
94.2%
3
.net
2.8%
1.0%
3.9%
4
.no
76.0%
0.3%
76.3%
5
.org
3.3%
1.8%
5.2%
6
.ru
15.2%
7.7%
22.9%
7
.jp
3.4%
2.5%
5.9%
8
.click
60.6%
26.6%
87.2%
9
.beauty
77.0%
19.9%
96.9%
10
.cn
25.9%
3.3%
29.2%
11
.top
73.9%
22.8%
96.6%
12
.monster
79.7%
16.8%
96.5%
13
.de
13.0%
2.1%
15.2%
14
.best
68.1%
29.4%
97.4%
15
.gov
0.6%
2.0%
2.6%
16
.autos
92.6%
2.0%
94.6%
17
.ca
5.2%
0.5%
5.7%
18
.uk
3.2%
0.8%
3.9%
19
.today
91.7%
2.6%
94.3%
20
.io
3.6%
0.5%
4.0%
21
.us
5.7%
1.9%
7.6%
22
.co
6.3%
0.8%
7.1%
23
.biz
27.2%
14.0%
41.2%
24
.edu
0.9%
0.2%
1.1%
25
.info
20.4%
5.4%
25.8%
26
.ai
28.3%
0.1%
28.4%
27
.sbs
63.8%
34.5%
98.3%
28
.it
2.5%
0.3%
2.8%
29
.ua
37.4%
0.6%
38.0%
30
.fr
8.5%
1.0%
9.5%
The curious case of “.gov” email spoofing
When we concentrate our research on message volume to identify TLDs with more malicious emails blocked by our Cloud Email Security service, we discover a trend related to “.gov”.
TLDs ordered by malicious email volume
% of all malicious emails
.com
63%
.net
5%
.shop
5%
.org
3%
.gov
2%
.ru
2%
.jp
2%
.click
1%
.best
0.9%
.beauty
0.8%
The first three domains, “.com” (63%), “.net” (5%), and “.shop” (5%), were previously seen in our rankings and are not surprising. However, in fourth place is “.org”, known for being used by non-profit and other similar organizations, but it has an open registration policy. In fifth place is “.gov”, used only by the US government and administered by CISA. Our investigation suggests that it appears in the ranking because of typical attacks where cybercriminals pretend to be a legitimate address (email spoofing, creation of email messages with a forged sender address). In this case, they use “.gov” when launching attacks.
The spoofing behavior linked to “.gov” is similar to that of other TLDs. It includes fake senders failing SPF validation and other DNS-based authentication methods, along with various other types of attacks. An email failing SPF, DKIM, and DMARC checks typically indicates that a malicious sender is using an unauthorized IP, domain, or both. So, there are more straightforward ways to block spoofed emails without examining their content for malicious elements.
Ranking TLDs by proportions of malicious and spam email in 2023
In this section, we have included two lists: one ranks TLDs by the highest percentage of malicious emails — those you should exercise greater caution with; the second ranks TLDs by just their spam percentage. These contrast with the previous top 50 list ordered by combined spam and malicious percentages. In the case of malicious emails, the top 3 with the highest percentage are all generic TLDs. The #1 was “.bar”, with 70% of all emails being categorized as malicious, followed by “.makeup”, and “.cyou” — marketed as the phrase “see you”.
The malicious list also includes some country-code TLDs (ccTLDs) not primarily used for country-related topics, like .ml (Mali), .om (Oman), and .pw (Palau). The list also includes other ccTLDs such as .ir (Iran) and .kg (Kyrgyzstan), .lk (Sri Lanka).
In the spam realm, it’s “autos”, with 93%, and other generic TLDs such as “.today”, and “.directory” that take the first three spots, also seeing shares over 90%.
2023 ordered by malicious email %
2023 ordered by spam email %
tld
Malicious %
tld
Spam %
.bar
70%
.autos
93%
.makeup
63%
.today
92%
.cyou
62%
.directory
91%
.ml
56%
.boats
87%
.tattoo
54%
.center
85%
.om
47%
.monster
80%
.cfd
46%
.lol
79%
.skin
39%
.hair
78%
.uno
37%
.shop
78%
.pw
37%
.beauty
77%
.sbs
35%
.no
76%
.site
31%
.wf
76%
.store
31%
.icu
75%
.best
29%
.bid
74%
.ir
29%
.rest
74%
.lk
27%
.top
74%
.work
27%
.bio
72%
.click
27%
.ltd
70%
.wiki
26%
.wiki
69%
.live
26%
.best
68%
.cam
25%
.ink
68%
.lat
24%
.cam
67%
.yachts
23%
.services
67%
.top
23%
.tk
66%
.world
21%
.sbs
64%
.fun
21%
.fun
64%
.beauty
20%
.one
63%
.mobi
19%
.mom
63%
.kg
19%
.uno
62%
.hair
18%
.homes
62%
How it stands in 2024: new higher-risk TLDs
2024 has seen new players enter the high-risk zone for unwanted emails. In this list we have only included the new TLDs that weren’t in the top 50 during 2023, and joined the list in January. New entrants include Samoa’s “.ws”, Indonesia’s “.id” (also used because of its “identification” meaning), and the Cocos Islands’ “.cc”. These ccTLDs, often used for more than just country-related purposes, have shown high percentages of malicious emails, ranging from 20% (.cc) to 95% (.ws) of all emails.
January 2024: Newer TLDs in the top 50 list
TLD
Spam %
Malicious %
Spam + mal %
.ws
3%
95%
98%
.company
96%
0%
96%
.digital
72%
2%
74%
.pro
66%
6%
73%
.tz
62%
4%
65%
.id
13%
39%
51%
.cc
25%
21%
46%
.space
32%
8%
40%
.enterprises
2%
37%
40%
.lv
30%
1%
30%
.cn
26%
3%
29%
.jo
27%
1%
28%
.info
21%
5%
26%
.su
20%
5%
25%
.ua
23%
1%
24%
.museum
0%
24%
24%
.biz
16%
7%
24%
.se
23%
0%
23%
.ai
21%
0%
21%
Overview of email threat trends since 2023
With Cloudflare’s Cloud Email Security, we gain insight into the broader email landscape over the past months. The spam percentage of all emails stood at 8.58% in 2023. As mentioned before, keep in mind with these percentages that our protection typically kicks in after other email providers’ filters have already removed some spam and malicious emails.
How about malicious emails? Almost 3% of all emails were flagged as malicious during 2023, with the highest percentages occurring in Q4. Here’s the “malicious” evolution, where we’re also including the January and February 2024 perspective:
The week before Christmas and the first week of 2024 experienced a significant spike in malicious emails, reaching an average of 7% and 8% across the weeks, respectively. Not surprisingly, there was a noticeable decrease during Christmas week, when it dropped to 3%. Other significant increases in the percentage of malicious emails were observed the week before Valentine’s Day, the first week of September (coinciding with returns to work and school in the Northern Hemisphere), and late October.
Threat categories in 2023
We can also look to different types of threats in 2023. Links were present in 49% of all threats. Other categories included extortion (36%), identity deception (27%), credential harvesting (23%), and brand impersonation (18%). These categories are defined and explored in detail in Cloudflare’s 2023 phishing threats report. Extortion saw the most growth in Q4, especially in November and December reaching 38% from 7% of all threats in Q1 2023.
Other trends: Attachments are still popular
Other less “threatening” trends show that 20% of all emails included attachments (as the next chart shows), while 82% contained links in the body. Additionally, 31% were composed in plain text, and 18% featured HTML, which allows for enhanced formatting and visuals. 39% of all emails used remote content.
Conclusion: Be cautious, prepared, safe
The landscape of spam and malicious (or phishing) emails constantly evolves alongside technology, the Internet, user behaviors, use cases, and cybercriminals. As we’ve seen through Cloudflare’s Cloud Email Security insights, new generic TLDs have emerged as preferred channels for these malicious activities, highlighting the need for vigilance when dealing with emails from unfamiliar domains.
There’s no shortage of advice on staying safe from phishing. Email remains a ubiquitous yet highly exploited tool in daily business operations. Cybercriminals often bait users into clicking malicious links within emails, a tactic used by both sophisticated criminal organizations and novice attackers. So, always exercise caution online.
Cloudflare’s Cloud Email Security provides insights that underscore the importance of robust cybersecurity infrastructure in fighting the dynamic tactics of phishing attacks.
Storage, storage, storage! Last week, we celebrated 18 years of innovation on Amazon Simple Storage Service (Amazon S3) at AWS Pi Day 2024. Amazon S3 mascot Buckets joined the celebrations and had a ton of fun! The 4-hour live stream was packed with puns, pie recipes powered by PartyRock, demos, code, and discussions about generative AI and Amazon S3.
AWS Pi Day 2024 — Twitch live stream on March 14, 2024
Up to 40 percent faster stack creation with AWS CloudFormation — AWS CloudFormation now creates stacks up to 40 percent faster and has a new event called CONFIGURATION_COMPLETE. With this event, CloudFormation begins parallel creation of dependent resources within a stack, speeding up the whole process. The new event also gives users more control to shortcut their stack creation process in scenarios where a resource consistency check is unnecessary. To learn more, read this AWS DevOps Blog post.
Amazon SageMaker Canvas extends its model registry integration — SageMaker Canvas has extended its model registry integration to include time series forecasting models and models fine-tuned through SageMaker JumpStart. Users can now register these models to the SageMaker Model Registry with just a click. This enhancement expands the model registry integration to all problem types supported in Canvas, such as regression/classification tabular models and CV/NLP models. It streamlines the deployment of machine learning (ML) models to production environments. Check the Developer Guide for more information.
Amazon S3 Connector for PyTorch — The Amazon S3 Connector for PyTorch now lets PyTorch Lightning users save model checkpoints directly to Amazon S3. Saving PyTorch Lightning model checkpoints is up to 40 percent faster with the Amazon S3 Connector for PyTorch than writing to Amazon Elastic Compute Cloud (Amazon EC2) instance storage. You can now also save, load, and delete checkpoints directly from PyTorch Lightning training jobs to Amazon S3. Check out the open source project on GitHub.
AWS open source news and updates — My colleague Ricardo writes this weekly open source newsletter in which he highlights new open source projects, tools, and demos from the AWS Community.
Upcoming AWS events Check your calendars and sign up for these AWS events:
AWS at NVIDIA GTC 2024 — The NVIDIA GTC 2024 developer conference is taking place this week (March 18–21) in San Jose, CA. If you’re around, visit AWS at booth #708 to explore generative AI demos and get inspired by AWS, AWS Partners, and customer experts on the latest offerings in generative AI, robotics, and advanced computing at the in-booth theatre. Check out the AWS sessions and request 1:1 meetings.
AWS Summits — It’s AWS Summit season again! The first one is Paris (April 3), followed by Amsterdam (April 9), Sydney (April 10–11), London (April 24), Berlin (May 15–16), and Seoul (May 16–17). AWS Summits are a series of free online and in-person events that bring the cloud computing community together to connect, collaborate, and learn about AWS.
AWS re:Inforce — Join us for AWS re:Inforce (June 10–12) in Philadelphia, PA. AWS re:Inforce is a learning conference focused on AWS security solutions, cloud security, compliance, and identity. Connect with the AWS teams that build the security tools and meet AWS customers to learn about their security journeys.
Let’s Encrypt, a publicly trusted certificate authority (CA) that Cloudflare uses to issue TLS certificates, has been relying on two distinct certificate chains. One is cross-signed with IdenTrust, a globally trusted CA that has been around since 2000, and the other is Let’s Encrypt’s own root CA, ISRG Root X1. Since Let’s Encrypt launched, ISRG Root X1 has been steadily gaining its own device compatibility.
On September 30, 2024, Let’s Encrypt’s certificate chain cross-signed with IdenTrust will expire. To proactively prepare for this change, on May 15, 2024, Cloudflare will stop issuing certificates from the cross-signed chain and will instead use Let’s Encrypt’s ISRG Root X1 chain for all future Let’s Encrypt certificates.
The change in the certificate chain will impact legacy devices and systems, such as Android devices version 7.1.1 or older, as those exclusively rely on the cross-signed chain and lack the ISRG X1 root in their trust store. These clients may encounter TLS errors or warnings when accessing domains secured by a Let’s Encrypt certificate.
According to Let’s Encrypt, more than 93.9% of Android devices already trust the ISRG Root X1 and this number is expected to increase in 2024, especially as Android releases version 14, which makes the Android trust store easily and automatically upgradable.
We took a look at the data ourselves and found that, from all Android requests, 2.96% of them come from devices that will be affected by the change. In addition, only 1.13% of all requests from Firefox come from affected versions, which means that most (98.87%) of the requests coming from Android versions that are using Firefox will not be impacted.
Preparing for the change
If you’re worried about the change impacting your clients, there are a few things that you can do to reduce the impact of the change. If you control the clients that are connecting to your application, we recommend updating the trust store to include the ISRG Root X1. If you use certificate pinning, remove or update your pin. In general, we discourage all customers from pinning their certificates, as this usually leads to issues during certificate renewals or CA changes.
If you experience issues with the Let’s Encrypt chain change, and you’re using Advanced Certificate Manager or SSL for SaaS on the Enterprise plan, you can choose to switch your certificate to use Google Trust Services as the certificate authority instead.
While this change will impact a very small portion of clients, we support the shift that Let’s Encrypt is making as it supports a more secure and agile Internet.
Embracing change to move towards a better Internet
Looking back, there were a number of challenges that slowed down the adoption of new technologies and standards that helped make the Internet faster, more secure, and more reliable.
For starters, before Cloudflare launched Universal SSL, free certificates were not attainable. Instead, domain owners had to pay around $100 to get a TLS certificate. For a small business, this is a big cost and without browsers enforcing TLS, this significantly hindered TLS adoption for years. Insecure algorithms have taken decades to deprecate due to lack of support of new algorithms in browsers or devices. We learned this lesson while deprecating SHA-1.
Supporting new security standards and protocols is vital for us to continue improving the Internet. Over the years, big and sometimes risky changes were made in order for us to move forward. The launch of Let’s Encrypt in 2015 was monumental. Let’s Encrypt allowed every domain to get a TLS certificate for free, which paved the way to a more secure Internet, with now around 98% of traffic using HTTPS.
In 2014, Cloudflare launched elliptic curve digital signature algorithm (ECDSA) support for Cloudflare-issued certificates and made the decision to issue ECDSA-only certificates to free customers. This boosted ECDSA adoption by pressing clients and web operators to make changes to support the new algorithm, which provided the same (if not better) security as RSA while also improving performance. In addition to that, modern browsers and operating systems are now being built in a way that allows them to constantly support new standards, so that they can deprecate old ones.
For us to move forward in supporting new standards and protocols, we need to make the Public Key Infrastructure (PKI) ecosystem more agile. By retiring the cross-signed chain, Let’s Encrypt is pushing devices, browsers, and clients to support adaptable trust stores. This allows clients to support new standards without causing a breaking change. It also lays the groundwork for new certificate authorities to emerge.
Today, one of the main reasons why there’s a limited number of CAs available is that it takes years for them to become widely trusted, that is, without cross-signing with another CA. In 2017, Google launched a new publicly trusted CA, Google Trust Services, that issued free TLS certificates. Even though they launched a few years after Let’s Encrypt, they faced the same challenges with device compatibility and adoption, which caused them to cross-sign with GlobalSign’s CA. We hope that, by the time GlobalSign’s CA comes up for expiration, almost all traffic is coming from a modern client and browser, meaning the change impact should be minimal.
This alignment with DESC requirements demonstrates our continuous commitment to adhere to the heightened expectations for CSPs. Government customers of AWS can run their applications in AWS Cloud-certified Regions with confidence.
The independent third-party auditor BSI evaluated AWS on behalf of DESC on January 23, 2024. The Certificate of Compliance that illustrates the compliance status of AWS is available through AWS Artifact. AWS Artifact is a self-service portal for on-demand access to AWS compliance reports. Sign in to AWS Artifact in the AWS Management Console, or learn more at Getting Started with AWS Artifact.
The certification includes 25 additional services in scope, for a total of 87 services. This is a 40% increase in the number of services in the Middle East (UAE) Region that are in scope of the DESC CSP certification. For up-to-date information, including when additional services are added, see the AWS Services in Scope by Compliance Program webpage and choose DESC CSP.
AWS strives to continuously bring services into the scope of its compliance programs to help you meet your architectural and regulatory needs. If you have questions or feedback about DESC compliance, reach out to your AWS account team.
To learn more about our compliance and security programs, see AWS Compliance Programs. As always, we value your feedback and questions; reach out to the AWS Compliance team through the Contact Us page.
If you have feedback about this post, submit comments in the Comments section below.
The IAR provides management and technical information security controls to help establish, implement, maintain, and continuously improve information assurance. AWS alignment with IAR requirements demonstrates our ongoing commitment to adhere to the heightened expectations for cloud service providers. As such, IAR-regulated customers can continue to use AWS services with confidence.
Independent third-party auditors from BDO evaluated AWS for the period of November 1, 2022, to October 31, 2023. The assessment report that illustrates the status of AWS compliance is available through AWS Artifact. AWS Artifact is a self-service portal for on-demand access to AWS compliance reports. Sign in to AWS Artifact in the AWS Management Console, or learn more at Getting Started with AWS Artifact.
AWS strives to continuously bring services into the scope of its compliance programs to help you meet your architectural and regulatory needs. If you have questions or feedback about IAR compliance, reach out to your AWS account team.
To learn more about our compliance and security programs, see AWS Compliance Programs. As always, we value your feedback and questions; reach out to the AWS Compliance team through the Contact Us page.
If you have feedback about this post, submit comments in the Comments section below.
Today, we are excited to announce beta availability of Log Explorer, which allows you to investigate your HTTP and Security Event logs directly from the Cloudflare Dashboard. Log Explorer is an extension of Security Analytics, giving you the ability to review related raw logs. You can analyze, investigate, and monitor for security attacks natively within the Cloudflare Dashboard, reducing time to resolution and overall cost of ownership by eliminating the need to forward logs to third party security analysis tools.
Background
Security Analytics enables you to analyze all of your HTTP traffic in one place, giving you the security lens you need to identify and act upon what matters most: potentially malicious traffic that has not been mitigated. Security Analytics includes built-in views such as top statistics and in-context quick filters on an intuitive page layout that enables rapid exploration and validation.
In order to power our rich analytics dashboards with fast query performance, we implemented data sampling using Adaptive Bit Rate (ABR) analytics. This is a great fit for providing high level aggregate views of the data. However, we received feedback from many Security Analytics power users that sometimes they need access to a more granular view of the data — they need logs.
Logs provide critical visibility into the operations of today’s computer systems. Engineers and SOC analysts rely on logs every day to troubleshoot issues, identify and investigate security incidents, and tune the performance, reliability, and security of their applications and infrastructure. Traditional metrics or monitoring solutions provide aggregated or statistical data that can be used to identify trends. Metrics are wonderful at identifying THAT an issue happened, but lack the detailed events to help engineers uncover WHY it happened. Engineers and SOC Analysts rely on raw log data to answer questions such as:
What is causing this increase in 403 errors?
What data was accessed by this IP address?
What was the user experience of this particular user’s session?
Traditionally, these engineers and analysts would stand up a collection of various monitoring tools in order to capture logs and get this visibility. With more organizations using multiple clouds, or a hybrid environment with both cloud and on-premise tools and architecture, it is crucial to have a unified platform to regain visibility into this increasingly complex environment. As more and more companies are moving towards a cloud native architecture, we see Cloudflare’s connectivity cloud as an integral part of their performance and security strategy.
Log Explorer provides a lower cost option for storing and exploring log data within Cloudflare. Until today, we have offered the ability to export logs to expensive third party tools, and now with Log Explorer, you can quickly and easily explore your log data without leaving the Cloudflare Dashboard.
Log Explorer Features
Whether you’re a SOC Engineer investigating potential incidents, or a Compliance Officer with specific log retention requirements, Log Explorer has you covered. It stores your Cloudflare logs for an uncapped and customizable period of time, making them accessible natively within the Cloudflare Dashboard. The supported features include:
Searching through your HTTP Request or Security Event logs
Filtering based on any field and a number of standard operators
Switching between basic filter mode or SQL query interface
Selecting fields to display
Viewing log events in tabular format
Finding the HTTP request records associated with a Ray ID
Narrow in on unmitigated traffic
As a SOC analyst, your job is to monitor and respond to threats and incidents within your organization’s network. Using Security Analytics, and now with Log Explorer, you can identify anomalies and conduct a forensic investigation all in one place.
Let’s walk through an example to see this in action:
On the Security Analytics dashboard, you can see in the Insights panel that there is some traffic that has been tagged as a likely attack, but not mitigated.
Clicking the filter button narrows in on these requests for further investigation.
In the sampled logs view, you can see that most of these requests are coming from a common client IP address.
You can also see that Cloudflare has flagged all of these requests as bot traffic. With this information, you can craft a WAF rule to either block all traffic from this IP address, or block all traffic with a bot score lower than 10.
Let’s say that the Compliance Team would like to gather documentation on the scope and impact of this attack. We can dig further into the logs during this time period to see everything that this attacker attempted to access.
First, we can use Log Explorer to query HTTP requests from the suspect IP address during the time range of the spike seen in Security Analytics.
We can also review whether the attacker was able to exfiltrate data by adding the OriginResponseBytes field and updating the query to show requests with OriginResponseBytes > 0. The results show that no data was exfiltrated.
Find and investigate false positives
With access to the full logs via Log Explorer, you can now perform a search to find specific requests.
A 403 error occurs when a user’s request to a particular site is blocked. Cloudflare’s security products use things like IP reputation and WAF attack scores based on ML technologies in order to assess whether a given HTTP request is malicious. This is extremely effective, but sometimes requests are mistakenly flagged as malicious and blocked.
In these situations, we can now use Log Explorer to identify these requests and why they were blocked, and then adjust the relevant WAF rules accordingly.
Or, if you are interested in tracking down a specific request by Ray ID, an identifier given to every request that goes through Cloudflare, you can do that via Log Explorer with one query.
Note that the LIMIT clause is included in the query by default, but has no impact on RayID queries as RayID is unique and only one record would be returned when using the RayID filter field.
How we built Log Explorer
With Log Explorer, we have built a long-term, append-only log storage platform on top of Cloudflare R2. Log Explorer leverages the Delta Lake protocol, an open-source storage framework for building highly performant, ACID-compliant databases atop a cloud object store. In other words, Log Explorer combines a large and cost-effective storage system – Cloudflare R2 – with the benefits of strong consistency and high performance. Additionally, Log Explorer gives you a SQL interface to your Cloudflare logs.
Each Log Explorer dataset is stored on a per-customer level, just like Cloudflare D1, so that your data isn’t placed with that of other customers. In the future, this single-tenant storage model will give you the flexibility to create your own retention policies and decide in which regions you want to store your data.
Under the hood, the datasets for each customer are stored as Delta tables in R2 buckets. A Delta table is a storage format that organizes Apache Parquet objects into directories using Hive’s partitioning naming convention. Crucially, Delta tables pair these storage objects with an append-only, checkpointed transaction log. This design allows Log Explorer to support multiple writers with optimistic concurrency.
Many of the products Cloudflare builds are a direct result of the challenges our own team is looking to address. Log Explorer is a perfect example of this culture of dogfooding. Optimistic concurrent writes require atomic updates in the underlying object store, and as a result of our needs, R2 added a PutIfAbsent operation with strong consistency. Thanks, R2! The atomic operation sets Log Explorer apart from Delta Lake solutions based on Amazon Web Services’ S3, which incur the operational burden of using an external store for synchronizing writes.
Log Explorer is written in the Rust programming language using open-source libraries, such as delta-rs, a native Rust implementation of the Delta Lake protocol, and Apache Arrow DataFusion, a very fast, extensible query engine. At Cloudflare, Rust has emerged as a popular choice for new product development due to its safety and performance benefits.
What’s next
We know that application security logs are only part of the puzzle in understanding what’s going on in your environment. Stay tuned for future developments including tighter, more seamless integration between Analytics and Log Explorer, the addition of more datasets including Zero Trust logs, the ability to define custom retention periods, and integrated custom alerting.
Please use the feedback link to let us know how Log Explorer is working for you and what else would help make your job easier.
How to get it
We’d love to hear from you! Let us know if you are interested in joining our Beta program by completing this form and a member of our team will contact you.
Pricing will be finalized prior to a General Availability (GA) launch.
Tune in for more news, announcements and thought-provoking discussions! Don’t miss the full Security Week hub page.
Cloudforce One is our threat operations and research team. Its primary objective: track and disrupt threat actors targeting Cloudflare and the customer systems we protect. Cloudforce One customers can engage directly with analysts on the team to help understand and stop the specific threats targeting them.
Today, we are releasing in general availability two new tools that will help Cloudforce One customers get the best value out of the service by helping us prioritize and organize the information that matters most to them: Requests for Information (RFIs) and Priority Intelligence Requirements (PIRs). We’d also like to review how we’ve used the Cloudflare Workers and Pages platform to build our internal pipeline to not only perform investigations on behalf of our customers, but conduct our own internal investigations of the threats and attackers we track.
What are Requests for Information (RFIs)?
RFIs are designed to streamline the process of accessing critical intelligence. They provide an avenue for users to submit specific queries and requests directly into Cloudforce One’s analysis queue. Essentially, they are a well-structured way for you to tell the team what to focus their research on to best support your security posture.
Each RFI filed is routed to an analyst and treated as a targeted call for information on specific threat elements. From malware analysis to DDoS attack analysis, we have a group of seasoned threat analysts who can provide deeper insight into a wide array of attacks. Those who have found RFIs invaluable typically belong to Security Operation Centers, Incident Response Teams, and Threat Research/Intelligence teams dedicated to supporting internal investigations within an organization. This approach proves instrumental in unveiling potential vulnerabilities and enhancing the understanding of the security posture, especially when confronting complex risks.
Creating an RFI is straightforward. Through the Security Center dashboard, users can create and track their RFIs:
Submission: Submit requests via Cloudforce One RFI Dashboard:
a. Threat: The threat or campaign you would like more information on
b. Priority: routine, high or urgent
c. Type: Binary Analysis, Indicator Analysis, Traffic Analysis, Threat Detection Signature, Passive DNS Resolution, DDoS Attack or Vulnerability
d. Output: Malware Analysis Report, Indicators of Compromise, or Threat Research Report
Tracking: Our Threat Research team begins work and the customer can track progress (open, in progress, pending, published, complete) via the RFI Dashboard. Automated alerts are sent to the customer with each status change.
Delivery: Customers can access/download the RFI response via the RFI Dashboard.
Fabricated example of the detailed view of an RFI and communication with the Cloudflare Threat Research Team
Once an RFI is submitted, teams can stay informed about the progress of their requests through automated alerts. These alerts, generated when a Cloudforce One analyst has completed the request, are delivered directly to the user’s email or to a team chat channel via a webhook.
What are Priority Intelligence Requirements (PIRs)?
Priority Intelligence Requirements (PIRs) are a structured approach to identifying intelligence gaps, formulating precise requirements, and organizing them into categories that align with Cloudforce One’s overarching goals. For example, you can create a PIR signaling to the Cloudforce One team what topic you would like more information on.
PIR dashboard with fictitious examples of priority intelligence requirements
PIRs help target your intelligence collection efforts toward the most relevant insights, enabling you to make informed decisions and strengthen your organization’s cybersecurity posture.
While PIRs currently offer a framework for prioritizing intelligence requirements, our vision extends beyond static requirements. Looking ahead, our plan is to evolve PIRs into dynamic tools that integrate real-time intelligence from Cloudforce One. Enriching PIRs by integrating them with real-time intelligence from Cloudforce One will provide immediate insights into your Cloudflare environment, facilitating a direct and meaningful connection between ongoing threat intelligence and your predefined intelligence needs.
What drives Cloudforce One?
Since our inception, Cloudforce One has been actively collaborating with our Security Incident Response Team (SIRT) and Trust and Safety (T&S) team, aiming to provide valuable insights into attacks targeting Cloudflare and counteract the misuse of Cloudflare services. Throughout these investigations, we recognized the need for a centralized platform to capture insights from Cloudflare’s unique perspective on the Internet, aggregate data, and correlate reports.
In the past, our approach would have involved deploying a frontend UI and backend API in a core data center, leveraging common services like Postgres, Redis, and a Ceph storage solution. This conventional route would have entailed managing Docker deployments, constantly upgrading hosts for vulnerabilities, and dealing with a complex environment where we must juggle secrets, external service configurations, and maintaining availability.
Instead, we welcomed being Customer Zero for Cloudflare and fully embraced Cloudflare’s Workers and Pages platforms to construct a powerful threat investigation tool, and since then, we haven’t looked back. For anyone that has used Workers in the past, much of what we have done is not revolutionary, but almost commonplace given the ease of configuring and implementing the features in Cloudflare Workers. We routinely store file data in R2, metadata in KV, and indexed data in D1. That being said, we do have a few non-standard deployments as well, further outlined below.
Altogether, our Threats Investigation architecture consists of five services, four of which are deployed at the edge with the other one deployed in our core data centers due to data dependency constraints.
RFIs & PIRs: This API manages our formal Cloudforce One requests and customer priorities submitted via the Cloudflare Dashboard.
Threats: Our UI, deployed via Pages, serves as the interface for interacting with all of our Cloudforce One services, Cloudflare internal services, and the RFIs and PIRs submitted by our customers.
Cases: A case management system that allows analysts to store notes, Indicators of Compromise (IOCs), malware samples, and data analytics related to an attack. The service provides live updates to all analysts viewing the case, facilitating real-time collaboration. Each case is a Durable Object that is connected to via a Websocket that stores “files” and “file content” in the Durable Object’s persistent storage. Metadata for the case is made searchable via D1.
Leads: A queue of informal internal and external requests that may be reviewed by Cloudforce One when doing threat hunting discovery. Lead content is stored into KV, while metadata and extracted IOCs are stored in D1.
Binary DB:A raw binary file warehouse for any file we come across during our investigation. Binary DB also serves as the repository for malware samples used in some of our machine learning training. Each file is stored in R2, with its associated metadata stored in KV.
Cloudforce One Threat Investigation Architecture
At the heart of our Threats ecosystem is our case management service built on Workers and Durable Objects. We were inspired to build this tool because we often had to jump into collaborative documents that were not designed to store forensic data, organize it, mark sections with Traffic Light Protocol (TLP) releasability codes, and relate analysis to existing RFIs or Leads.
Our concept of cases is straightforward — each case is a Durable Object that can accept HTTP REST API or WebSocket connections. Upon initiating a WebSocket connection, it is seamlessly incorporated into the Durable Object’s in-memory state, allowing us to instantly broadcast real-time events to all users engaged with the case. Each case comprises distinct folders, each housing a collection of files containing content, releasability information, and file metadata.
Practically, our Durable Object leverages its persistent storage with each storage key prefixed with the value type: “case”, “folder”, or “file” followed by the UUID assigned to the file. Each case value has metadata associated with the case and a list of folders that belong to the case. Each folder has the folder’s name and a list of files that belong to it.
Our internal Threats UI helps us tie together the service integrations with our threat hunting analysis. It is here we do our day-to-day work which allows us to bring our unique insights into Cloudflare attacks. Below is an example of our Case Management in action where we tracked the RedAlerts attack before we formalized our analysis into the blog.
What good is all of this if we can’t search it? The Workers AI team launched Vectorize and enabled inference on the edge, so we decided to go all in on Workers and began indexing all case files as they’re being edited so that they can be searched. As each case file is being updated in the Durable Object, the content of the file is pushed to Cloudflare Queues. This data is consumed by an indexing engine consumer that does two things: extracts and indexes indicators of compromise, and embeds the content into a vector and pushes it into Vectorize. Both of the search mechanisms also pass the reference case and file identifiers so that the case may be found upon searching.
Given how easy it is to set up Workers AI, we took the final step of implementing a full Retrieval Augmented Generation (RAG) AI to allow analysts to ask questions about our previous analysis. Each question undergoes the same process as the content that is indexed. We pull out any indicators of compromise and embed the question into a vector, so we can use both results to search our indexes and Vectorize respectively, and provide the most relevant results for the request. Lastly, we send the vector data to a text-generation model using Workers AI that then returns a response to our analysts.
Using RFIs and PIRs
Imagine submitting an RFI for “Passive DNS Resolution – IOCs” and receiving real-time updates directly within the PIR, guiding your next steps.
Our workflow ensures that the intelligence you need is not only obtained but also used optimally. This approach empowers your team to tailor your intelligence gathering, strengthening your cybersecurity strategy and security posture.
Our mission for Cloudforce One is to equip organizations with the tools they need to stay one step ahead in the rapidly changing world of cybersecurity. The addition of RFIs and PIRs marks another milestone in this journey, empowering users with enhanced threat intelligence capabilities.
Getting started
Cloudforce One customers can already see the PIR and RFI Dashboard in their Security Center, and they can also use the API if they prefer that option. Click to see more documentation about our RFI and our PIR APIs.
If you’re looking to try out the new RFI and PIR capabilities within the Security Center, contact your Cloudflare account team or fill out this form and someone will be in touch. Finally, if you’re interested in joining the Cloudflare team, check out our open job postings here.
Today, we’re excited to talk about URL Scanner, a tool that helps everyone from security teams to everyday users to detect and safeguard against malicious websites by scanning and analyzing them. URL Scanner has executed almost a million scans since its launch last March on Cloudflare Radar, driving us to continuously innovate and enhance its capabilities. Since that time, we have introduced unlisted scans, detailed malicious verdicts, enriched search functionality, and now, integration with Security Center and an official API, all built upon the robust foundation of Cloudflare Workers, Durable Objects, and the Browser Rendering API.
Integration with the Security Center in the Cloudflare Dashboard
Security Center is the single place in the Cloudflare Dashboard to map your attack surface, identify potential security risks, and mitigate risks with a few clicks. Its users can now access the URL scanner directly from the Investigate Portal, enhancing their cybersecurity workflow. These scans will be unlisted by default, ensuring privacy while facilitating a deep dive into website security. Users will be able to see their historic scans and access the related reports when they need to, and they will benefit from automatic screenshots for multiple screen sizes, enriching the context of each scan.
Customers with Cloudflare dashboard access will enjoy higher API limits and faster response times, crucial for agile security operations. Integration with internal workflows becomes seamless, allowing for sophisticated network and user protection strategies.
Security Center in the Cloudflare Dashboard
Unlocking the potential of the URL Scanner API
The URL Scanner API is a powerful asset for developers, enabling custom scans to detect phishing or malware risks, analyze website technologies, and much more. With new features like custom HTTP headers and multi-device screenshots, developers gain a comprehensive toolkit for thorough website assessment.
Submitting a scan request
Using the API, here’s the simplest way to submit a scan request:
New features include the option to set custom HTTP headers, like User-Agent and Authorization, request multiple target device screenshots, like mobile and desktop, as well as set the visibility level to “unlisted”. This essentially marks the scan as private and was often requested by developers who wanted to keep their investigations confidential. Public scans, on the other hand, can be found by anyone through search and are useful to share results with the wider community. You can find more details in our developer documentation.
Once a scan concludes, fetch the final report and the full network log. Recently added features include the `verdict` property, indicating the site’s malicious status, and the `securityViolations` section detailing CSP or SRI policy breaches — as a developer, you can also scan your own website and see our recommendations. Expect improvements on verdict accuracy over time, as this is an area we’re focusing on.
Enhanced search functionality
Developers can now search scans by hostname, a specific URL or even any URL the page connected to during the scan. This allows, for example, to search for websites that use a JavaScript library named jquery.min.js (‘?path=jquery.min.js’). Future plans include additional features like searching by IP address, ASN, and malicious website categorisation.
The URL Scanner can be used for a diverse range of applications. These include capturing a website’s evolving state over time (such as tracking changes to the front page of an online newspaper), analyzing technologies employed by a website, preemptively assessing potential risks (as when scrutinizing shortened URLs), and supporting the investigation of persistent cybersecurity threats (such as identifying affected websites hosting a malicious JavaScript file).
How we built the URL Scanner API
In recounting the process of developing the URL Scanner, we aim to showcase the potential and versatility of Cloudflare Workers as a platform. This story is more than a technical journey, but a testament to the capabilities inherent in our platform’s suite of APIs. By dogfooding our own technology, we not only demonstrate confidence in its robustness but also encourage developers to harness the same capabilities for building sophisticated applications. The URL Scanner exemplifies how Cloudflare Workers, Durable Objects, and the Browser Rendering API seamlessly integrate.
High level overview of theCloudflare URL Scanner technology stack
As seen above, Cloudflare’s runtime infrastructure is the foundation the system runs on. Cloudflare Workers serves the public API, Durable Objects handles orchestration, R2 acts as the primary storage solution, and Queues efficiently handles batch operations, all at the edge. However, what truly enables the URL Scanner’s capabilities is the Browser Rendering API. It’s what initially allowed us to release in such a short time frame, since we didn’t have to build and manage an entire fleet of Chrome browsers from scratch. We simply request a browser, and then using the well known Puppeteer library, instruct it to fetch the webpage and process it in the way we want. This API is at the heart of the entire system.
Scanning a website
The entire process of scanning a website, can be split into 4 phases:
Queue a scan
Browse to the website and compile initial report
Post-process: compile additional information and build final report
Store final report, ready for serving and searching
In short, we create a Durable Object, the Scanner, unique to each scan, which is responsible for orchestrating the scan from start to finish. Since we want to respond immediately to the user, we save the scan to the Durable Object’s transactional Key-Value storage, and schedule an alarm so we can perform the scan asynchronously a second later. We then respond to the user, informing them that the scan request was accepted.
When the Scanner’s alarm triggers, we enter the second phase:
There are 3 components at work in this phase, the Scanner, the Browser Pool and the Browser Controller, all Durable Objects.
In the initial release, for each new scan we would launch a brand-new browser. However, This operation would take time and was inefficient, so after review, we decided to reuse browsers across multiple scans. This is why we introduced both the Browser Pool and the Browser Controller components. The Browser Pool keeps track of what browsers we have open, when they last pinged the browser pool (so it knows they’re alive), and whether they’re free to accept a new scan. The Browser Controller is responsible for keeping the browser instance alive, once it’s launched, and orchestrating (ahem, puppeteering) the entire browsing session. Here’s a simplified version of our Browser Controller code:
export class BrowserController implements DurableObject {
	//[..]
	private async handleNewScan(url: string) {
		if (!this.browser) {
			// Launch browser: 1st request to durable object
			this.browser = await puppeteer.launch(this.env.BROWSER)
			await this.state.storage.setAlarm(Date.now() + 5 * 1000)
		}
		// Open new page and navigate to url
		const page = await this.browser.newPage()
		await page.goto(url, { waitUntil: 'networkidle2', timeout: 5000, })

		// Capture DOM
		const dom = await page.content()

		// Clean up
		await page.close()

		return {
			dom: dom,
		}
	}

	async alarm() {
		if (!this.browser) {
			return
		}
		await this.browser.version() // stop websocket connection to Chrome from going idle

		// ping browser pool, let it know we're alive

		// Keep durable object alive
		await this.state.storage.setAlarm(Date.now() + 5 * 1000)
	}
}
Launching a browser (Step 6) and maintaining a connection to it is abstracted away from us thanks to the Browser Rendering API. This API is responsible for all the infrastructure required to maintain a fleet of Chrome browsers, and led to a much quicker development and release of the URL Scanner. It also allowed us to use a well-known library, Puppeteer, to communicate with Google Chrome via the DevTools protocol.
The initial report is made up of the network log of all requests, captured in HAR (HTTP Archive) format. HAR files, essentially JSON files, provide a detailed record of all interactions between a web browser and a website. As an established standard in the industry, HAR files can be easily shared and analyzed using specialized tools. In addition to this network log, we augment our dataset with an array of other metadata, including base64-encoded screenshots which provide a snapshot of the website at the moment of the scan.
Having this data, we transition to phase 3, where the Scanner Durable Object initiates a series of interactions with a few other Cloudflare APIs in order to collect additional information, like running a phishing scanner over the web page’s Document Object Model (DOM), fetching DNS records, and extracting information about categories and Radar rank associated with the main hostname.
This process ensures that the final report is enriched with insights coming from different sources, making the URL Scanner more efficient in assessing websites. Once all the necessary information is collected, we compile the final report and store it as a JSON file within R2, Cloudflare’s object storage solution. To empower users with efficient scan searches, we use Postgres.
While the initial approach involved sending each completed scan promptly to the core API for immediate storage in Postgres, we realized that, as the rate of scans grew, a more efficient strategy would be to batch those operations, and for that, we use Worker Queues:
This allows us to better manage the write load on Postgres. We wanted scans available as soon as possible to those who requested them, but it’s ok if they’re only available in search results at a slightly later point in time (seconds to minutes, depending on load).
In short, Durable Objects together with the Browser Rendering API power the entire scanning process. Once that’s finished, the Cloudflare Worker serving the API will simply fetch it from R2 by ID. All together, Workers, Durable Objects, and R2 scale seamlessly and will allow us to grow as demand evolves.
Last but not least
While we’ve extensively covered the URL scanning workflow, we’ve yet to delve into the construction of the API worker itself. Developed with Typescript, it uses itty-router-openapi, a Javascript router with Open API 3 schema generation and validation, originally built for Radar, but that’s been improving ever since with contributions from the community. Here’s a quick example of how to set up an endpoint, with input validation built in:
In the example above, the ScanMetadataCreate endpoint will make sure to validate the incoming POST data to match the defined schema before calling the ‘async handle(request,env,context,data)’ function. This way you can be sure that if your code is called, the data argument will always be validated and formatted.
You can learn more about the project on its GitHub page.
Future plans and new features
Looking ahead, we’re committed to further elevating the URL Scanner’s capabilities. Key upcoming features include geographic scans, where users can customize the location that the scan is done from, providing critical insights into regional security threats and content compliance; expanded scan details, including more comprehensive headers and security details; and continuous performance improvements and optimisations, so we can deliver faster scan results.
The evolution of the URL Scanner is a reflection of our commitment to Internet safety and innovation. Whether you’re a developer, a security professional, or simply invested in the safety of the digital landscape, the URL Scanner API offers a comprehensive suite of tools to enhance your efforts. Explore the new features today, and join us in shaping a safer Internet for everyone.
Remember, while Security Center’s new capabilities offer advanced tools for URL Scanning for Cloudflare’s existing customers, the URL Scanner remains accessible for basic scans to the public on Cloudflare Radar, ensuring our technology benefits a broad audience.
If you’re considering a new career direction, check out our open positions. We’re looking for individuals who want to help make the Internet better; learn more about our mission here.
Balancing developer velocity and security against bots is a constant challenge. Deploying your changes as quickly and easily as possible is essential to stay ahead of your (or your customers’) needs and wants. Ensuring your website is safe from malicious bots — without degrading user experience with alien hieroglyphics to decipher just to prove that you are a human — is no small feat. With Pages and Turnstile, we’ll walk you through just how easy it is to have the best of both worlds!
Cloudflare Pages offer a seamless platform for deploying and scaling your websites with ease. You can get started right away with configuring your websites with a quick integration using your git provider, and get set up with unlimited requests, bandwidth, collaborators, and projects.
Cloudflare Turnstile is Cloudflare’s CAPTCHA alternative solution where your users don’t ever have to solve another puzzle to get to your website, no more stop lights and fire hydrants. You can protect your site without having to put your users through an annoying user experience. If you are already using another CAPTCHA service, we have made it easy for you to migrate over to Turnstile with minimal effort needed. Check out the Turnstile documentation to get started.
Alright, what are we building?
In this tutorial, we’ll walk you through integrating Cloudflare Pages with Turnstile to secure your website against bots. You’ll learn how to deploy Pages, embed the Turnstile widget, validate the token on the server side, and monitor Turnstile analytics. Let’s build upon this tutorial from Cloudflare’s developer docs, which outlines how to create an HTML form with Pages and Functions. We’ll also show you how to secure it by integrating with Turnstile, complete with client-side rendering and server-side validation, using the Turnstile Pages Plugin!
Step 1: Deploy your Pages
On the Cloudflare Dashboard, select your account and go to Workers & Pages to create a new Pages application with your git provider. Choose the repository where you cloned the tutorial project or any other repository that you want to use for this walkthrough.
Once you select “Save and Deploy”, all the magic happens under the hood and voilà! The form is already deployed.
Step 2: Embed Turnstile widget
Now, let’s navigate to Turnstile and add the newly created Pages site.
Here are the widget configuration options:
Domain: All you need to do is add the domain for the Pages application. In this example, it’s “pages-turnstile-demo.pages.dev”. For each deployment, Pages generates a deployment specific preview subdomain. Turnstile covers all subdomains automatically, so your Turnstile widget will work as expected even in your previews. This is covered more extensively in our Turnstile domain management documentation.
Widget Mode: There are three types of widget modes you can choose from.
Managed: This is the recommended option where Cloudflare will decide when further validation through the checkbox interaction is required to confirm whether the user is a human or a bot. This is the mode we will be using in this tutorial.
Non-interactive: This mode does not require the user to interact and check the box of the widget. It is a non-intrusive mode where the widget is still visible to users but requires no added step in the user experience.
Invisible: Invisible mode is where the widget is not visible at all to users and runs in the background of your website.
Pre-Clearance setting: With a clearance cookie issued by the Turnstile widget, you can configure your website to verify every single request or once within a session. To learn more about implementing pre-clearance, check out this blog post.
Once you create your widget, you will be given a sitekey and a secret key. The sitekey is public and used to invoke the Turnstile widget on your site. The secret key should be stored safely for security purposes.
Let’s embed the widget above the Submit button. Your index.html should look like this:
<!doctype html>
<html lang="en">
<head>
<meta charset="utf8">
<title>Cloudflare Pages | Form Demo</title>
<meta name="theme-color" content="#d86300">
<meta name="mobile-web-app-capable" content="yes">
<meta name="apple-mobile-web-app-capable" content="yes">
<meta name="viewport" content="width=device-width,initial-scale=1">
<link rel="icon" type="image/png" href="https://www.cloudflare.com/favicon-128.png">
<link rel="stylesheet" href="/index.css">
<script src="https://challenges.cloudflare.com/turnstile/v0/api.js?onload=_turnstileCb" defer></script>
</head>
<body>
<main>
<h1>Demo: Form Submission</h1>
<blockquote>
<p>This is a demonstration of Cloudflare Pages with Turnstile.</p>
<p>Pages deployed a <code>/public</code> directory, containing a HTML document (this webpage) and a <code>/functions</code> directory, which contains the Cloudflare Workers code for the API endpoint this <code><form></code> references.</p>
<p><b>NOTE:</b> On form submission, the API endpoint responds with a JSON representation of the data. There is no JavaScript running in this example.</p>
</blockquote>
<form method="POST" action="/api/submit">
<div class="input">
<label for="name">Full Name</label>
<input id="name" name="name" type="text" />
</div>
<div class="input">
<label for="email">Email Address</label>
<input id="email" name="email" type="email" />
</div>
<div class="input">
<label for="referers">How did you hear about us?</label>
<select id="referers" name="referers">
<option hidden disabled selected value></option>
<option value="Facebook">Facebook</option>
<option value="Twitter">Twitter</option>
<option value="Google">Google</option>
<option value="Bing">Bing</option>
<option value="Friends">Friends</option>
</select>
</div>
<div class="checklist">
<label>What are your favorite movies?</label>
<ul>
<li>
<input id="m1" type="checkbox" name="movies" value="Space Jam" />
<label for="m1">Space Jam</label>
</li>
<li>
<input id="m2" type="checkbox" name="movies" value="Little Rascals" />
<label for="m2">Little Rascals</label>
</li>
<li>
<input id="m3" type="checkbox" name="movies" value="Frozen" />
<label for="m3">Frozen</label>
</li>
<li>
<input id="m4" type="checkbox" name="movies" value="Home Alone" />
<label for="m4">Home Alone</label>
</li>
</ul>
</div>
<div id="turnstile-widget" style="padding-top: 20px;"></div>
<button type="submit">Submit</button>
</form>
</main>
<script>
// This function is called when the Turnstile script is loaded and ready to be used.
// The function name matches the "onload=..." parameter.
function _turnstileCb() {
console.debug('_turnstileCb called');
turnstile.render('#turnstile-widget', {
sitekey: '0xAAAAAAAAAXAAAAAAAAAAAA',
theme: 'light',
});
}
</script>
</body>
</html>
You can embed the Turnstile widget implicitly or explicitly. In this tutorial, we will explicitly embed the widget by injecting the JavaScript tag and related code, then specifying the placement of the widget.
Make sure that the div id you assign is the same as the id you specify in turnstile.render call. In this case, let’s use “turnstile-widget”. Once that’s done, you should see the widget show up on your site!
Now that the Turnstile widget is rendered on the front end, let’s validate it on the server side and check out the Turnstile outcome. We need to make a call to the /siteverify API with the token in the submit function under ./functions/api/submit.js.
First, grab the token issued from Turnstile under cf-turnstile-response. Then, call the /siteverify API to ensure that the token is valid. In this tutorial, we’ll attach the Turnstile outcome to the response to verify everything is working well. You can decide on the expected behavior and where to direct the user based on the /siteverify response.
/**
 * POST /api/submit
 */

import turnstilePlugin from "@cloudflare/pages-plugin-turnstile";

// This is a demo secret key. In prod, we recommend you store
// your secret key(s) safely.
const SECRET_KEY = '0x4AAAAAAASh4E5cwHGsTTePnwcPbnFru6Y';

export const onRequestPost = [
    turnstilePlugin({
    	secret: SECRET_KEY,
    }),
    (async (context) => {
    	// Request has been validated as coming from a human
    	const formData = await context.request.formData()

    	var tmp, outcome = {};
	for (let [key, value] of formData) {
		tmp = outcome[key];
		if (tmp === undefined) {
			outcome[key] = value;
		} else {
			outcome[key] = [].concat(tmp, value);
		}
	}

	// Attach Turnstile outcome to the response
	outcome["turnstile_outcome"] = context.data.turnstile;

	let pretty = JSON.stringify(outcome, null, 2);

      	return new Response(pretty, {
      		headers: {
      			'Content-Type': 'application/json;charset=utf-8'
      		}
      	});
    })
];
Since Turnstile accurately decided that the visitor was not a bot, the response for “success” is “true” and “interactive” is “false”. The “interactive” being “false” means that the checkbox was automatically checked by Cloudflare as the visitor was determined to be human. The user was seamlessly allowed access to the website without having to perform any additional actions. If the visitor looks suspicious, Turnstile will become interactive, requiring the visitor to actually click the checkbox to verify that they are not a bot. We used the managed mode in this tutorial but depending on your application logic, you can choose the widget mode that works best for you.
Now that we’ve set up Turnstile, we can head to Turnstile analytics in the Cloudflare Dashboard to monitor the solve rate and widget traffic. Visitor Solve Rate indicates the percentage of visitors who successfully completed the Turnstile widget. A sudden drop in the Visitor Solve Rate could indicate an increase in bot traffic, as bots may fail to complete the challenge presented by the widget. API Solve Rate measures the percentage of visitors who successfully validated their token against the /siteverify API. Similar to the Visitor Solve Rate, a significant drop in the API Solve Rate may indicate an increase in bot activity, as bots may fail to validate their tokens. Widget Traffic provides insights into the nature of the traffic hitting your website. A high number of challenges requiring interaction may suggest that bots are attempting to access your site, while a high number of unsolved challenges could indicate that the Turnstile widget is effectively blocking suspicious traffic.
And that’s it! We’ve walked you through how to easily secure your Pages with Turnstile. Pages and Turnstile are currently available for free for every Cloudflare user to get started right away. If you are looking for a seamless and speedy developer experience to get a secure website up and running, protected by Turnstile, head over to the Cloudflare Dashboard today!
The collective thoughts of the interwebz
By continuing to use the site, you agree to the use of cookies. more information
The cookie settings on this website are set to "allow cookies" to give you the best browsing experience possible. If you continue to use this website without changing your cookie settings or you click "Accept" below then you are consenting to this.